Spoken Lecture Summarization by Random Walk over a Graph Constructed with Automatically Extracted Key Terms Yun-Nung Chen † , Yu Huang † , Ching-Feng Yeh # , and Lin-Shan Lee †# †
Graduate Institute of Computer Science and Information Engineering # Graduate Institute of Communication Engineering †# National Taiwan University, Taiwan
[email protected],
[email protected]
Abstract
resented as a sequence of terms ti , is given an importance score: I(S, d)
This paper proposes an improved approach for spoken lecture summarization, in which random walk is performed on a graph constructed with automatically extracted key terms and probabilistic latent semantic analysis (PLSA). Each sentence of the document is represented as a node of the graph and the edge between two nodes is weighted by the topical similarity between the two sentences. The basic idea is that sentences topically similar to more important sentences should be more important. In this way all sentences in the document can be jointly considered more globally rather than individually. Experimental results showed significant improvement in terms of ROUGE evaluation. Index Terms: summarization, course lecture, probabilistic latent semantic analysis (PLSA), random walk, key term
1. Introduction In the Internet era, digital content over the network includes all the information and activities of human life. The most attractive form of network content is multimedia that may include speech. Such speech information usually tells the subjects, topics, and core concepts of the content. However, multimedia/spoken documents are just video/audio signals, usually much more difficult to retrieve and browse, because they cannot be easily displayed on the screen, and the user cannot simply ”skim through” each of them from the beginning to the end. Hence, spoken document summarization becomes very important [1]. Automatic summarization of spoken documents have been actively investigated. While most work was focused primarily on news content, recent effort has been increasingly directed to new domains such as lectures and meeting recordings [2, 3]. This paper takes course lecture as an example in the experiments. Many approaches selected a number of indicative sentences or passages from the original spoken documents according to a target summarization ratio, and sequenced them to form a summary. Some approaches tried to identify sentences carrying concepts closer to the complete documents [4]. The spoken document summarization actually carry intrinsic difficulties such as the recognition errors, problems with spontaneous speech, and lack of correct sentence or paragraph boundaries. A general approach has been found very successful [5, 6], in which each sentence in the document d, S = t1 t2 ...ti ...tn , rep-
=
n 1X [λ1 s(ti , d) + λ2 l(ti ) n i=1
+λ3 c(ti ) + λ4 g(ti )] + λ5 b(S),
(1)
where s(ti , d), l(ti ), c(ti ), g(ti ) are respectively some statistical measure (such as TF-IDF), linguistic measure (e.g., different parts-of-speech (PoSs) are given different weights), confidence score and N-gram score for the term ti , and b(S) is calculated from the grammatical structure of the sentence S, and λ1 , λ2 , λ3 , λ4 and λ5 are weighting parameters. For each document d, sentences used in the summary is then selected based on this importance score I(S, d). Prior work showed that the topical information obtained by probabilistic latent semantic analysis (PLSA) was very useful in estimating the statistical measure s(ti , d) in (1) above to identify the important sentences [7, 8]. Such topical information from PLSA is also used in this paper. We further rescore I(S, d) above in (1) by random walk over a graph to consider not only the importance of terms but the similarity between sentences in the whole document, so that sentences topically similar to more important sentences are given higher scores.
2. Proposed Approach 2.1. Probabilistic Latent Semantic Analysis (PLSA) PLSA [10] has been widely used to analyze the semantics of documents based on a set of latent topics. Given a set of documents {dj , j = 1, 2, ..., J} and all terms {ti , i = 1, 2, ..., M } they include, PLSA uses a set of latent topic variables, {Tk , k = 1, 2, ..., K}, to characterize the ”termdocument” co-occurrence relationships. The probability of observing a term ti given a document dj can be parameterized by P (ti | dj ) =
K X
P (ti | Tk )P (Tk | dj ).
(2)
k=1
The PLSA model can be optimized with EM algorithm by maximizing a likelihood function [10]. 2.1.1. Latent Topic Significance (LTS) Latent Topic Significance (LTS) for a given term ti with respect to a topic Tk can be defined [7, 8] as P dj ∈D n(ti , dj )P (Tk | dj ) , (3) LTSti (Tk ) = P dj ∈D n(ti , dj )[1 − P (Tk | dj )]
where n(ti , dj ) is the occurrence count of term ti in a document dj . In the numerator of (3), the count of the given term ti in each document dj , n(ti , dj ), is weighted by the likelihood that the given topic Tk is addressed by the document dj , P (Tk | dj ), and then summed over all documents dj in the training corpus D. Therefore the numerator is the total count of the given term ti used for the given topic Tk over the whole training corpus, as estimated by PLSA model. The denominator is very similar except for latent topics other than Tk , so P (Tk | dj ) is replaced by [1 − P (Tk | dj )]. Thus, a higher LTSti (Tk ) indicates the term ti is more significant for the latent topic Tk . 2.1.2. Latent Topic Entropy (LTE) Latent Topic Entropy (LTE), LTE(ti ), for a given term ti can be calculated as (4) from the topic distribution P (Tk | ti ) for each term ti , LTE(ti ) = −
K X
P (Tk | ti ) log P (Tk | ti ),
2.3.2. Key-Term-Based Statistical Measure With automatically extracted key terms (with some errors) as mentioned above, we can estimate a new latent topic probability PKEY (Tk | d) hopefully better than P (Tk | d) directly from PLSA, P ti ∈key n(ti , d)P (Tk | ti ) PKEY (Tk | d) = PK P , (7) k=1 ti ∈key n(ti , d)P (Tk | ti ) where key is the set of automatically extracted key terms, and P (Tk | ti ) is in (5). Therefore only the automatically extracted key terms ti in d are considered, avoiding the influence from other insignificant terms. We can then define the statistical measure s(ti , d) as
(4) sKEY (ti , d) =
k=1
where the topic distribution P (Tk | ti ) can be estimated as follows [7, 8], P (Tk | ti ) =
very successful ”significance score” in speech summarization [6], and here we use sLTE (ti , d) as the baseline.
P (ti | Tk ) · P (Tk ) , P (ti )
(5)
where the probability P (Tk ) is left out because a good approach to estimate it is not yet available, while P (ti ) can be obtained from a large corpus. LTE(ti ) is a measure of how the term ti is focused on a few topics, so a lower latent topic entropy implies the term carries more topical information. 2.2. Automatic Key Term Extraction Key terms are the terms used in the documents carrying core concepts of the content. They are useful for indexing, retrieving, and browsing. There are in general two types of key terms: keywords (single words) and key phrases (such as ”hidden Markov model”). Automatically extracting key terms from spoken content is still a difficult problem, but some initial approaches have been shown to be successful in recent experiments [9]. Such approaches include use of right/left branching entropy derived from PAT-Trees to extract frequently occurring patterns including two or more words, and identifying or verifying key terms (including key phrases) by prosodic (pitch, duration, energy), lexical, and semantic (from PLSA) features with unsupervised techniques or supervised training [9]. Here well show such automatically extracted key terms are very helpful in summarization. 2.3. Statistical Measures of a Term Here in this work, the statistical measure of a term ti , s(ti , d) in (1) can be defined in two different ways below.
βn(ti , d) , LTE(ti )
(8)
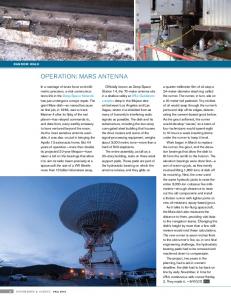
where the information of LTSti (Tk ) in (3) is used here. 2.4. Random Walk on a Graph We formulate the sentence selection problem as random walk on a directed graph, in which each sentence is a node and the edges between them are weighted by topical similarity. The basic idea is that a sentence similar to more important sentences should be more important [12, 13]. In this way all sentences in the document can be jointly considered more globally rather than individually. We define two directed edges between each pair of nodes with two directions, weighted by an asymmetric topical similarity between them, We then keep only the top N outgoing edges with the highest weights from each node, while consider incoming edges to each node for importance propagation in the graph. A simplified example for such a graph is in Figure 1, in which Ai and Bi are the sets of neighbors of the node Si connected respectively by outgoing and incoming edges. 2.4.1. Topical Similarity between Sentences Within a document d, we can first compute the probability that the topic Tk is addressed by a sentence Si , P t∈Si n(t, Si )P (Tk | t) P P (Tk | Si ) = . (9) t∈Si n(t, Si ) Then an asymmetric topical similarity sim(Si , Sj ) for sentences Si to Sj (with direction Si → Sj ) can be defined by accumulating LTSt (Tk ) in (3) weighted by P (Tk | Si ) for all terms t in Sj over all latent topics, K XX
LTSt (Tk )P (Tk | Si ),
(10)
t∈Sj k=1
The statistical measure s(ti , d) in (1) can be defined based on LTE(ti ) in (4) as sLTE (ti , d) =
LTSti (Tk )PKEY (Tk | d),
k=1
sim(Si , Sj ) =
2.3.1. LTE-Based Statistical Measure
K X
(6)
where β is a scaling factor, so the score sLTE (ti , d) is inversely proportion to the latent topic entropy LTE(ti ). Some previous works [7, 8] showed that this measure outperformed the
We normalize this similarity by the total similarity summed over the top N sentences Sk with edges outgoing from Si , or the set Ai , to produce the weight p(i, j) for the edge from Si to Sj on the graph, p(i, j) = P
sim(Si , Sj ) . sim(Si , Sk )
Sk ∈Ai
(11)
S1
S5 p(3, 4)
S3
p(4, 3)
S4
A4 = {S3, S5, S6} B4 = {S3, S6}
S2
S6
Figure 1: A simplified example of the graph considered. Each sentence is represented as a node on the graph. Ai and Bi are the neighbors of the node Si connected respectively by outgoing and incoming edges. 2.4.2. Random Walk Random walk [12, 13] is now performed over the graph obtained above. v(i) is the new score for node Si , which is the interpolation of two scores, the normalized initial importance r(i) for node Si and the score contributed by all neighboring nodes Sj of node Si weighted by p(j, i), X v(i) = (1 − α)r(i) + α p(j, i)v(j), (12) Sj ∈Bi
where α is the interpolation weight, Bi is the set of neighbors connected to node Si via incoming edges, and r(i) = P
I(Si , d) I(Sj , d)
(13)
in the host language of Mandarin Chinese but with almost all terminologies produced in the guest language of English and embedded in the Mandarin utterances. There is a total of 17 chapters, while the lecture is 45.2 hours long. We segmented the whole lecture into 155 documents by topic segmentation [15], and extracted the summary for each document. 34 documents out of the 155 were tested. The average length of each document was about 17.5 minutes, and manual transcriptions without word errors and ASR results were both used. For ASR, the acoustic models were trained with the ASTMIC corpus for Mandarin and the Sinica Taiwan English corpus for English respectively, and then adapted by 25.2 minutes bilingual corpus from the target speaker (the course instructor) [16]. The language model was trained by two other courses offered by the same instructor and adapted by the course slides. The accuracies for the ASR transcriptions are 78.15% for Mandarin characters, 53.44% for English words, and 76.26% for overall. The automatically key term extraction approach mentioned in Section 2.2 was used and both keywords and key phrases were extracted [9]. The F-measures for key terms were 62.70% and 67.31% for ASR and manual transcriptions respectively. We set the number of topics for PLSA as 32, considering the course of 17 chapters. The value of α is set to 0.9, which is empirically better choice [12, 13]. Two human subjects (students at National Taiwan University) were requested to produce two reference summaries for each document by ranking the importance of the sentences in each document from ”the most important” to ”of average importance.” 3.2. Evaluation Metrics
Sj
is the importance score of sentence Si , I(Si , d), defined in (1), but normalized by the sum of such scores for all sentences Sj in the document d. (12) can be solved with the approach very similar to that for the PageRank problem [11]. Let v = [v(i), i = 1, 2, ..., L]T and r = [r(i), i = 1, 2, ..., L]T be the column vectors for v(i) and r(i) for all sentences in the document, where L is the total number of sentences in the document d and T represents transpose. (12) then has a vector from below, v
=
(1 − α)r + αPv
=
((1 − α)reT + αP)v = P0 v,
(14)
where P is an L × L matrix of p(j, i), and e = [1, 1, ..., 1]T is an being 1. Because P L-dimensional vector with all components T i v(i) = 1 from (12) and (13), e v = 1. It has been shown that the solution v of (14) is the dominant eigenvector of P0 [14], or the eigenvector corresponding to the largest absolute eigenvalue (which is 1) of P0 . The solution v(i) can then be integrated with the original importance score I(Si , d) using LTE-based statistical measure (6) or key-termbased statistical measure (8), ˆ i , d) = I(Si , d)(v(i))δ , I(S
(15)
where δ is a weighting parameter.
3. Experimental Setup 3.1. Corpus The corpus used in this research is the lectures for a course offered in National Taiwan University. The lectures were given
The well-known evaluation package called ROUGE [17] was used in this research, including ROUGE-N (N = 1, 2, 3) and ROUGE-L scores. ROUGEr -N is an N-gram recall between the automatically generated summary and a set of manually generated reference summaries calculated as P P Countmatch (gramN ) gramN ∈S S∈S P P , (16) ROUGEr -N = Count(gramN ) gram ∈S S∈S N
where N stands for the length of N-gram considered, gramN ; S is an individual reference summary, and S is a set of reference summaries. Countmatch (gramN ) is the maximum number of N-grams co-occurring in the automatically generated summary and the reference summary. Count(gramN ) is then the total number of N-grams in the reference summary. ROUGE-L is similarly obtained but counting the ”longest common subsequence” (LCS) between the automatically generated summary and the reference summary. F-measures for ROUGE-N (N = 1, 2, 3) and ROUGE-L can be evaluated in exactly the same way, which are used in the following results.
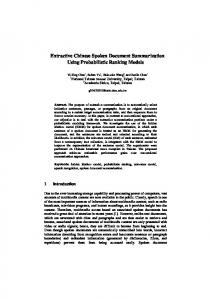
4. Results and Discussion In the experiments to be presented below, the summarization ratio was set to be 10%, 20%, and 30% respectively. The key phrases (with more than one word) automatically extracted were taken as individual terms in PLSA modeling and all following processes. Figure 2 shows the results for ROUGE-N and ROUGE-L for ASR (Figure 2 (a)-(d)) and manual transcriptions (Figure 2 (e)-(h)). In each case the three groups of bars are for 10%, 20%, and 30% summarization ratios, and in each group the four bars
(e) Manual:ROUGE−1 F−measure
F−measure
(a) ASR:ROUGE−1 55 50 45 10%
20%
50
30%
10%
20 20%
30 25
30%
10%
(c) ASR:ROUGE−3
30%
25 F−measure
F−measure
20%
(g) Manual:ROUGE−3
25 20 15 10
20 15 10
10%
20%
30%
10%
(d) ASR:ROUGE−L
20%
ROUGE-1 ROUGE-2 ROUGE-3 ROUGE-L
ASR Transcriptions 10% 20% 30% 5.30 7.19 7.13 13.94 15.48 17.45 24.98 22.23 21.33 6.23 7.51 7.92
Manual Transcriptions 10% 20% 30% 14.37 8.27 6.74 33.31 18.33 15.33 50.98 28.21 22.25 14.52 9.12 7.49
tant sentences so that topical similarity cannot improve the performance in all cases; also, the RI with 10% summarization ratio is highest, probably because key terms are very helpful to identify top 10% important sentences; but with roughly 67% of F-measure of key terms, the top 20% or 30% important sentences selected did include some noisy sentences.
30%
5. Conclusions
(h) Manual:ROUGE−L 55 F−measure
55 F−measure
30%
20 10%
50 45 40
20%
(f) Manual:ROUGE−2 F−measure
F−measure
25
Table 1: Maximum relative improvement (RI) with respect to the baseline achievable in all cases (%). MAX RI
45
(b) ASR:ROUGE−2 30
1:LTE 2:LTE+RW 3:Key 4:Key+RW
55
10%
20%
30%
50 45 40
10%
20%
30%
Figure 2: The results of different choices of parameters: LTEbased (1, 2) or key-term-based (3, 4), without (1, 3) or with (2, 4) random walk, for ASR ((a)-(d)) or manual ((e)-(h)) transcriptions at summarization ratios of 10%, 20%, and 30%. are respectively for LTE-based statistical measure sLTE (ti , d) in (6) (LTE, the baseline), that followed by random walk (LTE + RW), key-term-based statistical measure in (8) (Key) and that followed by random walk (Key + RW). In all cases, the keyterm-based statistical measure (bar 3) always outperformed the baseline (bar 1), or the LTE-based statistical measure. Clearly the key term knowledge is very helpful, especially for manual transcriptions. This is probably because in manual transcriptions all key terms are correctly transcribed (although may be incorrectly extracted) so that the key-term-based statistical measures were much more accurately estimated. Similar improvements can also be observed for ASR transcriptions, but slightly less significant. In all cases, random walk based on topical similarity always helped the LTE-based statistical measure (bar 2 vs bar 1) For ASR transcriptions (Figure 2 (a)-(d)), random walk also improved the performance of key-term-based statistical measure (bar 4 vs bar 3). However, with 10% summarization ratio for manual transcriptions (Figure 2 (e)-(h)), random walk wasn’t able to similarly help the key-term-based statistical measure (bar 4 vs bar 3). The reason is probably that for manual transcriptions the important sentences within 10% were already very well selected by the key-term-based statistical measure, so adding extra topical similarity among many sentences cannot further improve the performance. However, the important sentences ranked between top 10% to 30% are less clear and therefore random walk can help the key term knowledge (bar 4 vs bar 3) for 20% and 30% of summarization ratio (Figure 2 (e)-(h)). Table 1 lists the maximum relative improvement (RI) achievable with respect to the baseline in all cases discussed above. For ASR transcriptions, the RI with different summarization ratios are similar, and the results are all from key-termbased statistical measure with random walk, probably because the topical similarity can compensate recognition errors and help include important sentences. For manual transcriptions, on the other hand, the results are from LTE-based statistical measure with or without random walk, probably because without recognition errors the key terms can accurately include impor-
Extensive experiments and evaluation with ROUGE metrics showed key-term-based statistical measure is good for speech summarization, and random walk also improves the performance. The random walk approach helps give higher scores to sentences topically similar to more important sentences, and thus consider all sentences in the document more globally.
6. References [1] [2] [3]
[4]
[5]
[6]
[7]
[8]
[9]
[10] [11]
[12] [13] [14] [15] [16]
[17]
L. Lee, B. Chen, ”Spoken document understanding and organization, in Special Section, IEEE Signal Processing Megazine, 2005. J. Glass and et al., ”Recent progress in the MIT spoken lecture processing project,” in InterSpeech, 2007. S. Banerjee, A. Rudnicky, ”An extractive-summarizaion baseline for the automatic detection of noteworthy utterances in multiparty human-human dialog,” in SLT, 2008. Y. Gong, X. Liu, ”Generic text summarization using relevance measure and latent semantic analysis,” in ACM SIGIR Conference on R&D in Information Retrieval, 2001. J. Goldstein, M. Kantrowitz, and J. Carbonell, ”Summarizing text documents: Sentence selection and evaluation metrics,” in ACM SIGIR Conference on R&D in Information Retrieval, 1999. S. Furui and et al., ”Speech-to-text and speech-to-speech summarization of spontaneous speech,” in IEEE Trans. on Speech and Audio Processing, 2004. S. Kong, L. Lee, ”Improved spoken document summarization using probabilistic latent semantic analysis (PLSA),” in ICASSP, 2006. S. Kong, L. Lee, ”Improved summarization of chinese spoken documents by probabilistic latent semantic analysis (PLSA) with further analysis and integrated scoring,” in SLT, 2006. Y. Chen and et al., ”Automatic key term extraction from spoken course lectures using branching entropy and prosodic/semantic features,” in SLT, 2010. T. Hofmann, ”Probabilistic latent semantic analysis,” in University in AI, 1999. L. Page and et al, ”The pagerank citation ranking: bringing order to the web,” in Technical Report, Stanford Digital Library Technologies Project, 1998. Y. Chen and et al, ”Improved spoken term detection with graphbased re-ranking in feature space,” in ICASSP, 2011. W. Hsu, L. Kennedy, ”Video search reranking through random walk over document-level context graph,” in MM, 2007. A. Langville, C. Meyer, ”A survey of eigenvector methods for web information retrieval,” in SIAM Review, 2005. S. Hsu, ”Topic segmentation on lecture corpus and its application,” in Master’s thesis of NTU, 2008. C. Yeh and et al, ”Bilingual acoustic modeling with state mapping and three-stage adaptation for transcribing unbalanced codemixed lectures,” in ICASSP, 2011. C. Lin, ”Rouge: A package for automatic evaluation of summaries,” in Workshop on Text Summarization Branches Out, 2004.