publication, contact Prevent Blindness for updates. FS09 7/14 © 2014 Prevent Blindness®. All rights reserved. Sports-R
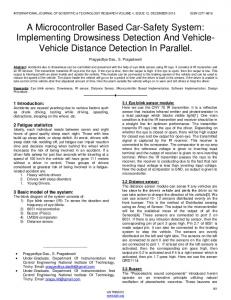
Sports-Related Eye Injuries by Age Activity
Estimated Injuries*
Ages 0–14
Ages 15+
Water and Pool Activities
5,480
2,608
2,872
Basketball
4,644
1,271 3,373
Baseball/Softball
2,353
1,149 1,203
Guns–Air, Gas, Spring, BB
2,312
1,394
917
Football
1,762
1,101
662
Soccer
1,669
415
1,253
Bicycles
1,634
619
1015
“Health Club” (Exercise, Weightlifting)
1,278
275
1,003
Racquet Sports
1,179
485
694
Golf
657
26
631
Fishing
650
185
465
Scooters, Skateboards, Go-Karts
533
280
253
Boxing, Wrestling
515
30
485
Ball Sports, Unspecified
401
266
134
Winter Sports
161
102
59
25,228
10,206
15,019
Totals Top 15 Categories
211 West Wacker Drive, Suite 1700 Chicago, Illinois 60606 800.331.2020 PreventBlindness.org
*Totals may not equal due to rounding.
Table source: Prevent Blindness. Based on statistics provided by the U.S. Consumer Product Safety Commission, Directorate for Epidemiology; National Injury Information Clearinghouse; National Electronic Injury Surveillance System (NEISS). Product Summary Report—Eye Injuries Only—Calendar Year 2013.
This publication is copyrighted. This sheet may be reproduced—unaltered in hard print (photocopied) for educational purposes only. The Prevent Blindness name, logo, telephone number and copyright information may not be omitted. Electronic reproduction, other reprint, excerption or use is not permitted without written consent. Because of the time-sensitive nature of the information contained in this publication, contact Prevent Blindness for updates. FS09 7/14 © 2014 Prevent Blindness® All rights reserved.