SURVEY DATA CLEANING GUIDELINES: (SPSS AND STATA) ... and support on survey research methods and data handling and analysis related to data collection in our ..... record type is read into the format of the software to be used for.
MSU International Development Working Paper
Survey Data Cleaning Guidelines: (SPSS and Stata). 1st Edition by Margaret Beaver
MSU International Development Working Paper No. 123 April 2012
Department of Agricultural, Food, and Resource Economics Department of Economics MICHIGAN STATE UNIVERSITY East Lansing, Michigan 48824 MSU Agricultural Economics Web Site: http://www.aec.msu.edu MSU Food Security Group Web Site: http://www.aec.msu.edu/fs2/index.htm MSU is an affirmative-action, equal-opportunity employer
MSU INTERNATIONAL DEVELOPMENT PAPERS The Michigan State University (MSU) International Development Paper series is designed to further the comparative analysis of international development activities in Africa, Latin America, Asia, and the Near East. The papers report research findings on historical, as well as contemporary, international development problems. The series includes papers on a wide range of topics, such as alternative rural development strategies; nonfarm employment and small scale industry; housing and construction; farming and marketing systems; food and nutrition policy analysis; economics of rice production in West Africa; technological change, employment, and income distribution; computer techniques for farm and marketing surveys; farming systems and food security research. The papers are aimed at teachers, researchers, policy makers, donor agencies, and international development practitioners. Selected papers will be translated into French, Spanish, or other languages. Copies of all MSU International Development Papers, Working Papers, and Policy Syntheses are freely downloadable in pdf format from the following Web sites: MSU International Development Papers http://www.aec.msu.edu/fs2/papers/idp.htm http://ideas.repec.org/s/ags/mididp.html MSU International Development Working Papers http://www.aec.msu.edu/fs2/papers/idwp.htm http://ideas.repec.org/s/ags/midiwp.html MSU International Development Policy Syntheses http://www.aec.msu.edu/fs2/psynindx.htm http://ideas.repec.org/s/ags/midips.html Copies of all MSU International Development publications are also submitted to the USAID Development Experience Clearing House (DEC) at: http://dec.usaid.gov/
SURVEY DATA CLEANING GUIDELINES: (SPSS AND STATA) 1st Edition
by Margaret Beaver April 2012 Funding for this document was provided by the American people, via the Food Security III Cooperative Agreement (GDGA‐00‐ 000021‐00) between Michigan State University and the United States Agency for International Development, Bureau for Food Security, Office of Agriculture, Research, and Technology. Beaver is a senior survey research specialist with the Food Security Group at Michigan State University.
ISSN 0731‐3483 © All rights reserved by Michigan State University, 2012 Michigan State University agrees to and does hereby grant to the United States Government a royalty‐free, non‐exclusive and irrevocable license throughout the world to use, duplicate, disclose, or dispose of this publication in any manner and for any purposes and to permit others to do so. Published by the Department of Agricultural, Food, and Resource Economics and the Department of Economics, Michigan State University, East Lansing, Michigan 48824‐1039, U.S.A. ii
FOREWORD This publication is one of a series of MSU Food Security Project monographs and tutorials on social science research, including survey design and implementation, and data cleaning and analysis. As noted in the Acknowledgments, these materials owe a lot to the contributions of many individuals, including Food Security Project faculty, students and staff, and colleagues within collaborating institutions. Especially noteworthy among Food Security Project staff are Ellen Payongayong and Margaret Beaver, who have provided expert advice and support on survey research methods and data handling and analysis related to data collection in our country projects, including Mozambique (Payongayong) and Kenya, Zambia, and Mali (Beaver), among others. Margaret Beaver has also played a major training role, both on campus and in the field, and has prepared an extensive and regularly updated set of training materials in the use of SPSS and Stata (listed below). This paper represents a distillation of Margaret Beaver’s many years of experience in supporting major survey research projects in Africa. The paper focuses particularly on the process of preparing data for analysis after data entry is completed. Given the importance of careful quality control at this step, we believe that this paper will be a valuable reference for all who are engaged in survey research. Michael T. Weber, Former Co‐Director, Food Security III Cooperative Agreement Eric W. Crawford, Co‐Director, Food Security III Cooperative Agreement Other publications on social science survey research and use of SPSS and Stata include: On Research and Data Handling Methods
Food Security by The Numbers. Observations from the USAID‐MSU Food Security Cooperative Agreement FS III. Challenges in Collecting and Using Information To Inform Goals of Poverty Reduction, Food Security, Enhanced Productivity and Income Growth for Small‐Scale Farmers. Michael T. Weber. Presented at 2010 USAID Economic Growth Officer’s Conference. Washington DC. June 21‐25, 2010. Data Preparation and Analysis. Margaret Beaver and Rick Bernsten. June 2009. Complex Survey Design & Other Challenges: Zambian Agricultural Surveys. Cynthia Donovan. Presentation to the Graduate‐level Statistics Course STT 825: Sample Surveys. November 28, 2007. Wells Hall, Michigan State University. An Analytical Review and Synthesis of Preferred Research Methods in the MSU Food Security Project. James F. Tefft with Michael T. Weber and John M. Staatz (1990). IDWP No. 38. Computer Analysis of Survey Data — File Organization for Multi‐Level Data. Chris Wolf, Agricultural, Food and Resource Economics Computer Service, Michigan State University (1990). Download English | Français Introduction To Statistics for Agricultural Economists Using SPSS. Scott M. Swinton and Ricardo A. Labarta, Agricultural, Food and Resource Economics, Michigan State iii
University. 2003. Download English | Español Self‐Tutorial Sample Session for STATA
STATA 11 ‐ Sample Session. Cross‐Sectional Analysis Short Course Training Materials Designing Policy Relevant Research and Data Processing and Analysis with STATA 11 1st Edition. March 2010. o Instructions o Data STATA 10 for Windows SAMPLE SESSION. Cross‐Sectional Analysis. Short Course Training Materials. Designing Policy Relevant Research and Data Processing and Analysis with STATA 10 for Windows 1st Edition. o Instructions o Data STATA 8 for Windows SAMPLE SESSION. Cross‐Sectional Analysis. Short Course Training Materials. Designing Policy Relevant Research and Data Processing and Analysis with STATA 8 for Windows 8th Edition. o Instructions o Data
Self‐Tutorial Sample Sessions for SPSS
Instructions and description of the sample sessions Data required for all of the following sample sessions (in Zip format) (for Portuguese TS data see below). This file contains the data files necessary to properly run all the sample sessions. The commands in the sample sessions assume that your data is stored in c:\docs\sample, so we recommend that you unzip the sample files to that folder. Self‐Tutorial Sample session for Windows‐Cross Sectional Analysis. Department of Agricultural, Food and Resource Economics, Michigan State University. o SPSS 19 (2011). English o SPSS 17 (2009). English (CDIE reference number pending) o SPSS 15 (2007). English o SPSS 10.0 4th Edition (2000). English | Português | Français | Español o SPSS 7.5 Revised by Jean‐Charles Le Vallée, 3rd Edition (1999) English | Português Self‐Tutorial Sample session for Windows‐Time Series Analysis. Department of Agricultural, Food and Resource Economics, Michigan State University. o SPSS 10.0 2nd Edition (2000) English | Português Dados para TS 10 em Portugues (in Zip Format) o SPSS 7.5 Revised by Jean‐Charles Le Vallée, 3rd Edition (1999) English
iv
ACKNOWLEDGMENTS Financial support for this work was provided by the United States Agency for International Development (USAID) Bureau of Economic Growth, Agriculture, and Trade (EGAT) and the Bureau of Food Security (BFS) through the Food Security I, II and III Cooperative Agreements. Supplemental funding was also received from USAID Country Missions in Mali, Mozambique, Kenya, and Zambia, as well as from Swedish Sida in Zambia, and from Rockefeller and Gates Foundations. The author would like to recognize many years of collaboration and support from countless colleagues and organizations. Among those at MSU, thanks go especially to AFRE computer support unit team members (including Chris Wolf and Wendy Peters, who drafted the original training materials on the use of SPSS), and to graduate students, faculty, and Food Security Research Project colleagues. Thanks go also to cooperating colleagues at the U.S. Bureau of the Census, and to SPSS and Stata for providing the tools to help manage data, and to facilitate tracking down problems within the data. Among many in developing countries, thanks go to Food Security Project data management staff and research counterparts in Ministries of Agriculture and Statistics, as well as national agricultural research organizations in Mali, Mozambique, Zambia, and in Kenya at the Tegemeo Institute of Agricultural Policy and Development at Egerton University. Finally, thanks goes to enumerators everywhere who facilitated the development of a detailed method to identify internal consistency and related problems. Benedito Cungara reviewed the draft document and contributed a few suggestions and modifications. Patricia Johannes contributed excellent editorial and formatting assistance. This document reflects the views of the author only.
v
TABLE OF CONTENTS FOREWORD ......................................................................................................................................................... iii ACKNOWLEDGMENTS ..................................................................................................................................... v Introduction ......................................................................................................................................................... 1 Preparing the computer for data cleaning ............................................................................................. 1 Common folder structure to be used by all who are working on the data ............................... 1 Backup procedure for data cleaning ......................................................................................................... 2 Identification of sampled areas ................................................................................................................... 2 Procedure to export from CSPro ................................................................................................................ 3 Modification of the syntax file created by CSPro to import data .................................................. 8 Modification 1 – Add comments, add a file handle, and modify the folder reference .......... 8 Modification 2 – Correct variable names and variable/ value labels: .................................. 10 Example of changes to the “data list” command for SPSS ............................................. 11 Example of changes to the “infix dictionary” command in Stata in the file with the extension “.dct” ............................................................................................................... 11 Variable label modification............................................................................................. 12 Value label modification ................................................................................................. 13 Modification 3 – Add dataset name, run frequencies, and save file .................................... 14 Modification 4 – Save syntax/do file to a new name ........................................................... 15 Importing all data from CSPro to SPSS or Stata ................................................................................. 15 Development of the cleaning syntaxes / do files ............................................................................... 16 Add comments to the syntax or do file ................................................................................ 17 Initial processing commands to bring the file from the \arch to the \clndata folder ............ 17 Verification of sample .................................................................................................................................... 20 Sequence of checks to be done to verify the data .............................................................................. 24 Verify location variables ...................................................................................................... 25 Run syntax (do) files in logical order for each section ........................................................ 25 Check for duplicate observations ......................................................................................... 25 Keep track of the number of cases in the data file ............................................................... 25 Check “filter” questions ....................................................................................................... 25 Process the variables sequentially ........................................................................................ 26 Procedure to use to check the listings produced from queries ................................................... 26 Establish a procedure to document data that were not collected .............................................. 27 Verify skip rules ............................................................................................................................................... 27
vii
Compare variables within a file to check for logical issues ........................................................... 27 Standardize data to kgs where a unit is asked .................................................................................... 27 Check for consistencies within a set of cases for a household ..................................................... 28 Sort the file in various ways to look for odd data .............................................................................. 28 Cross file checks ............................................................................................................................................... 29 SPSS: TEMPORARY command .................................................................................................................. 29 Stata: list if command… ................................................................................................................................. 30 Forgetting to block the “TEMPORARY” command ............................................................................ 31 Decision rules for when to change a value and when NOT to change a value ...................... 31 Data entry errors .................................................................................................................. 31 Enumerator Errors................................................................................................................ 31 Problems that Cannot be Changed ....................................................................................... 32 Data correction methods .............................................................................................................................. 32 IF statement .......................................................................................................................... 32 SPSS: DO IF statement ....................................................................................................... 33 Deleting Cases ..................................................................................................................... 34 Developing the correction syntaxes using Excel ............................................................................... 35 Final Processing Steps ................................................................................................................................... 38
viii
ACRONYMS/ABBREVIATIONS CFS crop forecast survey Const constituency CSA census supervisory area CSPro Census and Survey Processing System, U.S. Census Bureau Dist District Excel Microsoft spreadsheet application Ha hectares KB kilobytes Kgs kilograms PHS post harvest survey Prov Province SEA standard enumeration area SPSS Statistical Package for the Social Scientist Stata Data analysis and statistical program Ward ward CSPro file extension definitions: .dcf dictionary file .exf export file SPSS file extension definitions: .sav data file .sps syntax file .dat ASCII file Stata file extension definitions: .dta data file .do do (syntax) file .dat ASCII file .dct dictionary file
ix
Introduction
Preparing the computer for data cleaning
The purpose of this document is to outline the steps in the process of preparing data for analysis after data entry is complete. Examples of commands are given for both SPSS – version 19 – and Stata – version 11. These steps are a culmination of two decades of working with agricultural surveys in Kenya, Zambia, Mali and Mozambique. The computers that are to be used for data cleaning should be prepared following the guidelines below: 1. The computer must have all viruses removed and a current virus checker installed to guard against introductions of viruses from other UBS devices or the web. A virus can easily corrupt the data files requiring that the data be rekeyed. 2. A full hard drive slows down your computer. It will take longer to access files. Windows often creates temporary and setup files. Use Disk Cleanup to remove them. a.
Common folder structure to be used by all who are working on the data
Access Disk Cleanup by clicking Start>>All Programs>>Accessories>>System Tools>>Disk Cleanup. The computer will calculate how much disk space is being used by different activities and show you the list. The files placed in the Recycle Bin will be listed here too. You can choose to remove the tick mark on certain ones if you wish to. Then click on the button “Clean up System Files” to regain the space.
3. The computer should be defragmented to obtain more efficient operation, if it has been used frequently for data manipulations. All programs and files should be closed before you start this activity. a. Access Disk Defragmenter by clicking Start>>All Programs>>Accessories>>System Tools>>Disk Defragmenter. First ask to analyze the computer. Click on “Analyze Computer”. The percent of fragmentation will be shown. b. You can decide to defragment or not. For some computers it may take a very long time, even over night, to complete the defragmentation. A standard folder structure should be decided so that all computers are using the same folder structure. It will facilitate the development of the standardized cleaning syntaxes. A suggested folder structure you might use is: C:\.... your computer’s setup for folders (the folder structure will vary depending on the operating system that the computer uses) \Documents\ \PHS – (name of the survey group, e.g., PHS or CFS or LCMS) \1011 – (specific survey name) \anal – all syntax/do files and data files developed during analysis that the analyst wants to keep \arch – archived original files from final export of data from CSPro (or data entry program) \prog – program files for the data entry \clnsyntax – cleaning syntax/do files \clndata – store the versions of each file as they are cleaned here \data – final data set ready for analysis 1
\docs – questionnaires, enumerator manual, documentation of problems in the data and how they were adjusted or left for the analyst to determine how to handle \lookup – store lookup files here, e.g., cropconv.sav (conversion to standardized to a kg), haconver.sav (hectare conversion), other conversion files as needed \weights – store the files that are used to determine the weights here \tmp – store temporary files here that you do not want to keep. You can easily delete these files when you no longer need them.
Backup procedure for data cleaning
Identification of sampled areas
The backup procedure should be determined. The backup should occur at the end of the day. If you are modifying a large amount of data, you may want to backup twice during the day. A suggested backup procedure might be to use an external computer (networked) or a read/write CD or a large flash disk to copy the folder for the survey to a folder on the backup media at the end of the day. An example of the folder names on the backup media: \provincename_survey, e.g., (Luapula_PHS1011) \10Oct11 – copy the folder (1011 as shown above) and all subfolders to this folder on 10 Oct \11Oct11 – copy the folder (1011 as shown above) and all subfolders to this folder on 11 Oct \12Oct11 – copy the folder (1011 as shown above) and all subfolders to this folder on 12 Oct The listing of the areas to be sampled must be available to verify that the coding for the identifying variables is correct.
For example: in Zambia, the cluster and the prov, dist, const, ward, region, CSA, and SEA are the identifying variables. The data were entered using CSPro. These codes can be easily corrected using the CSPro data entry program for the specific sampled area.
A file should be created that contains the identifying variables for the selected sample.
For Zambia the file should contain the details for the selected SEAs (standard enumeration area). The variables are: cluster, prov, dist, const, ward, region, CSA and SEA. There may be other variables as well that were generated during the selection of the SEAs. The name of the file should be something similar to “district_summaries_xxxx.sav” where xxxx reflects the year, e.g., 1011 or 1112, etc. If data are entered into CSPro where there is a separate batch file for each of the selected areas, the data must be concatenated together into one file for that major area. In Zambia the unit of cleaning is the “province”. The concatenated data are then exported from the CSPro application to the data format of the application package that will be used for cleaning. Data can be exported in SPSS or Stata format as well as many other formats. 2
Procedure to export from CSPro
Generally it is expected the first record type from the CSPro program will be the main level of data, e.g., if the survey is a household survey, the first record type will contain variables where data are collected at the household level. This tutorial assumes the sample is a household‐level survey. To verify the data are correct for the sampling frame, the first record type is read into the format of the software to be used for cleaning. The data file is then compared with the file created above that contains the sample. Where there are any mismatches, the corrections should be done in CSPro. Once the verification of location and identification variables is complete, a final export from CSPro is done. Below is the procedure to export data from CSPro. 1. In CSPro, all the batch files for each major group (i.e., province for Zambia) must be concatenated to one batch file. It will depend on your survey how you combine batch files. 2. Start CSPro. a. Click on Tools >> Concatenate Data You will see the dialog box titled “CSConcat”.
b. In the box for “Output Files:” fill in the name of the file to concatenate to (add all the batch files). To do this, click on Browse, navigate to the folder where the individual batch files are stored (….\arch). The file name for the Output file should refer to the level to which you want to concatenate. In Zambia the individual batch files are for each of the clusters in the province. All the batch files for the province need to be combined. The Output file name will be given the name of the province. For the province “Central” the Output file name will be central.bch. (This is a new file you are creating which will contain all batch files added into one file.) c. The complete path will display in the Output File name box. The folder reference should reflect the survey on which you are working. 3
d. Click on “Add” at the lower left corner of the screen to select the batch files you want to concatenate. The batches will be named according to how the subgroups of data were entered. In Zambia, the data were entered by cluster number. Select all the batch files in the “Select files to concatenate” dialog box and click on “Add”. The CSConcat dialog box should look similar to the figure below.
e. Scan through the sizes of the files to verify that the sizes of the batch files are relatively similar. You should not see 0 KB or a very small number if the average size is around 30 – 45 KBs. Click on “Run” to create the file with all the data concatenated into one file. A message dialog box appears with the words “Concatenate completed!” if the concatenation was successful. Click on “OK”. f.
Another dialog box opens summarizing the operation.
g. Verify all the files have been selected. You should know the number of batch files that should have been created for the specific province. In this example there are 62 batch files for Central Province and 62 SEAs were selected and interviewed. If the number of files does not match the number of batch files that 4
were to be keyed, you must return to the concatenation procedure to fix the problem. Close the box (click on the red “X” in the upper right hand corner of the dialog box). 3. The concatenated file is now ready to be exported. a. Click on Tools >> Export Data. b. A dialog box opens to ask for the data dictionary. The dictionary that was used for data entry must be selected. NOTE: All data entry personnel should be using the same dictionary. (If a dictionary is modified, it will be unique to that computer. The data will not export properly using any other dictionary.) Navigate to the folder where the dictionary file is stored and select the dictionary. The dialog box will show the dictionary file that is available (extension name = .dcf). Click on “Open”.
c. The “Export data” dialog box opens. Several specific choices must be made. You can also define an export specification and save that specification to use again. In the above screen you can see the name of the specification ‐ “spss.exf”. This definition will export data to SPSS format.
5
In the export dialog box select the following items: 1. Place a tick mark to the left of the dictionary name in the upper left hand corner of the dialog box. 2. On the right hand side of the dialog box go to the item: “Number of Files Created” – click on the radio button next to “Multiple Files (one for each record type”.) 3. “Output of Multiple Record Occurrences” – click on the radio button next to “As Separate Records”. 4. “Export Record Type” – you can choose “No”. If you have a reason you want to see the record type in SPSS, you can select one of the other options. However, you will probably not use it for anything. 5. “Export Items and Subitems” – this is optional depending on what you want. The default is “Items Only”. Most surveys do not have subitems defined. Other surveys may define subitems, e.g., the variable date divided into 3 different variables, day, month, year. You will need to know whether subitems have been defined to select the proper option. 6. “Export Format” – select the 5th option “SPSS (.dat, .sps)” to export to SPSS format. If you will be using another type of software to clean the data, select that option. The option to 6
create Stata format files is the 7th option. 7. Click on the “Save” icon at the top upper left of the dialog box to save the export format to a name. 8. If there are no problems, the “stop light” icon on the tool bar will be “Green”. See the completed screen below for the export to SPSS format selections.
When the specification is complete or if you have opened the already defined specification, click on the “stop light” icon which should show as green. Another dialog box opens to allow you to select the data file to use for the export. This file is the concatenated batch file described in the section called “Export from CSPro procedure”. Navigate to the folder where the data batch file was saved. The file should be in the “arch” subfolder. Select the concatenated batch file “????.bch”. Click on “Open”. Another dialog box opens where you can edit the folder references if you desire. Generally the proposed file names and locations where the files will be created are accepted as is.
7
Modification of the syntax file created by CSPro to import data
Modification 1 – Add comments, add a file handle, and modify the folder reference
If you wish to edit the “Data File Name”, click on the three little dots to the right of the data file name ( ). However, it is not necessary to change anything. The “.dat” files will be saved in the folder where you picked the batch file. Click on the “OK” button. You will see Text Viewer windows opening and closing as each of the syntax or do files for the different record types is generated. The very last syntax (do file) generated will remain open. If you wish, you can scroll down through the text to look it. You are now ready to close this viewer window. Also, close the Export specification dialog box. CSPro can also be closed at this time. SPSS export: Two files are created from the export procedure for SPSS. One file is the syntax file with an extension of “.sps”. The other file is an ASCII data file with the extension “.dat”. The names of these two files will depend on the name given the record type in CSPro. Stata export: Three files are created from the export procedure for Stata. One file is the do file with an extension of “.do”. Another file is an ASCII data file with the extension “.dat”. The third file is the dictionary file that is called by the do file to read in the data. The extension for this file is “.dct”. The names of these three files will depend on the name given the record type in CSPro. If you are responsible for creating the final files to be used to export the data to SPSS or Stata, the following modifications must be made to each of the syntax / do files created by CSPro. SPSS: Start SPSS and open the syntax file for the first record type syntax editor. Stata: Start Stata and open the do file for the first record type in the do‐ file editor. SPSS: The syntax file created by CSPro will begin with a “DATA LIST” command. Stata: The do file created by CSPro will begin with an “infile” command. This command reads in the data from the “.dat” file created from the export procedure using the variable width and decimal information from the dictionary to determine what data will be saved in each of the variables. 8
SPSS: It is very important that you leave the first column blank in each of the subsequent lines within an SPSS command so that the second line through all the lines to the end of the command are indented one space. The “/” is indented one space. “PROV” is indented one space, and so on. Do not delete this space. All the syntaxes that were created with the Export procedure will be run together to create the SPSS files using a command called “INCLUDE”. The “include” command requires that the commands start in the first column and any other lines that wrap for that command are indented one space. DATA LIST FILE='phs\ARCH\SEC0.DAT' RECORDS=1 / CLUSTER 1‐4 PROV 5‐5 DIST 6‐8 CONST 9‐11 …. SPSS and Stata: At the top of both the syntax and do files insert lines and add the comments (modified appropriately) with the correct date, name of author and purpose. Comments are: *Date: (date of the development of the file) *Author: (name of the person who developed the file) *Purpose: (purpose of the file) *in this example the purpose is to import data from CSPro for the phs2010/2011, record type 0. ****************************************************. SPSS: The next modification is the FILE HANDLE. People may not have exactly the same folder structure because computers will have different operating systems. The file handle command facilitates this difference by setting the folder structure to a temporary variable name. The folder structure is set with the FILE HANDLE command. The temporary variable name in the example below is phs . This temporary variable name can be anything you wish to call it; examples are: survey1 or lcms or cfs. It does not matter if the name is upper or lower case. After the subcommand /NAME= add the folder reference within single quotes. You can copy the folder reference from the DATA LIST command. *modify the file handle to match your computer folder setup. FILE HANDLE phs /NAME='C:\Users\Nyambe\Documents\Zambia\PHS\1011\arch'.
****************************************************. Stata: Stata also includes the complete path where the files are located. The “cd” command (change directory) is used to set up the local directory of the person cleaning the data. You can copy the folder reference from the infile command. The command is: 9
cd "folder reference” *change directory to working directory cd “C:\USERS\BEAVERM\DOCUMENTS\ZAMBIA\PHS\1011\ARCH" Stata: You also need to modify the folder reference for the “infix” command to delete the folder reference to only refer to the file. After the file name add “, clear”. Stata requires that there is no file loaded into memory. An example is: infix using "SEC0.dct", clear label variable cluster "Cluster" label variable prov "Province" label variable dist "District" label variable const "Constituency" …… The *.dct files also need to be modified. Open the file called “sec0.dct”. The only thing that needs to be modified is to remove the folder reference because the “cd” command has been placed in the do‐file. infix dictionary using "SEC0.DAT" { 1 lines int cluster 1: 1‐4 byte prov 1: 5‐5 int dist 1: 6‐8 int const 1: 9‐11 ….. Leave this file open; other modifications may need to be made before you save the file.
Modification 2 – Correct variable names and variable/ value labels:
Read through the syntax file or do‐file. Look at the variable names, labels and value labels. If you are the one creating the final syntax/do files to be used to import the data into SPSS/Stata by all the data cleaners, read through the labels and modify to correct them so that they are well specified. The recommendation is that the person who is responsible for exporting the data from CSPro will also modify the syntax / do file with the corrections listed in this document. The modified syntax/do files must be saved to a new name. The suggestion is to add “_final” to the file name, e.g. sec0_final.sav or sec0_final.do . The variable names should be consistent between the record types, i.e., the variable name should be the same if it references the same type of data. For example: the variable “FIELD” may appear in several record types. Each time the data are to be recorded in the “FIELD” variable in the different records, CSPro requires the variable to have a different name. For example: you will see the variable “FIELD” in the first reference to field, which might be the table on questions regarding the field. The second reference to “FIELD” might be in a table asking about fields with only one crop (monocropped). In the syntax that reads in the data for that table, the variable for the field will probably have the name of “FIELDA”. The variable name should be changed to “FIELD” because 10
Example of changes to the “data list” command for SPSS
these data are being saved in a different file from the data asking about field level questions. In another record type the questions may be about fields with more than one crop (mixtures). In CSPro the variable will have to be unique and might be called “FIELDB”. In the syntax to read in the data for the mixture fields, the variable name should be changed back to “FIELD”. There may be a table asking about cassava fields. CSPro may have named that variable “FIELDC”. FIELD is not the only variable that might be repeated. For Zambia, in the monocropped and mixture tables all the variables will have to be modified to remove the “A” from the monocropped variables and the “B” from the mixture variables. SPSS: In the record type for the monocrop: DATA LIST FILE='phs\SEC2B.DAT' RECORDS=1 / PROV 1‐1 DIST 2‐4 CONST 5‐7 WARD 8‐9 … FIELDA 21‐22 CROPA 23‐25 FIELDTYPA 26‐26 ….
FIELDA, CROPA, FIELDTYPA, etc. should all have the “A” removed so the variable names are FIELD, CROP, FIELDTYP, etc. … FIELD 21‐22 CROP 23‐25 FIELDTYP 26‐26 ….
Example of changes to the “infix dictionary” command in Stata in the file with the extension “.dct”
Stata: In the record type for monocrop: infix dictionary using "SEC02B.DAT" { 1 lines int cluster 1: 1‐4 byte prov 1: 5‐5 int dist 1: 6‐8 int const 1: 9‐11 byte ward 1: 12‐13 ….. byte fielda 1: 21‐22 byte cropa 1: 23‐24 byte fieldtypa 1: 25‐25 …. FIELDA, CROPA, FIELDTYPA, etc. should all have the “A” removed so the variable names are FIELD, CROP, FIELDTYP, etc byte field 1: 21‐22 byte crop 1: 23‐24 byte fieldtyp 1: 25‐25 …. 11
Variable label modification
SPSS: There can be up to 3 places in the syntax file where the variable name will need to be changed. First will be in the section of the “DATA LIST” command. The second will be under “VARIABLE LABELS”. The third place may or may not need to be modified. It depends on whether that variable has labels for the values. Check under the command for “VALUE LABELS” to be sure the variable name does not appear there, as it would not if the variable were “FIELD”. However, there are instances where the variable name will have value labels and the variable name would need to be modified in this section too. An example might be a variable called “CROP” where labels have been defined. Stata: There can be up to 4 places where the variable name will need to be changed. First will be in the dictionary file (*.dct) where the variable is defined along with the column specification. The other two will be in the do file (*.do). The second will be under “label variable” command. The third and fourth places may or may not need to be modified. It depends on whether that variable has labels for the values. Check under the command for “label define …” and “label values…” to be sure the variable name does not appear there, as it would not if the variable were “FIELD”. However, there are instances where the variable name will have value labels and the variable name would need to be modified in this section too. An example might be a variable called “CROP” where a label has been defined and the label must then be assigned to the variable. SPSS: VARIABLE LABELS PROV "Province" /DIST "District" /CONST "Constituency" /WARD "Ward" … /FIELDA "Field" /CROPA "Crop" /FIELDTYPA "Monocrop or mixture"
Modified to read: … /FIELD "Field" /CROP "Crop" /FIELDTYP "Monocrop or mixture"
12
Value label modification
Stata: label variable fielda "Field ID" label variable cropa "Crop code" label variable fieldtypa "Type of field" Modified to read: label variable field "Field ID" label variable crop "Crop code" label variable fieldtyp "Type of field" SPSS: VALUE LABELS PROV 1 "Central" 2 "Copperbelt" 3 "Eastern" …. /CROPA 1 "Maize" 2 "Sorghum" 3 "Rice" 4 "Finger Millet" …. Modified to be: VALUE LABELS PROV 1 "Central" 2 "Copperbelt" 3 "Eastern" …. /CROP 1 "Maize" 2 "Sorghum" 3 "Rice" 4 "Finger Millet" Stata: (two places) label define CROPA 1 "Maize" 2 "Sorghum" 3 "Rice" 4 "Millet" Modified to be: label define CROP 13
1 "Maize" 2 "Sorghum" 3 "Rice" 4 "Millet" AND label values cropa CROPA
Modified to be:
Modification 3 – Add dataset name, run frequencies, and save file
label values crop CROP If someone else has created these files as final syntax/do files, you should not modify them unless you are told specifically to do so. Make a comment note if you make any changes/modifications to the file. SPSS: At the end of the file, the last line will be “EXECUTE.” Add the following lines, modifying as appropriate for each of the record types: *dataset name should reflect the record type. DATASET NAME sec0 window=FRONT. *run a frequencies to verify you have the correct dataset and record the number of cases read in by replacing the ????. FREQUENCIES prov. *???? Cases. *save the file to the same name as the record type. You will use the file handle as the folder reference. The file is saved in the same folder as the .dat and .sps files. SAVE OUTFILE='phs\sec0.sav' /COMPRESSED. Stata: Add the following lines: * run a tabulate to verify you have the correct dataset * record the number of cases read in TAB prov. *???? Cases. *save the file to the same name as the record type *add the subcommand replace SAVE 'sec0.sav', replace 14
Modification 4 – Save syntax/do file to a new name
Importing all data from CSPro to SPSS or Stata
Save the syntax (do file) to a new name where you add “_final” to the name, e.g., Click on “File”>> “Save As”. The name proposed will be the original file name “sec0.sps”. The new name should be “sec0_final.sps”. Or if you are working in Stata the name would be “sec0_final.do”. The reason for saving the file to a new name is because every time data are exported from CSPro the syntax/do files are overwritten. If you do not save to a new name, all your modifications will be lost. There will be many files that are created from the CSPro Export program. There is a file for each record type. Once the identifying variables have been corrected and the final export to the *.dat files has been done, we can write a file to run all the syntaxes that import the data to SPSS or Stata at once. SPSS: The command to run more than one syntax within a main syntax file is called “INCLUDE”. The commands used in this syntax file are: FILE HANDLE INCLUDE DATASET CLOSE The “file handle” specifies the folder where the SPSS files are stored that were created by the export process from CSPro. The “include” command tells SPSS to find the syntax file with the specified name and run it. These are the “???_final.sps” files created from instructions in the previous section. The “dataset close” command closes the file that was created so that in the end there is only one data file open. Otherwise all of them would be open, since SPSS allows more than one data file open at a time. *syntax to run several syntax files at once to import data to SPSS format. *CFS survey 2010/2011. FILE HANDLE cfs /name='C:\Users\beaverm\Documents\Zambia\CFS\1011'. INCLUDE FILE='cfs\arch\SEC0_final.sps'. INCLUDE FILE='cfs\arch\SEC1_final.sps'. dataset close sec0. INCLUDE FILE='cfs\arch\SEC2A_FINAL.sps'. dataset close sec1. INCLUDE FILE='cfs\arch\SEC2B_final.sps'. dataset close sec2a. ……. Stata: The command to run another do‐file in Stata is “do”. Before each “do” command, clear the memory. Also you will also want to set “more” off so that the program does not pause when the output screen is full. The file should look similar to: 15
*syntax to run several do files at once * to import data to Stata format *CFS survey 2010/2011 *change to working folder cd “C:\USERS\BEAVERM\DOCUMENTS\ZAMBIA\CFS\1011\ARCH" clear all set more off do ‘sec0_final.do’ clear all do ‘sec01_final.do’ clear all ……. Documentation is important to keep track of the files used to clean data Development of the and files created from the cleaning. A table can be created in Word that cleaning syntaxes / do lists each of the sections of the questionnaire that needs to be cleaned. In this table should be 5 columns: files the name of the section, the names of the syntaxes to clean the section (there can be more than one syntax for a section), a list of the data files that are created in the syntaxes, a comment column summarizing the purpose, and a “problems” column where observations and/or problems with the data can be noted. The standard folder where all syntaxes are saved is called …..\clnsyntax. The naming convention for the syntaxes is to start the file name with the number of the order in which the syntaxes are to be run, the word “clean”, the name of the section to be cleaned and sometimes the initials of the person writing the syntax. An example is: 0_clean_ids_mb (.sps/.do). This syntax checks the ids (cluster, prov, dist, const, ward, region, csa, sea) and was written by “mb”. It is the very first syntax that is to be run, hence the number “0”. If you are working in Stata, the extension name will be “.do” instead of “.sps”. A simple example of the documentation table is: Section Syntax name Files created Comments Problems Front page IDs 0_clean_ids Chk_ids.sav _mb.sps Data not collected Front page IDs, 1_Clean_hhid Allsurid.sav, Creates the file for all in most Household _filter.sps id.sav households that were to be households for Q filter questions hh.sav interviewed, creates 10 – hh05. household file for completed questionnaires, cleans the filter questions Section 1 ‐ 2_clean demog_01.sav Checks consecutive numbers Skips were not Demography demog_es.sps demog_02.sav for members, single variables, followed, missing demog_03.sav skip rules, and relationships data. 40 cases with no data in between variables year of birth. 16
Add comments to the syntax or do file
Comments: At the top of each syntax file comments should include: *survey: which survey the syntax applies to, e.g., PHS 1011. *purpose: *name: of person developing syntax *date: of development and any modifications *file name of syntax. Detailed purpose can be added after the syntax has been developed when you know what has been included. File handle (SPSS) or cd command (Stata): You will be getting and saving files in different folders. The original archived file will be retrieved from the “arch” folder. As the file is cleaned, different versions of the file will be saved in the “clndata” folder. The working folder will be the folder that is the name of the survey. If the survey is a post harvest survey for 2010/2011 in Zambia, the working folder will be ….\Zambia\PHS\1011 SPSS: The file handle is very important and should be next in the cleaning file. *FILE HANDLE. Example: FILE HANDLE phs /name='C:\Users\beaverm\Documents\Zambia\PHS\1011'. A standard file handle should be placed in the syntax and then modified to fit the structure of the folders for the person who will be using the syntax/do file. Stata: The “cd” command will be used to change to the working directory. Example: cd “C:\Users\beaverm\Documents\Zambia\PHS\1011”
Initial processing commands to bring the file from the \arch to the \clndata folder
For each section or record type created by CSPro, the archived original data file will be retrieved from the “arch” folder. The “entrynum” variable is computed / generated. See the examples below to create this variable using SPSS or using Stata. This variable contains a number and it sequentially numbers the cases / observations in the order of entry, e.g., case 1 has a value of 1, case 2 has a value of 2 and so on. This variable is created before anything is done to the data file. The reason this variable is created is to able to identify a case/ observation where the cases are exact, however the questionnaire shows they are not supposed to be duplicate cases or if we need to identify a 17
case and the only way to specifically identify that case is to use the value in the entrynum variable. A frequency/tabulate is run on either district or province and the number of cases recorded in the syntax or do file. Warning: For SPSS, you must keep track of the number of cases the file should have because the “TEMPORARY” command is used with the cleaning. If this command is not selected along with the “SELECT IF” command, cases can be permanently deleted. Always check the number of cases in the file before the “SAVE” command is run. The last steps are to sort the file in the key variable order (variables required to identify a case as being unique) and save the file into the folder called “…..\clndata”. At this point the order that the variables are to be saved in the new data file is specified because the data entry template uses a different variable order than should be used during the verification of the data. The new filename, to which the data file is saved, represents the contents of the data file. If the file is asking questions of the household, it is called “hh.sav (.dta)”. If the file is asking about members of the household, it is called “demog.sav (.dta)”. The file name will be modified to add a number to indicate the latest version of the file, e.g., “hh_01”, “hh_02”, “hh_03”, as the cleaning progresses. New versions of the file are saved as a reasonable number of changes are made. The versions will allow us to go back to an earlier version should an error occur where the changes were not correct or a subset of data were selected and saved over the top of the full dataset. SPSS: An example of the start of the processing of the data file for a section is:
*cleaning demographics, crop forecast survey 2010/2011. *03/04/2011. *Modified by name ‐ Kafue Gorge Mazabuka. **Start …arch\sec1.sav **End …clndata\demog_03.sav *****************checks***********************. *****check that no sysmis in mem cfd01 cfd02 cfd03 . *****check skip rules for cfd04, cfd05 cfd06 *****check that every household has mem=1 and the household size is equal to the maximum in the household. *****check that all households have at least 1 member *****check for duplicate mem *****check for duplicate heads *****check for invalid values in cfd01cfd03 cfd06 *****check age of head, spouse and age difference between oldest child and head *****check age and marital status *****check age and education status *****check for link between cfd06 and field (cfl10), thus if "yes" in cfd06 cfl10 should not be sysmis *set file handle. FILE HANDLE cfs /name='C:\Zambia\CFS\1011'. *get demography file. GET FILE='cfs\arch\sec1.sav'. DATASET NAME demog WINDOW=FRONT. 18
COMPUTE entrynum = $CASENUM. EXECUTE. FREQUENCIES prov. *79709 cases. *sort by key variables that identify a case. SORT CASES by cluster hh mem. *reorder the variables. SAVE OUTFILE='cfs\clndata\demog.sav' /KEEP CLUSTER HH MEM CFD01 to CFD06 entrynum PROV to SEA /COMPRESSED.
Stata: An example of the start of the processing of the data file for a section is:
*cleaning demographics, crop forecast survey 2010/2011 *03/04/2011 *Modified by name ‐ Kafue Gorge Mazabuka **Start …arch\sec1.dta **End …clndata\demog_03.dta *****************checks*********************** /*check that no sysmis in mem cfd01 cfd02 cfd03 check skip rules for cfd04, cfd05 cfd06 check that every household has mem=1 and the household size is equal to the maximum in the household check that all households have at least 1 member check for duplicate mem check for duplicate heads check for invalid values in cfd01cfd03 cfd06 check age of head, spouse and age difference between oldest child and head check age and marital status check age and education status check for link between cfd06 and field (cfl10), thus if "yes" in cfd06 cfl10 should not be missings */ version 11 clear all macro drop _all *change to the working directory cd “C:\Zambia\CFS\1011” *get demography file use “arch\sec1.dta”, clear *create variable to assign a sequential value to each observation gen entrynum = _n *record number of cases tab prov *79709 cases *sort by key variables that identify a case sort cluster hh mem *reorder the variables order hh ‐ entrynum, before(prov) save “clndata\demog.dta”, replace ……. 19
Verification of sample
All of the syntaxes or do files for the different sections are developed and tested with a subset of data before the cleaning begins. Everyone will run the same syntaxes in the order that has been decided. Should you find a check that was not done, write the commands to do the check. Document that check in the documentation file so that when the data are combined from all the provinces, that check can be done. Share the check with the others that are participating in the cleaning so they can run the check. Once the household‐level file has been created by running the syntax “sec0_final.sps” (or the do file “sec0_final.do”), you can now proceed to check the location variables. In this example the sample is at the Standard Enumeration Area (SEA). The file containing the sampled SEAs is at the SEA level. sec0.sav (.dta) is at the household level. A syntax (do) file should be developed to do this check. The process is to open the sec0.sav (.dta) file and first check the response variable and the category variables for missing or incorrectly coded values. After this check where the problems have been fixed in CSPro and the data re‐exported and imported into SPSS (Stata), the file is aggregated (collapsed) to the SEA level, counting the number of households. The sampled SEAs file is merged with this file to check for mismatched cases.
SPSS syntax: *survey – PHS 1011 ‐ Zambia. *purpose – verify the location variables and cluster match the selected SEA sampled. * check for invalid codes in the response status and category. * check for duplicate cases. *author – XXXXXX. *FILE HANDLE . FILE HANDLE phs /name='C:\Users\xxxxx\Documents\Zambia\phs\1011'. *************************************************************** *Step 1. *open the first record type – household‐level file – all households to be interviewed should be in this file. GET FILE='phs\arch\rec0.sav'. DATASET NAME allhh WINDOW=FRONT. *computing the order of data entry using the SSPS variable $casenum. COMPUTE entrynum = $CASENUM . EXECUTE . *number of cases. FREQUENCIES prov. **13487 cases. *sort by the key variables that identify the case as unique. SORT CASES BY CLUSTER(A) HH(A). *the variable names may need to be modified to match the names for the specific survey. 20
*keep the location variables, the category and response status variables as well as entrynum. SAVE OUTFILE='phs\clndata\chk_id.sav' /KEEP CLUSTER PROV DIST CONST WARD REGION CSA SEA HH CATEGORY RSTATUS entrynum /COMPRESSED. GET FILE='phs\clndata\chk_id.sav'. DATASET NAME chk window=front. dataset close allhh. *check for missing data in category and rstatus. FREQUENCIES category rstatus. *there should be no missing data in these variables and all codes should have labels.
*check for duplicate ids – can use the menu under “Data”>> “Identify duplicate cases” to develop this syntax. *mark first case of duplicate. DATASET ACTIVATE chk. * Identify Duplicate Cases. SORT CASES BY CLUSTER(A) PROV(A) DIST(A) CONST(A) WARD(A) REGION(A) CSA(A) SEA(A) HH(A). MATCH FILES /FILE=* /BY CLUSTER PROV DIST CONST WARD REGION CSA SEA HH /FIRST=PrimaryFirst. VARIABLE LABELS PrimaryFirst 'Indicator of each first matching case as Primary'. VALUE LABELS PrimaryFirst 0 'Duplicate Case' 1 'Primary Case'. VARIABLE LEVEL PrimaryFirst (ORDINAL). FREQUENCIES VARIABLES=PrimaryFirst. EXECUTE. *mark the rest of the cases that are duplicate. * Identify Duplicate Cases. SORT CASES BY CLUSTER(A) PROV(A) DIST(A) CONST(A) WARD(A) REGION(A) CSA(A) SEA(A) HH(A). MATCH FILES /FILE=* /BY CLUSTER PROV DIST CONST WARD REGION CSA SEA HH /LAST=PrimaryLast. VARIABLE LABELS PrimaryLast 'Indicator of each last matching case as Primary'. VALUE LABELS PrimaryLast 0 'Duplicate Case' 1 'Primary Case'. VARIABLE LEVEL PrimaryLast (ORDINAL). FREQUENCIES VARIABLES=PrimaryLast. EXECUTE. *list the duplicate cases. TEMPORARY. SELECT IF primaryfirst = 0 or primarylast = 0. LIST all. *need to fix cases in CSPro, re‐export the data and run syntax again. *****************************************************. *if there are no problems, continue with step 2.
*Step 2. The next step is to aggregate to the SEA level counting the number of households. DATASET DECLARE sealevel. AGGREGATE /OUTFILE='sealevel' /BREAK=CLUSTER PROV DIST CONST WARD REGION CSA SEA /HH_nu=NU(HH). 21
dataset activate sealevel. *There should be 20 households for each SEA – in the CFS and PHS surveys. TEMPORARY . SELECT IF hh_nu~=20. list all.
Observation note: The survey design for the example expects there to be 20 households. If the count is not 20 households, the surveys are pulled for that cluster to check for the problems. Any missed households must be keyed into the CSPro application. The data are then re‐exported and brought into SPSS and rechecked to this point. *if the count is 20 households (or whatever was indicated as the appropriate number of households), proceed to the next step. *Step 3. *************************************************************. *you may need to open the file containing the data for the sample to sort the cases in the proper order and determine which variable in this file should not be missing when you match the two files. GET FILE='phs\weights\district_summaries_xxxx.sav'. DATASET NAME summary WINDOW=FRONT. SORT CASES by cluster prov dist const ward region csa sea. *confirm variable name to use to look for problems. In 2011 the name was “listed_2011”. SAVE OUTFILE='phs\weights\district_summaries_xxxx.sav'. **************************************************************. *merge in the sampled SEA file which should be in the subfolder for \weights under the main survey folder. DATASET ACTIVATE sealevel. DATASET CLOSE summary. *both files are at the same level – this is a file‐file match. MATCH FILES /FILE=* /FILE='phs\weights\district_summaries_1011.sav' /BY cluster prov dist const ward region csa sea. EXECUTE. *the district summaries file will contain all provinces. *limit the cases to the province that you are working on. *use a permanent select if. *replace the X with the appropriate province code. select if prov = X. execute. *list the problems where the data do not match. temporary. select if (sysmis(hh_nu) or (sysmis(listed_2011) or listed_2011=0)). list cluster to sea listed_2011 comment. *???? cases.
22
Stata commands: *survey – PHS 1011 ‐ Zambia. *purpose – verify the location variables and cluster match the selected SEA sampled. * check for invalid codes in the response status and category. * check for duplicate cases. *author – XXXXXX. *change directory cd “C:\Users\xxxxx\Documents\Zambia\phs\1011” ***************************************************************. /* you may need to open the file containing the data for the sample to sort the cases in the proper order and determine which variable in this file should not be missing when you match the two files */ use “weights\district_summaries_xxxx.dta”, clear sort cluster prov dist const ward region csa sea *confirm variable name to use when looking for problems. In 2011 the name was “listed_2011”. save “weights\district_summaries_xxxx.dta”, replace ************************************************************** *Step 1 *open the first record type – household‐level file – all households to be interviewed should be in this file use “arch\sec0.sav”, clear *computing the order of data entry gen entrynum = _n tab prov *79709 cases *sort by key variables that identify a case sort cluster prov dist const ward region csa sea hh *keep only the variables that are needed keep cluster prov dist const ward region csa sea hh category rstatus entrynum save “clndata\chk_id.dta”, replace *check for missing data in category and rstatus. tab1 category rstatus, missing *there should be no missing data in these variables and all codes should have labels *if there are missing data or missing labels, fix in CSPro
*check for duplicate ids – can use the menu under “Data”>> “Identify duplicate cases” to develop this syntax. *mark the duplicates duplicates tag cluster prov dist const ward region csa sea hh, generate(dup) tab dup *list the duplicate cases list if dup~=0, clean *need to fix cases in CSPro, re‐export the data and run syntax again. ***************************************************** 23
/*Step 2 The next step is to contract to the SEA level counting the number of households */ contract cluster prov dist const ward region csa sea *There should be 20 households for each SEA – in the CFS and PHS surveys list if _freq~=20 , nolabel
Observation Note: The survey design for this example expects there to be 20 households. If the count is not 20 households, the surveys are pulled for that cluster to check for the problems. Any missed households must be keyed into the CSPro application. The data are then re‐exported and brought into SPSS and rechecked to this point. /*if the count is 20 households (or whatever was indicated as the appropriate number of households), proceed to the next step*/ /*Step 3 merge in the sampled SEA file which should be in the subdirectory for \weights under the main survey directory*/ *both files are at the same level, this is a 1 to 1 merge merge 1:1 cluster prov dist const ward region csa sea using "weights\district_summaries_2011.dta" *the district summaries file will contain all provinces *limit the cases to the province that you are working on *use a keep command *replace the X with the appropriate province code keep if prov ==X *list the problems where the data do not match. list cluster prov dist – sea _freq listed_2011 if _freq==. | listed_2011==. | listed_2011==0, nolabel ***************************************************************.
The listing will show SEAs with no count in the variable hh_nu (in Stata the variable is _freq) or no count in the variable listed_2011 or listed_2011 = 0. Any of the variables (cluster, prov, dist, const, ward, region, csa, sea) could be incorrect. You will need to pull the cluster, check to see what has been recorded on all of the questionnaires and what should have been recorded. There may be a data entry error or there could be an error where the numbers were incorrectly coded on the questionnaires. CHECK ALL QUESTIONNAIRES for that cluster (SEA) and correct ALL of them. It is possible that half of the questionnaires are coded correctly and the rest are not. All questionnaires in a cluster must have the same coding for location variables. The people responsible for pulling questionnaires during cleaning will not know where to return the questionnaire in the boxes if the coding is not correct on the questionnaire. Once all corrections have been completed in CSPro, re‐export the data and check again. If all the problems have been fixed, you can proceed to the next steps of cleaning.
Sequence of checks to be done to verify the data
The next checks should be performed in sequence. Otherwise you may find yourself repeating checks because the data have changed, in that cases were added. The checks would have to be repeated if cases are deleted or added. 24
Verify location variables
Run syntax (do) files in logical order for each section
Check for duplicate observations
Keep track of the number of cases in the data file
Check “filter” questions
The location variables must be verified first. Verify all the households have been entered, including those that did not complete the survey. The number of households for each SEA, in the Zambia example, will be based on the sampling frame that was designed. CFS and PHS expect to interview 20 households for each SEA. There may be some exceptions. Check with the person responsible for the survey sampling frame. Fewer than 20 households should also be documented in the district_summaries_xxxx.sav (.dta) file. The syntax (do) files are developed in a logical order following the order of the questions in the survey instrument. Within the syntax (do) file, each check is a separate activity. The checks should be run, one at a time, where the list is checked and the problems fixed before the next check is run. DO NOT RUN the complete syntax (do file)! You will get garbage and you will not be able to figure out which listings to work on before working on others. Each check will list the problem. If the problem is fixed at that point, then it will not show up later in another listing. If several problems are run and listed at the same time, that household will probably show up in every listing and you’ll have to pull the questionnaire to double check even though it was fixed earlier. Therefore, you should run a single check, fix the problem, run the next check, fix that problem and so on. Check for duplicate cases as a regular routine for each of the data files. Remove any blank cases where the key variables have been entered but there are no data in any of the variables. Verify first that the blank cases should be removed. Always run a frequencies (tab) of the “prov” variable at the beginning of the syntax (do) file and before you execute a “SAVE ” command to verify you have not lost cases that should be there. Record the number of cases based on the frequency to track how many cases you are working with. If you have lost cases, do not save the file. You will have to start at the beginning of the syntax (do file) and rerun the commands, verifying you have the correct number of cases after each check. The survey instrument may have “filter” questions where the household is asked if it did or had a particular activity. Based on the response (yes=1/no=2), there should be data in the following table in the questionnaire if the response is yes. Or there should be no data if the response is no. All the filter questions should be cleaned first, i.e., there are values of only 1 or 2 in the variable. There should be no sysmis values unless the question has been skipped because of a response to a previous question. Before you begin cleaning on any table that has a filter question associated with it, checks should be done to verify there are data in the table if the response is yes. The reverse is also true: if there are cases in the table and the filter question has a value of 2, either the filter question should have a value of 1 or the cases in the table should not be there. In general it is suggested that each section be run separately. In some instances more than one file must be checked in the same syntax to be 25
Process the variables sequentially
Procedure to use to check the listings produced from queries
sure that all the data have been entered. For example: In the CFS and PHS surveys in Zambia, there is a table to record all the fields used by the household. This table identifies the cropped fields. The crop information may be in 3 separate sections (files). To verify all crops have been entered and/or no fields have been skipped a syntax is needed to check all of the files to find out if any cases are missing and to add the missing cases before the detail checks within each file can be done. Process the variables sequentially as they are recorded in the data file. a. If the variable is a categorical variable, run a frequencies (SPSS) or tab1 (Stata) command. i. Look at the counts to see if those are reasonable for the sample – do you have a complete set of data? ii. All values should have labels if the variable is categorical. Check for out of range values. b. If the variable is a continuous variable, run a descriptives (SPSS) command or a summarize (Stata) command. Add detailed statistics such as min, max and median. i. Look at minimum and maximum values to decide if those are reasonable. ii. Are the mean and median reasonable? c. Look at the extremes (Explore – in the SPSS menus. Summarize varname, detail in Stata) and check them against the questionnaire even if the value is possible and may seem reasonable. If it is an extreme, other variables may be incorrect as well. These commands show only the 5 smallest/largest values in SPSS or the 4 smallest/largest values in Stata. You may want to sort the data and look for gaps between the smallest and largest and list those cases to verify if the values are good. As each check is done, a list of problems will be produced. 1. The questionnaires should be pulled to identify the problems. 2. When you are checking for one type of problem for the household, verify that the data for the other variables for that case have been entered correctly. 3. Look at the values in all the variables and all the cases in the table for that household. Occasionally the data entry person will get off by one variable and key in the values from the previous variable or the subsequent variable. If that is the case, all the data that have been entered will not be correct for that case. If you can identify such a problem and fix all the variables, that household will not show up on subsequent listings. You will not have to pull it again to fix the next problem that could have been fixed with the first check. 4. If you are looking at a table where multiple cases could have been entered, check what was recorded on the questionnaire against the data that have been entered in the table to verify all cases were entered. Occasionally data entry people will skip over a case or two so that not all the data were entered. Sometimes, it has happened that the complete table was skipped and no data was entered for that household for that table. 26
Establish a procedure to document data that were not collected
If data were not collected, you could use the code ‐9 and add a value label to indicate that ‐9 = ‘not collected”. Example: SPSS: *data not collected. If cluster = 2035 & hh = 2 & sysmis(hh01) hh01 = ‐9. EXECUTE.
Stata:
*data not collected replace hh01 = .a if cluster ==2035 & hh==2 & hh01 == . SPSS: Once you have assigned a value of ‐9, then you must include code in the syntax to declare that value as “user missing” and also add a label so that the analyst will understand what that value means. MISSING VALUES hh01 (‐9). ADD VALUE LABELS hh01 ‐9 ‘not collected’.
Verify skip rules Compare variables within a file to check for logical issues Standardize data to kgs where a unit is asked
Stata: Add the label to the label name. If the label name for hh01 is yesno the command to add an additional label is Label define yesno .a “not collected”, modify .a as a value is defined as “user missing” in Stata. Review the skips within the table and run the checks to look for invalid or missing values in variables based on the skip rules. Compare the data between two or more variables within the same case to check for logical issues. For example, can the head of the household be less than 17 years old. Compare age with marital status. Is the person too young to have been married? Where there are questions asking about a “unit”, the data must standardized to a specific unit. In the field table the area of the field (or plot) is asked. The response is collected using the unit specified by the respondent. Units for area can be lima, acre, hectare and square meters. To standardize the area, a lookup table is used to merge in the conversion value to convert all areas to hectares. Both files must be sorted in the order of the matching variables. Generally the file that has multiple cases for the unit is the “active” file or the file that is in memory and the file that contains the values for conversion is called the “lookup” file. In SPSS it is referred to as the “non‐active file is keyed”. In Stata it will be the file on disk that is not open. SPSS: The command “Merge Files” from the “Data” menu can be used to develop the command which is called “MATCH FILES”. Both files must be sorted by the variable(s) that will be specified to match by. An example of a merge of the two files where one is a lookup file (ha_conver.sav) is: SORT CASES by PHF03. MATCH FILES /FILE=* 27
Check for consistencies within a set of cases for a household
/TABLE=’filehandle\lookup\ha_conver.sav’ /RENAME F03=PHF03 /BY PHF03. EXECUTE. A lookup merge is called a “file – table” merge where the file name after the subcommand /TABLE is the lookup file. A new variable is added to the active file which contains the conversion value to standardize to hectares, e.g., a value of .25 is the conversion for a lima, 0.405 is the conversion for an acre, .0001 is the conversion for a square meter. The conversion value is multiplied by the quantity (or area planted) to compute the total hectares planted. Stata: The command “Combine datasets” from the “Data” menu can be used to develop the command which is called “JOINBY”. Both files must be sorted by the variable(s) to match by. Stata does not provide an option to rename the variable on disk if the variable names are not the same. Therefore, the variable in the active file must be renamed first to match the name of the variable in the file on disk before the join can occur. An example of a merge of the two files where one is a lookup file (ha_conver.sav) is: sort PHF03 rename PHF03 F03 joinby F03 using "ha_conver.dta", unmatched(master) _merge(_merge) Within a data file consistencies between cases or observations must be checked. Some examples are: 1 A household must have a head. 2 If there is a spouse, it is expected the spouse will be a different gender. 3 The child of the head is not expected to be older than the head. 4 The parent of the head cannot be younger than the head.
Variables are created to mark the cases. These variables are aggregated (collapsed) to the household level where comparisons can be made. Mark the case where the head is male or the head is female, e.g. SPSS: if reltohead=1 & gender = 1 headmale = 1. STATA: gen headmale = 1 if reltohead==1 & gender==1. Once the variable are created, then aggregate (SPSS) or collapse (STATA) to the household level to begin the checks.
Sort the file in various ways to look for odd data
Sort the file in various ways (by individual variables or groups of variables) to see if you can identify data errors that were not found through syntax. If you are working with a group of people who are verifying the data and you find some discrepancies in your set of data, write the code to pull the problem and distribute the code to the other people who are working on the data so they can check their data.
28
Cross file checks
Further checks should be done to look at the variables that are related between different files. For example: In Zambia, quantity harvested is in the crop file. Quantity sold and retained is in a different file called stocks. Quantity harvested cannot be less than quantity sold plus quantity retained for seed or consumption. These are called cross‐file checks. Data are aggregated or collapsed to the same level, e.g., household‐crop level, and then merged together into one file to be able to make comparisons. SPSS:
SPSS: TEMPORARY command
DATASET DECLARE hh_crop. AGGREGATE /OUTFILE='hh_crop' /BREAK=cluster hh crop /kgharv ‘Total kgs harvested’ = SUM(kgharv). DATASET ACTIVATE hh_crop. *stocks file is already at hh‐crop level. MATCH FILES /FILE=* /FILE=’filehandle\stocks.sav’ /by cluster hh crop. *compare kgs harvested with kgs of sales and stocks to look for discrepancies. Stata: *file with harvest data collapse (sum) kgharv, by(cluster hh crop) label variable kgharv “‘Total kgs harvested” *stocks file is already at hh‐crop level. merge 1:1 cluster hh crop using “stocks.dta” Many of the listings that will pull the problems will be done using the “TEMPORARY” and “SELECT IF” commands. The “SELECT IF” command by itself will keep only the cases that match the criteria specified with the “SELECT IF”. It would require much effort to set a filter for each of problems. Instead the “TEMPORARY.” command is used. The TEMPORARY command allows the program to temporarily select the cases that match the criteria and works only for the next active command. Once that active command has been run the full dataset is available again. An example of the use of the TEMPORARY command is:
29
*list cases where the household did more than 5 weedings. TEMPORARY. SELECT IF (f07)>5. LIST dist to hhn field f01 to f07. *9 cases. The listing is: DIST CONST WARD REGION CSA SEA HHN FIELD F01 F02 F03 F04 F05 F06 F07 103 6 2 1 1 1 17 1 1 2 1 5 2 2 6 302 40 6 1 1 1 23 3 8 1 6 5 1 4 6 501 74 2 1 1 2 18 1 1 1 1 5 2 3 8 501 74 5 1 2 3 1 2 12 1 1 5 2 3 7 501 74 5 1 2 3 1 3 6 1 1 5 2 2 7 501 74 5 1 2 3 20 3 1 1 4 5 2 3 6 501 74 5 1 2 3 40 1 1 1 1 5 1 1 8 502 72 12 1 4 4 14 1 1 1 1 6 1 3 7 811 133 4 1 4 2 72 1 8 1 4 2 2 2 6 Number of cases read: 9 Number of cases listed: 9
Stata: list if command…
The Stata command to do the same listing is: list DIST – F07 if F07 > 5, clean nolabel The questionnaires should be pulled and checked. If those are the values recorded and you’ve looked for comments from the enumerator and checked other data, then you would add to a note below the commands regarding how many cases were verified. If all were verified as being correct, the note can be: *9 cases listed all verified. If some of the cases required corrections, then the comment would be: *9 cases listed, 7 verified. Immediately below the comment, the code to correct the 2 cases that needed correction would appear. The TEMPORARY command does not work with passive commands. You may want to assign a value to a new variable that you are creating based on specific criteria. A TEMPORARY command will not work. The value will be put in all cases. An example that DOES NOT WORK, is: TEMPORARY. SELECT IF gender = 1. COMPUTE newvar = 5. FREQUENCIES newvar. The frequencies command will show that all cases received a value of 5. To correctly assign a value of 5 to the new variable based on the criteria of gender = 1, the proper command is: IF gender = 1 newvar = 5. EXECUTE. In the above syntax, only those cases where gender has a value of 1 will receive a value. The other cases will have a value of sysmis. 30
Forgetting to block the “TEMPORARY” command
Decision rules for when to change a value and when NOT to change a value Data entry errors
Enumerator errors
What happens if you forget to block the TEMPORARY command and just run the SELECT IF and LIST commands? In the dataset there are 17,224 cases. If you run a frequencies on prov, you will know how many cases are in the data file. Using the same commands as above, i.e.,: TEMPORARY. SELECT IF (f07)>5. LIST dist to hhn field f01 to f07. *9 cases. There were 9 cases selected for this list. If only the last two commands were blocked and run, (SELECT IF and LIST), you will discover when a frequencies is run on prov, that there are only 9 cases left in our total dataset. Instead of temporarily selecting a subset of cases to list, all cases were permanently removed except the 9 we wanted to list. SELECT IF (f07)>5. LIST dist to hhn field f01 to f07. *9 cases listed. FREQUENCIES PROV. *9 cases total. To recover from such an experience, DO NOT SAVE THE FILE WITH ONLY NINE CASES. The process is to retrieve the last version of the data file, run all the commands that were developed since that last file was saved that changed data up to the point of the mistake, and then continue on. As a person who is to verify data that have been entered into the data files, you must decide what is appropriate to change and what is not appropriate to change. Consult with your colleagues if you are not sure how you should handle the problem. If the person doing the data entry has entered different values from what is in the questionnaire, the value should be changed to what was recorded in the survey instrument. For example: the value may be 40,000 and the DEO (data entry operator) keyed in 4,000 – a zero was left out. Another example is where a variable is skipped and the next variable’s value is keyed into the current variable so that all the data are shifted. The values should be: 2005 5 4 3 2 1 The values entered are: 2005 5 3 2 1 . Sometimes the code written is not the correct code. In some tables the enumerator is to write the name of crop and then the code. One of the checks will be to compare various tables with crop codes, e.g., compare the crops harvested with the crops sold. In the harvest table the code 31
Problems that cannot be changed
Data correction methods
IF statement
might be 12 for mixed beans. In the sales table the enumerator has written mixed beans and has coded 13 – Bambara nuts. This is an enumerator error. Another example: The area recorded in the sketch of the PHS or CFS survey is 2 limas. In the crop table the enumerator may have decided to convert that value to hectares and records 0.5 in the “area” variable. However, in the unit variable the enumerator records 1= lima instead of 3=hectares. Because of the incorrect unit code, the data now say that the field size was .5 lima. Most likely the yield will be very high for the size of the field. The case will be listed as an extreme for yield. The correction would be to change the area (.5) back to 2. Conversions to hectare should not be done; what has been recorded on the sketch of the fields is what should be recorded in the tables asking about the area of the field. There are instances where variable values are compared within the same file or between files where the values do not make sense together. If there is no data entry error, and there are no notes to help you determine where an error is, you must leave the data AS IS. For example: a question may be asked about how many complete weedings were done in the field. The number recorded is 15 on the questionnaire. There are no notes to explain the number. The case will be listed as a high value. The number must remain because there is no justification for changing it. It may be unreasonable, but if that is what was recorded, as a person verifying the data, you cannot change it. Extreme values must be handled by the person who is analyzing the data. That person can document then how the extreme values were handled. If you change the value because you think you know what is “reasonable” you are biasing the data. Another example might be the quantity fertilizer applied to the field. The value may be quite high but there are no notes or other references to help decide what to do. The problem may be in the size of the field and not the quantity applied. If the values in the questionnaire for the area of the field and the quantity used for fertilizer are the same as what has been entered into the data file, the data cannot be changed. It can only be noted that the data were verified. All corrections to the data must be done using syntax. If changes are not made using syntax, then if a problem appears later and data are lost or incorrectly fixed, the syntaxes have to be corrected and rerun. If there is no syntax for the corrections, the questionnaires will have to be pulled again and checked. The standard command syntax is to identify the specific case using the key variables, repeating the value that is in the variable to be changed and changing it to the new value. SPSS: To make corrections to a specific variable the “IF” statement is used. In the syntax window, the word “IF” must be “blue”. If it is not “blue”, the command has not been written correctly. 32
Examples are: *member‐level file where gender should be female, it has been recorded as male. If cluster = 3015 & hh = 35 & mem = 4 & da02 = 1 da02 = 2. *field‐level file where the area is not correct. If cluster = 4022 & hh = 345 & field = 3 & phf02 = 5 phf02 =0.5. *mixture field where unit of measure for the area was not correct – recorded as lima and should have been hectares. If cluster = 4022 & hh = 345 & field = 3 & crop = 12 & CM04 = 1 CM04 = 3. The variables that identify the case are underlined above. The variable that is to be changed and the initial value are in bold. Stata: The Stata command is similar: replace da02 =2 if cluster == 3015 & hh == 35 & mem == 4 & da02 == 1 replace phf02 =.5 if cluster == 4022 & hh == 345 & field= = 3 & phf02 == 5 replace CM04 = 3 if cluster == 4022 & hh == 345 & field == 3 & /// crop == 12 &CM04 = 1
SPSS: DO IF statement
If there is a value in a variable and it should be sysmis, the only way to remove that value is to use the “DO IF” command. This command is dangerous in that if you do not specify the case to be changed correctly, the command will change ALL cases An example of a correctly specified “DO IF” command is: DO IF cluster = 5073 & hh = 5 & field = 1 & crop = 1 & CM16 = 0 & CM17 = 3. RECODE CM17 (3=sysmis). END IF. EXECUTE. The example below has an error. Let’s say that CM17 has 3 values, 1, 2 and 3 plus sysmis. This variable can have sysmis because it will not be filled if the variable CM16 = 0. There is one household listed that has 0 in CM16 and a value in CM17. There should not be a value in CM17. The existing value must be changed to sysmis. In the syntax below, the “and (&)” was omitted from the “DO IF” command between hh=5 and field=1 (underlined in syntax). SPSS will see there is an error. It will ignore the “DO IF” which ends with a full stop. It will read the next command, which is “RECODE”. It will RECODE ALL VALUES that have a 3 in CM17 to sysmis. DO IF cluster = 5073 & hh = 5 field = 1 & crop = 1 & CM16 = 0 & CM17 = 3. RECODE CM17 (3=sysmis). END IF. EXECUTE. 33
If originally there were 405 cases with sysmis, there are now 1400 cases with sysmis. If you need to use a “DO IF” command, it is recommended that you check the number of cases to be sure you have not lost any, save the data file and then run the group of commands required for the “DO IF”. Check the output file to see if there is an error and then check the data. If there is an error message in output file, do not save the data file! Instead, you can re‐open the data file. When it prompts you to save the active file, DO NOT SAVE IT. The data will be back to its state before the mistake was made. You can correct the mistake in the syntax and run the group of commands again. Stata: The Stata command is:
Deleting cases
replace CM17 = . if cluster == 5073 & hh == 5 & field == 1 & crop == 1 & CM16 == 0 & CM17 == 3 Occasionally cases must be deleted from the data file, either because blank cases were inserted or the record type was required even though households may not have that type of data or duplicate cases were entered.
SPSS: To delete a case create a variable that is filled with the value of 0. COMPUTE DELCASE = 0. EXECUTE. Use the IF statement to specify which cases should be deleted by replacing the value of 0 with 1. An example is: COMPUTE delcase = 0. IF CLUSTER = 3059 & hh= 49 & sysmis(mem) delcase = 1. FREQUENCIES DELCASE. *? Cases (indicate number of cases). Where the criteria are met, a value of 1 is placed in the variable DELCASE. Next, run a frequencies to verify you have only marked the number of cases you want to mark. If the frequencies is correct, then you can use a permanent SELECT IF to delete the cases, e.g., you want to select only those cases with a value of 0 in DELCASE: *keeping only cases with a value of 0. SELECT IF DELCASE = 0. FREQUENCIES DELCASE. *???? Cases. The “DELCASE” variable can be deleted after the selection is completed. DELETE VARIABLES delcase. Stata: The Stata commands are similar. Create a variable “delcase” filled with the value of 0. Replace that value with a value of 1 for observations that meet the criteria specified. Check the variable to be sure the proper number of cases were marked. Then use the “keep” command where “delcase” is equal to 0 to remove the unwanted observations. 34
generate byte delcase = 0 replace delcase = 1 if cluster == 3059 & hh == 49 & mem == . tabulate delcase *??? cases keep if delcase == 0 tabulate delcase *???? cases remaining *remove the variable drop delcase Verify you have the number of cases remaining that you expect to have. If there are 4000 cases and you want to delete 2 cases, the frequencies should show that you have 3998 cases remaining.
Developing the correction syntaxes using Excel
Many of the listings will be long and will require a lot of typing. A method has been developed to create the syntaxes using Excel The listing is copied into Excel. Within Excel columns are inserted to contain the words needed. The words are typed into the first row and then copied down the rows. The values for the variables will already be there so we do not have to type the value to identify the case. Only the new value will have to be typed in. A listing may look like:
DIST CONST WARD REGION CSA SEA HHN FIELD F01 F02 F03 F04 F05 F06 F07 F08 F09 101 101 101 101 101 101 102 102 103 103 103 103 103
1 1 1 1 3 3 4 4 6 6 6 6 6
1 1 1 3 9 9 25 25 3 3 3 4 7
1 1 1 1 1 1 2 2 1 1 1 1 1
14 14 14 2 4 4 2 2 2 2 2 12 4
1 1 1 2 1 1 1 1 3 3 3 2 3
50 50 50 30 9 9 2 147 33 45 45 9 73
2 3 4 1 1 2 2 1 2 1 2 1 2
6 14 4 1 1 1 1 1 6 1 1 1 17
1 1 1 1 1 1 1 1 2 1 1 1 1
1 1 1 2 2 2 1 1 2 2 2 1 1
2 2 2 2 2 2 1 4 4 2 4 2 3
2 1 1 4 4 4 2 3 4 4 4 2 .
1 1 1 4 2 2 2 1 2 2 1 2 .
2 2 2 2 2 2 2 2 2 2 2 2 2
2 2 2 2 2 2 2 2 2 2 2 2 2
0 0 0 0 0 0 0 0 0 0 0 0 0
2 2 2 2 2 2 2 1 2 2 2 1 2
1 1 1 5 1 1 50 1 1 1 1 1 1
1 1 21 1 1 1 2 1 1 1 1 1 1
The example above is from the Zambia PHS 05/06 questionnaire for the farmland file. F03 asks about the main tillage method. F04 asks for the main type and source of power for the tillage method specified in F03. F03 = 1 is “hand hoeing”. F04 = 2 is “hired/borrowed animals”. If F03 = 1, then F04 should be either 5 (family labour) or 6 (hired labour). The questionnaires must be pulled to check what was recorded. If the data are like that, you leave it as is but document no change could be made. To develop the syntax to make the changes, the listing is copied from the output window (in SPSS, select the listing, , and choose “copy”; in Stata, block the listing from the results window, , copy text). Open Excel. The instructions are for Excel 2010. Paste the text into the first cell of the spreadsheet. Next, click on the “Data” tab. Choose the icon “Text to Columns”.
35
2 2 2 2 2 2 2 2 1 2 2 1 2
F10 F11 F12 F13
A dialog box opens where you can draw lines to indicate the column separations. Earlier versions of Excel follow a similar procedure.
Fixed width should have been selected. Click on “Next”. Excel will propose where the break lines should be. Generally they are all ok so that you don’t have to do anything other than to click on Finish. You can scroll down and across to look at the data to verify the breaks are appropriate. Instructions appear in the dialog box at the top if you need to delete a line or move a line or create a new line. Click on “Finish”. The data will be split into columns.
The two variables that might need correction are F03 and F04. The columns after these variables can be deleted. For SPSS: insert a column to the left of DIST. Insert columns between each of the existing columns. The needed words will be added to these new columns. Insert the word(s) in the first row. Copy the words, go to the second row and paste the words, then place the mouse in the lower right corner of the cell where a small square appears. You will see a plus. Double click. The word(s) will be copied down to all the rows that are in the spreadsheet where there are data. 36
For Stata: delete the column with the observation numbers. To be able to use the method described above to copy the words, you must insert only one column at a time to the left of the first column with the data. You will need 4 columns total, but just insert one column to start with to copy the word “replace” into all the rows. Insert a second column after the column with “replace”. In this column type the words “if dist==” and copy it down. Then insert 2 more columns after the column with the word “replace” and before the column with the words “if dist==”. These two columns will contain the variable name that needs to be updated in the first of these two columns and the new value in the second of these two columns. Below are examples of how the spreadsheet would look if you are using SPSS and how it would look if you are using Stata:
SPSS:
Stata:
The key variables are dist, const, ward, region, csa, sea, hhn and field. SPSS: If the problem is with the value in F03, the correction is “& f03=2 f03 = 1”. If the problem is in F04, the variable words will be f04 instead of f03. If there is a problem with both variables, then a row must be inserted and the data from the previous row copied to the blank row. Then both problems can be corrected without the need to type in the data for the key variables. Once the code has been built, then columns and rows with the corrections are copied from the spreadsheet and pasted into the syntax file. The syntax file will look like:
if dist=101 & const=1 & ward=1 & region=1 & csa = 14 & sea = 1& hhn = 50 & field= 2& f04=2 f04 =5. if dist=101 & const=1 & ward=1 & region=1 & csa = 14 & sea = 1& hhn = 50 & field= 3& f04=2 f04 =5. if dist=101 & const=1 & ward=1 & region=1 & csa = 14 & sea = 1& hhn = 50 & field= 4& f04=2 f04 =5. if dist=101 & const=1 & ward=3 & region=1 & csa = 2 & sea = 2 & hhn = 30 & field= 1 & F03=2 f03=1. if dist=101 & const=3 & ward=9 & region=1 & csa = 4 & sea = 1 & hhn = 9 & field= 1 & F03=2 f03=5. if dist=101 & const=3 & ward=9 & region=1 & csa = 4 & sea = 1 & hhn = 9 & field= 2 & f04=2 f04 =1. if dist=102 & const=4 & ward=25 & region=2 & csa = 2 & sea = 1 & hhn = 2 & field= 2 & f04=1 f04 =1. EXECUTE.
*???? cases verified – (if data could not be adjusted)
37
Stata: The command for Stata is formed differently where the change is indicated first. replace F04 = 5 if dist == 101 & CONST== 1 & WARD == 1 & REGION == 1 & CSA == 14 & SEA== 1 & HHN== 50 & FIELD== 2 & F04== 2 replace FO4 = 5 if dist == 101 & CONST== 1 & WARD == 1 & REGION == 1 & CSA == 14 & SEA== 1 & HHN== 50 & FIELD== 3 & F04== 2 replace FO4 = 5 if dist == 101 & CONST== 1 & WARD == 1 & REGION == 1 & CSA == 14 & SEA== 1 & HHN== 50 & FIELD== 4 & F04== 2 replace F03 = 1 if dist == 101 & CONST== 1 & WARD == 3 & REGION == 1 & CSA == 2 & SEA== 2 & HHN== 30 & FIELD== 1 & F03== 2 replace F03 = 5 if dist == 101 & CONST== 3 & WARD == 9 & REGION == 1 & CSA == 4 & SEA== 1 & HHN== 9 & FIELD== 1 & F03== 2 replace F04 = 1 if dist == 101 & CONST== 3 & WARD == 9 & REGION == 1 & CSA == 4 & SEA== 1 & HHN== 9 & FIELD== 2 & F04== 2 replace F04 = 5 if dist == 102 & CONST== 4 & WARD == 25 & REGION == 2 & CSA == 2 & SEA== 1 & HHN== 2 & FIELD== 2 & F04== 1 *???? Cases verified – (if data could not be adjusted)
Final Processing Steps
If the data are being cleaned by more than one person, then the final step is to merge all the similar files together so that there is only one file for each of the record types. The comments that are made in the Word document as the cleaning progresses should be compiled into one document. Once the files are added together, the syntax should be re‐run to check that new errors have not been introduced and errors that should have been examined, have really been examined, i.e., no command was accidentally skipped. The initial data verification where individual variables are looked at as well as examined with relation to other variables is called the ”first verification run”. The second verification is done after all the files from the different provinces are merged together. The data verification will continue into the actual analysis. Some problems cannot be identified until analysis has begun. Comparing results from previous datasets may also indicate possible problems, if the values seem unreasonable. If the data will have a “weight” variable, the weight variable should be developed. With the Zambia dataset there is a variable that categorizes the households into 3 different categories and is used in the development of the weight. This variable is verified at this point in the cleaning using the data collected during the listing of the households and classification into the category at that point. If this variable has not been verified, the incorrect weight may be assigned to the household. Once the weight variable has been computed, it can be added to the final version of each of the data files. The final datasets are to be saved into the “data” folder. Analysts will use the data from this folder. If any new data files are created from the analysis and the analyst wants to retain those files, they can be saved in the “anal” folder. The original “arch” files, cleaning files and syntaxes do not need to be distributed to analysts. All files must be archived onto the archive server where all surveys are saved and documented. The “docs” folder should contain the original questionnaires that were used in the field along with the enumerator manuals. If any modifications to the questionnaire were implemented in the field, those should be documented in a data documentation file. All surveys should have a data documentation file where the details regarding the survey are outlined. The sampling frame should be stated. 38
A table of the data files names, the number of cases and the key variables that identify a case and any special instructions about the data should be documented. Problem data should be discussed in the documentation file. As publications are produced from the survey, those also should be included in the data documentation file for reference.
39


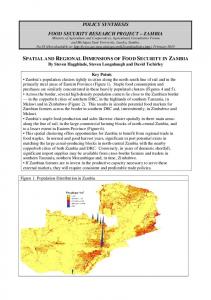


![MSU Music - MSU College of Music - Michigan State University [PDF]](https://m.moam.info/img/260x300/msu-music-msu-college-of-music-michigan-state-univ_6479ce6f098a9ee0288b45a5.jpg)

![2017 MSU Viewbook - MSU Admissions - Michigan State University [PDF]](https://m.moam.info/img/260x300/2017-msu-viewbook-msu-admissions-michigan-state-un_647e21ab098a9e76578b45ae.jpg)