SSD Bufferpool Extensions for Database Systems ∗
Mustafa Canim George A. Mihaila Bishwaranjan Bhattacharjee IBM T. J. Watson IBM T. J. Watson The University of Texas at Dallas Research Center Research Center
[email protected] [email protected] [email protected] Kenneth A. Ross Christian A. Lang IBM T. J. Watson and IBM T. J. Watson Columbia University Research Center
[email protected],
[email protected] [email protected] ABSTRACT High-end solid state disks (SSDs) provide much faster access to data compared to conventional hard disk drives. We present a technique for using solid-state storage as a caching layer between RAM and hard disks in database management systems. By caching data that is accessed frequently, disk I/O is reduced. For random I/O, the potential performance gains are particularly significant. Our system continuously monitors the disk access patterns to identify hot regions of the disk. Temperature statistics are maintained at the granularity of an extent, i.e., 32 pages, and are kept current through an aging mechanism. Unlike prior caching methods, once the SSD is populated with pages from warm regions cold pages are not admitted into the cache, leading to low levels of cache pollution. Simulations based on DB2 I/O traces, and a prototype implementation within DB2 both show substantial performance improvements.
1.
INTRODUCTION
Recent advances in solid state technology have led to the introduction of solid state drives (SSDs). Today’s SSDs store data persistently using NAND flash memory. While SSDs are more expensive than hard disks when measured in dollars per gigabyte, they are significantly cheaper when measured in dollars per random I/O per second. For workloads with significant random I/O, SSDs should be targeted to the portion of the workload that can benefit the most from random I/O savings. Using SSDs to store an entire enterprise-scale database is not currently cost-effective. Previous work has demonstrated how one might place cer∗The majority of this work was completed while the author was an intern at IBM T. J. Watson Research Center, Hawthorne, NY. Permission to make digital or hard copies of all or part of this work for personal or classroom use is granted without fee provided that copies are not made or distributed for profit or commercial advantage and that copies bear this notice and the full citation on the first page. To copy otherwise, to republish, to post on servers or to redistribute to lists, requires prior specific permission and/or a fee. Articles from this volume were presented at The 36th International Conference on Very Large Data Bases, September 13-17, 2010, Singapore. Proceedings of the VLDB Endowment, Vol. 3, No. 2 Copyright 2010 VLDB Endowment 2150-8097/10/09... $ 10.00.
tain tables and/or indexes selectively on an SSD to take maximal advantage of the SSD’s performance characteristics [2, 9]. A workload is profiled to determine which tables and indexes generate the most physical random I/O, and tables are placed on the SSD in order of decreasing I/O per page. There are two drawbacks to such an approach. First, a user must explicitly run a profiling tool to gather statistics, and then perform potentially expensive physical reorganizations as data is moved to/from the SSD. Second, decisions are made at the granularity of an entire table or index. In some cases, only part of the data in a table (e.g., the most recent data) may be frequently accessed, and one might hope to put just fragments of the table on the SSD. In this work, we take a different approach. Rather than treating disk and SSD storage as alternative storage options at the same level of the storage hierarchy, we treat the SSD and disk hierarchically. All data is initially stored on the disk. Over time, high-value data is identified and stored in the SSD. This high-value data is kept current on both the SSD and the disk. Other low-value data is current only on the disk, and not resident on the SSD. Thus the SSD behaves like a write-through cache. As with traditional caches, one needs to define suitable admission and replacement policies to optimize performance.
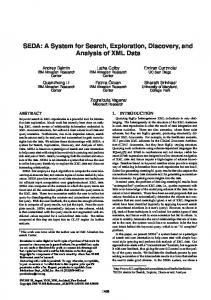
1.1 Region Based Temperature At first glance, it is not even clear that there are significant gains available. Database systems typically employ memory resident bufferpools that can hold a few gigabytes of data. If the application’s working set fits within this memory budget, then there will be relatively little physical I/O and the benefits of an SSD cache would be minimal. There is a complementary risk that even if the application’s working set exceeds the bufferpool size, the physical I/O may be spread thinly over a very broad range of pages, meaning that there would be little locality for a cache to utilize. To demonstrate that significant opportunities for performance improvement using an SSD bufferpool are available we have profiled DB2 for Linux, Unix and Windows (DB2 LUW) [5] running a TPC-C workload [26], and have recorded the traces of physical I/O requests. A typical trace is shown in Figure 1. These traces reveal that there remains substantial locality of reference in the physical I/O stream. Notice
1435
CPU / Cache 6.Write Record
1.Read Record
Main Memory Bufferpool
Disk Page Location
2.Read Page
Temperature-based Replacement
5.Displace Dirty Pages
4.Write Page SSD Bufferpool
6.Update Copy of Page
3.Read Page Not on SSD
HDD (With Logical Regions)
Time
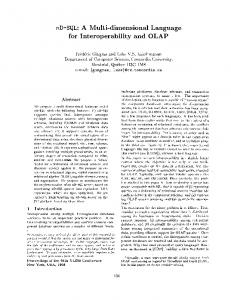
Figure 2: System overview
Figure 1: Disk page accesses over time for a TPCC workload with a 368MB bufferpool and a 15GB database
the horizontal bands where data from nearby locations on the disk are accessed with increased frequency, as well as horizontal bands with low access frequency. The locality we have identified has an interesting character. If accesses are grouped into contiguous fixed-size regions of physical memory, there are “warm” and “cold” regions. Warm regions correspond to tables (or contiguous parts of tables) that are accessed moderately often, but not often enough to be cached in RAM. Cold regions correspond to tables that are either infrequently accessed, or to tables that are so big that the per-region access frequency is low. Our temperature calculations distinguish between sequential and random I/O, and give higher weight to random I/O. This choice enables the SSD to be efficiently utilized, primarily improving the poor random I/O performance of hard disks, but also helping with sequential I/O when there is minimal random I/O. (Note that the TPC-C workload above exhibits random rather than sequential I/O patterns.)
1.2 SSD Caching Policies It appears that gathering region-based data online could be helpful to determine which regions are warm and which are cold. Using this information, one can define suitable admission control and eviction policies for the SSD bufferpool. Region-based data has advantages over page-level statistics. First, keeping statistics for every page in the database would take much more space. Second, page-level statistics would be more sparse, would take longer to accumulate, and if used alone would not capture the information that accesses to neighboring pages increase the chance of reuse for a given page. In DB2, data is stored in extents, groups of 32 contiguous pages. In this work we accumulate temperature statistics at the extent granularity. Traditional caches admit every page, and accumulate data about use over time, such as frequency of access or time of last access. Pages are candidates for eviction if they are accessed rarely (low frequency) or long ago (old time of last access). Information about the reuse potential of a page is gathered only after the page is admitted, and it may take time for the system to evict a cold page. For example, under
a least recently used (LRU) policy, a newly admitted page that is never reused will not be replaced until after at least N more page accesses, where N is the capacity of the cache. Cold pages will therefore pollute the cache, and lead to a smaller effective cache size. In our approach, we gather region-level statistics on the fly. A page is admitted if it comes from a warm region. A page from a cold region may be admitted, but only if it does not displace a page from a warm region. Region statistics are maintained online, and updated for each page access, whether the access resulted in the admission of the page or not. As a result, the system can adapt to changes in page access patterns over time. By refusing to admit pages from cold regions at the expense of pages from warm regions, more of the cache is available for warm-region pages, leading to improved cache utilization.
1.3 System Architecture Our system architecture is summarized in Figure 2. In this figure, arrows represent the flow of data pages. When data is read (item 1 in the figure) the memory-resident bufferpool is consulted. If the data is not memory resident, its corresponding page has to be brought in from SSD or disk and the temperature of the region containing that page is updated. First, the SSD bufferpool is interrogated, and if found, the page is read into the main memory bufferpool (item 2). If the data is not on the SSD, the page is read from disk as usual (item 3), with a copy being fed into the temperaturebased replacement logic. If the page is warmer than the coldest clean page currently cached, it is written to the SSD (item 4). Queries may cause records to be modified (item 6), resulting in pages marked “dirty” in the main memory bufferpool. Whenever a dirty page is displaced from the main memory bufferpool (item 5) it is written to the HDD and updated in the SSD (item 6), if present. Every time a page is read from either the SSD (item 2) or HDD (item 3), its identifier is also fed into the temperature-based replacement logic so that the temperature information is updated. We assume an SSD device whose random access performance exceeds both the random and sequential access performance of the underlying hard disk drives. The FusionIO
1436
device we use in our experiments satisfies this assumption. If sequential I/O on the hard disk was faster than random I/O on the SSD, the architecture of Figure 2 would be suboptimal because sequential I/O cannot bypass the SSD bufferpool after the first access.
1.4 Evaluation We evaluate our architecture in two ways. To evaluate the cache replacement policies, we record a physical I/O trace of IBM DB2 LUW. We then replay this trace through a cache simulator to compare our SSD replacement algorithms with previously proposed methods. The simulator sends physical I/O requests based on the trace to actual SSD and hard disk devices and measures the elapsed time. Traces based on TPC-C [26] and TPC-H [27] are considered, to evaluate the benefits for both transaction processing and query processing. Secondly, we implemented the described method in DB2 LUW. It was then evaluated using two workloads: an enterprise resource planning (ERP)-like workload and the TPC-C workload.
1.5 Main Results and Contributions Our performance results show that the region-based temperature calculation is effective. Caching based on these temperatures significantly outperforms alternative methods. Once the temperature statistics are warm, the hit rate and I/O time can be a factor of two better than competing methods. The additional information provided by the temperature statistics allows the system to limit admission to the cache to pages from relatively warm regions. Conventional caches admit all pages and only then accumulate usage statistics. Our method thus makes better use of the cache by avoiding transient caching of cold pages. By adding an SSD layer to DB2, we are able to obtain a speedup of over 5x for an ERP workload where the SSD can hold roughly one quarter of the database. Our algorithms are able to identify the hot data and the SSD is able to satisfy 83% of the physical I/O requests for pages not in the memory-resident bufferpool. Our approach overcomes the two drawbacks we identified in the previous work. First, because all data gathering is online and automatic, no explicit tuning or physical reorganization is required. Second, decisions are made at a region level, which is finer than the whole table level. Thus if only part of a table is warm, such as the most recently appended data, only that part of the table will be cached. The remainder of the paper is organized as follows: we start by highlighting some target database scenarios for our approach in Section 2; we follow with the details of our SSD bufferpool extension in Section 3; then, in Section 4 we compare the performance of our cache against other known policies through a trace-based simulation; we evaluate the performance of our SSD bufferpool extension implemented inside DB2 in Section 5; finally, we discuss related work in Section 6 and we conclude in Section 7.
2.
MOTIVATING EXAMPLES
We outline several common use scenarios that could benefit from our SSD caching approach. In the three examples below, there would be no benefit to temperature statistics at a finer granularity than an extent, because extent-level statistics capture the essence of the distribution.
Example 2.1. Consider an extent from a table that is clustered by one or more attributes of the table. DB2 LUW supports multi-dimensional clustering [23] where all records in an extent have the same values for the dimension attributes. Suppose that the most common access pattern is a range or equality query on the clustering attributes. Then for most extents, either the whole extent will satisfy the query, or the whole extent will not satisfy the query. Thus there is a very strong correlation between the access patterns of all pages within each extent. Example 2.2. Consider a table scan or a range partitioned scan in which accesses to all records in the table (or range) are equally likely. Then the access probability of a page is exactly the access probability of the extent divided by the extent size. One might think that uniformly accessed tables would be bad candidates for caching since there is no locality within them. However, one must consider interactions between tables. A table T with an access frequency that is uniformly high should be cached ahead of the colder parts of other tables. If T is relatively small, it could conceivably be cached in its entirety. Example 2.3. Consider a table where new data is appended to the end of the table. If more recent data is more frequently accessed, there will be a gradient of increasing temperature as one progresses though the table. Within any small segment of the table, pages will have been inserted at about the same time, and will thus have similar temperatures. Each of these examples represents a typical use case that could benefit from our approach.
3. METHODOLOGY In this section we describe the algorithm managing our SSD bufferpool extension, the Temperature-Aware Caching (TAC) algorithm.
3.1 Region-based Temperature Calculation Each page request issued by the bufferpool layer contributes to the computation of regional temperatures. The access patterns of the page requests are determined using a windowing technique. As the pages are requested, the consecutive page IDs are accumulated within a logical window. Once the window is full, the page IDs are transformed into region IDs. If a region is accessed more than a certain number1 of times within a window, these page requests are labeled as “sequential”. Otherwise the page request is labeled as “random”. As mentioned previously, we assume an SSD device whose random access performance exceeds both the random and sequential access performance of the underlying hard disk drives. In such a case, it pays to cache both sequentially accessed and randomly accessed pages, but the payoff for randomly accessed pages is higher. For an accessed page P , we compute the cost C(P ) defined using the following function. 1 In our implementation, this number is 2, for a window size of 20.
1437
(
if P accessed sequentially if P accessed randomly (1) In this function SHDD and RHDD are the times the hard disk takes to perform a sequential read and a random read respectively. RSSD is the time to perform a random read on the SSD. Consequently, ∆S is the extra time cost incurred if the requested page has not been found on the SSD and is retrieved from the hard disk in a sequential manner. Similarly, ∆R is the extra time cost of retrieving the page from the disk in a random fashion if the page does not exist on the SSD. C(P ) is computed and added to the incremental cost of P ’s region. Over time, the temperature statistics allow one to identify the regions of the disk that would have incurred the highest I/O cost. These cumulative values help the system determine the best pages for retention or replacement. In order to allow temperature values to reflect changing access patterns over time, we apply a standard aging policy [29] in which temperature values are halved after a certain number of accesses. The effect of this halving is that historical data is weighted lower than recent data in determining temperature levels. C(P ) =
∆S = SHDD − RSSD ∆R = RHDD − RSSD
3.2 Temperature-based Replacement Policy As described in Section 1.3 the SSD bufferpool is populated with pages read from the HDD. While the SSD bufferpool is not full, all incoming pages are admitted. Afterwards, whenever a page P is read from the HDD, it is considered for caching on the SSD in place of the coldest page currently cached. When a dirty page P ′ is discarded from the main memory bufferpool, if an earlier version of it is currently cached on the SSD than it is updated in place, so the SSD bufferpool acts like a write-through cache. This writethrough operation does not take into account the current temperature of the dirty page’s region. One could conceivably check the temperature at the time of displacement and when the dirty page is sufficiently hot, try to cache it on SSD. However, since hot pages are accessed frequently, this will happen “naturally” with the next read access to this page. Note that the current design performs random writes to the SSD at page granularity. As Chen et al. [3] report, highend SSD devices do not show noticeable performance penalties for random versus sequential writes due to their internal write buffering. They do however point out that subsequent writes that are randomly distributed over the SSD space can lead to internal fragmentation (i.e., erase blocks with invalid pages). This in turn can lead to a significant drop in performance if the defragmentation logic of the SSD cannot keep up. For this reason, one may instead buffer multiple pages in memory and write to the SSD one full erase-block at a time, whereby reducing internal fragmentation. We experimented with this approach by accumulating pages in memory and grouping them in blocks before writing to the SSD. In this approach, the unit of replacement on the SSD bufferpool is an erase block, instead of a page. This increases the bookkeeping overhead somewhat since dirty pages can no longer be updated in place on the SSD so their previous versions need to be invalidated and their space reclaimed. For the FusionIO device we used in our experiments and the investi-
gated workloads, this page buffering approach did not yield any measurable performance benefits, so we decided to keep the current page-at-a-time design.
3.3 Implementation Details In this section, we provide more detail about how we efficiently implement the architecture outlined in Figure 2. When a page P is requested, and is not in the memoryresident bufferpool, the request is transferred to the SSD bufferpool agent. The SSD bufferpool agent checks if the page is stored in the SSD by probing a memory-resident hash table. For each SSD-resident page P , this table keeps a pair (HP , SP ), where HP is the location of the page on the disk and SP is the location of the page on the SSD Determining the region of a page is a simple calculation on HP , since extents are contiguous and aligned. Temperature-based statistics are stored per region in a memory-resident hash table that maps regions to temperatures for all regions that have been accessed in the past. Since the number of regions depends on the sizes of all database objects, this hash table may need to be resized once its occupancy factor exceeds some threshold. Because we use only static databases in our experiments, we implemented a fixed-size hash table for the current prototype. The temperature-based replacement policy depends on the ability to identify the coldest page currently cached on the SSD. In order to do that efficiently, we maintain a heap with all cached pages, organized by their temperature, so that extracting the coldest page can be done in logarithmic time. The temperatures are current at the time of insertion in the heap, and are updated lazily, in order to minimize the heap reorganization cost. More precisely, whenever a victim needs to be identified, we update the temperature of the heap’s top and re-insert it. If another page is now in the top, we update its temperature too and re-insert it. We repeat this a small number of times (currently five times), and finally pick the page currently at the top of the heap. This way, the worst case cost for extracting the coldest page is still logarithmic. It is not necessary to identify the absolute coldest page in order to achieve good caching behavior. Oftentimes, finding a page that is among the coldest is sufficient. This can be accomplished with constant cost as follows. Assume the temperature range is divided into a fixed number of temperature ranges or “bands”. Every page can then be assigned to one of these bands, depending on its current temperature. In memory, we can store the pages belonging to a band in a linked list. Whenever a page’s temperature is updated, we determine if it has to be moved to a different band and then insert it in the list of the correct band. Finding the coldest page can now be accomplished in constant time: first, the bands are inspected from coldest to hottest, until one with a non-empty page list is found (there is a constant number of bands, typically less than 100). Then, the front page of the list is removed in constant time. Besides the efficiency gain, this approach has the advantage of introducing some amount of “smoothing”. In real workloads, pages rarely have temperatures that are exactly the same. Consider, for example, the case of a table scan. The pages at the beginning of the scan are already getting hotter while the pages still to be scanned are relatively colder, even though they should be of the same temperature logically. With multiple scans in different locations, the tem-
1438
peratures get even more diverse (even though this danger can be reduced by techniques such as scan sharing [17]). The net effect is that upcoming scan pages may be displaced by the seemingly hotter past scan pages. By introducing temperature bands, this danger is reduced significantly, since now all scan-related temperatures end up in the same band with high likelihood. While efficient, this solution introduces three new tuning knobs: the number of temperature bands, the choice of band boundaries, and the replacement policy within a band. All three are dependent on the workload characteristics. For our benchmark workloads, we found between 50 and 100 bands to be a good choice, with less than 10 bands usually leading to noticeable degradation due to “over-smoothing” and more bands not improving the performance. In our tests, we picked the band boundaries using equi-depth histograms but more investigation is needed for this knob since we typically found many very thin bands in the “very cold” category and some thin bands in the “very hot” category, with few or none in between. Regarding the replacement policy within a band, LRU may seem to be an obvious choice. However, if the workload consists largely of sequential scans, MRU may be a good choice as well: as discussed earlier, pages of scans will end up in the same band with high likelihood. With MRU policy, the beginning of a scan may remain in the SSD bufferpool and improve reuse by other scans. LRU, on the other hand, would displace the oldest scan pages first which can lead to fewer cached scan pages if the SSD bufferpool is too small. This knob requires more investigation as well. During our tests, we determined that this banded approach is similar in performance to a modified heap-based approach: instead of admitting a page into the heap as soon as it is warmer than the coldest page, we admit it if it is at least 1% warmer than the coldest page. This way, similar smoothing is achieved as with bands. Since our tests showed no discernible difference in performance, we chose the slightly simpler “smoothed heap” implementation. Another implementation detail concerns the writing of pages to SSD. While pages could be written synchronously to SSD whenever a page is admitted to the SSD bufferpool (i.e., when reading a hot page from disk or when writing a hot dirty page to disk), this is not exploiting the parallelism available from having two storage devices. In addition, if there are hundreds of queries running concurrently and the number of SSD devices is small, the SSDs could become a bottleneck from the many write requests and slow down all queries. It would therefore be better to decouple the reads and writes on disk from the SSD writes by introducing a small in-memory buffer that can store a number of pages to be written to SSD. When a page is read or written on disk and is admitted to the SSD bufferpool, it is placed into this memory buffer first, thereby adding only a small overhead. Background writer threads continuously watch the buffer and write any available pages to SSD in parallel with any disk activity. If there are too many write requests being added for the writer threads to keep up, the coldest pages can be dropped from the memory buffer since they provide the smallest benefit. The number of writer threads can be set based on SSD characteristics (e.g., more threads if the SSD has more write queues) or can be adjusted dynamically by monitoring the write performance.
With this write buffering mechanism, the system can dynamically adapt to varying SSD speeds and loads, without affecting the query response times. Since in our experiments, we used a very fast PCI-Express based SSD device, the SSD was never the bottleneck and therefore, no benefit was observed when using decoupled writers. In the experiments, we therefore use synchronous writes. For slower SSDs, this may be a worthwhile consideration though.
4. SIMULATION-BASED EVALUATION In this section, we focus on the merits of our temperaturebased replacement policy relative to other replacement policies for a database-derived I/O workload. In order to compare our temperature-aware cache with other caching algorithms, we first extracted disk access traces by running IBM DB2 on various workloads. Then, we replayed those traces with a custom simulator program implementing several replacement policies. These traces include the disk offsets of the read-write requests issued by the DB2 prefetchers and page cleaners. The simulator program implements the lower part of what’s described in Figure 2 (the components between the main memory bufferpool and the hard disk). For the experiments we created one file on the hard disk and multiple files on the SSD. The file on the disk is as large as the table space of the database we used for running the workloads. We created multiple files on the SSD with different sizes to simulate varying sizes of SSD bufferpool cache. The simulator reads the offset values from the trace file and retrieves the pages corresponding to these offset values from the file which is stored on the disk. For write operations, the pages are written to the file according to their offset values. If a requested page is stored on the SSD bufferpool, the page is retrieved from the SSD. Otherwise, the page is retrieved from the disk. Initially we assume that the SSD bufferpool is empty. As the data pages are read from the disk, the pages are written to the SSD cache. During the execution of the simulation program, we measure the overall elapsed time. The TAC algorithm in the simulator program is implemented as described in Section 3. We compare the performance of the proposed algorithm with the following page replacement algorithms: least recently used (LRU), first in first out (FIFO), clock replacement, and adaptive replacement (ARC). These are the most commonly used algorithms in the conventional database engines and enterprise storage systems. In addition, we compare our algorithm with the optimal replacement (OPT) algorithm. Sybase ASE allows partitioning the bufferpools for different objects and for each bufferpool either LRU or clock replacement algorithms are used. IBM DB2 also allows bufferpool partitioning and uses a variant of clock replacement for memory management (e.g., index non-leaves get a higher starting clock value to delay their replacement). Informix and Oracle both maintain a single global bufferpool using LRU. Microsoft SQL Server has a single bufferpool using clock replacement [24]. In the implementation of LRU we used a queue of pointers to the memory frames. Once a frame is ready for replacement, it is moved to the end of the queue. The frames at the head of the queue is used for replacement. Clock is a variant of LRU: It has similar behavior but less overhead. An iterator points to one of the buffer frames numbered from 1 to N. The iterator traverses these buffer
1439
Table 1: Hardware specifications of the SSD
2500
Fusion IO Single Level Cell (SLC) 80GB PCI-Express x4 700 MB/s (random 16K) 550 MB/s (random 16K) 370 MB/s (70R/30W random 4k mix) 88,000 (70R/30W random 4k mix) 50µs Read 24yrs (@ 5-TB write-erase/day)
500
0 O PT
C AR
U
LR
C TA
ck
FO FI
lo
C he ac
Figure 3: Execution times of various cache replacement algorithms for the modified TPC-H query workload (160 MB main memory bufferpool size, 320 MB SSD bufferpool size)
Below, we explain the details. We prepared a workload using the TPC-H queries and the TPC-H schema which includes 8 relations. While generating the data, a scale factor of 10 is used. In total, 15 GB of disk space is used to create the TPC-H database. The workload used in the experiments is constructed using 5 TPC-H queries (Query # 2, 5, 9, 11, 17) with the objective of maximizing the number of objects accessed during the execution of each query. We subsequently modified these queries to simulate an Operational Data Store (ODS) environment where some of the queries in the workload require processing large ranges of data while others process smaller ranges. The major difference between an ODS and a data warehouse (DW) is that the former is used for short-term, missioncritical decisions while the latter is used for medium and long-range decisions. The data in a DW typically spans a five to ten years horizon while an ODS contains data that covers a range of 60 to 90 days or even shorter [7, 10]. In order to simulate an ODS environment, more predicates are added to the “where” clause of the TPC-H queries. This in turn, reduces the number of rows returned. As a result, we obtained a workload comprising random and sequential accesses. The following query provides an example for this modification: select n name, sum(l extendedprice * (1 - l discount)) as revenue from customer, orders, lineitem, supplier, nation, region where c custkey = o custkey and l orderkey = o orderkey and l suppkey = s suppkey and c nationkey = s nationkey and s nationkey = n nationkey and n regionkey = r regionkey and r name = ’america’ and o orderdate ≥ ’1993-01-01’ and o orderdate ≤ ’2000-01-01’ and o orderkey between 170261658 and 170271658 group by n name order by revenue desc
4.2 TPC-H based Experiments The TPC-H benchmark is a decision support benchmark widely used in the database community to assess the performance of very large database management systems [27]. Using the TPC-H schema, we prepared an Operational Data Store (ODS) environment [7, 10, 25] to compare the effectiveness of our proposed page replacement algorithm. We followed the same experimental methodology described in [2] while preparing the experimental testbed and the workloads.
1000
C
All experiments are conducted on a 64 bit Fedora 8 (Linux kernel 2.6.24) operating system. IBM DB2 LUW V.9.5 is used as the DBMS software. As for the platform, we used an IBM x3400 model 7974 which has 4GB of main memory and a Dual core Intel Xeon 64 bit processor. Hardware specifications for the solid state disk are given in Table 1. The hardware specifications of the HDD used in these experiments are as follows: Seagate 1TB SATA HDD of 7.2K RPM, 8.2 ms average seek time and 4.17 ms average latency, 1070 Mb/sec max media transfer rate.
1500
o
4.1 Hardware & Software Specifications
2000
N
frames in a circular fashion. Each frame has an associated referenced bit, which is turned on when the page is accessed. Whenever a buffer frame is searched for replacement, the frame which is pointed by the iterator is used if the referenced bit is 0. Otherwise, the iterator is incremented until finding an available frame [24]. The adaptive replacement cache (ARC) maintains four LRU lists with page IDs for pages currently in the cache as well as pages which were recently evicted from the cache and adaptively tunes the sizes of these lists [21]. Finally, OPT (Belady [1] calls this algorithm MIN ) is an offline page replacement algorithm that can take all future page requests into account for its replacement decisions. Whenever a page needs to be replaced from the bufferpool, OPT picks the page that is accessed the latest in the future access sequence. This represents the optimal policy with regard to minimizing bufferpool misses. However, it is important to note that OPT does not necessarily minimize the overall access cost due to the difference in random and sequential accesses. In order to minimize the overall cost, it may be better to discard a page that is accessed sooner but mostly sequentially than a page that is accessed later but benefits more from SSD caching because it is accessed randomly. For this reason, some of the online algorithms can actually perform better than OPT from an access cost perspective. Below, we first give the hardware and software specifications of the system where we conducted the experiments. Then, we discuss the details of the experiments.
Total Execution Time of the Workload (sec)
Brand: NAND Type Storage capacity: Interface: Read Bandwidth: Write Bandwidth: Mixed Bandwidth: IOPS: Access Latency: Wear Leveling:
In this query, the predicate “o orderkey between 170261658 AND 170271658” is added to the original query to reduce the range of the data that has been accessed. In order to reduce the bufferpool hit ratio, the predicate values are randomly
1440
800 Average SSD hit ratio
Total Execution Time of the Workload (sec)
1000
600
400
200
0
0.75 0.7 0.65 0.6 0.55 0.5 0.45 0.4 0.35 0.3 0.25 0.2 0.15 0.1 0.05 0 1
O PT
C AR
U
LR
C TA
ck
he ac
C
FO FI
lo
C
o
N
Clock
2 3 4 Ratio of SSD/MM bufferpool size FIFO
LRU
ARC
5 TAC
Figure 4: Execution times of various cache replacement algorithms for the Zipfian-distributed TPC-H query workload (160 MB main memory bufferpool size, 320 MB SSD bufferpool size)
Figure 5: SSD bufferpool hit ratio of various cache replacement algorithms for the TPC-C workload (386 MB main memory bufferpool size, for various SSD bufferpool sizes)
drawn from a uniform distribution with range (0, n) where n is the maximum in the domain of the predicate attribute. Using this technique, 500 TPC-H queries are generated and issued to the database. We set the main memory bufferpool size of the database to 160 MB. During the execution of this workload the disk accesses are monitored and logged in a file. Next, this log file is provided to the replay application. Three separate hard disk drives are used to isolate the I/O operations. The operating system uses the first disk and the log file is stored in the second disk. We use the third disk for storing all table spaces including the index and data pages. During the simulation, 320 MB (20,000 pages) of SSD space is used for the SSD bufferpool. We then ran each page replacement algorithm on the same trace separately. The total execution time for each cache algorithm is shown in Figure 3. We can see that our temperature based algorithm (TAC) is very close to the optimal replacement algorithm, at nearly half of ARC’s execution time and at nearly one third of the other replacement algorithms. It should be noted that the execution times are measured starting from an empty cache, so they include a brief warm-up period. In a second experiment, we use the same TPC-H instance described above with a workload that simulates a typical data warehouse where recent data is accessed more often than older data. More precisely, we selected five of the TPCH queries (Query # 1, 6, 14, 15) and we generated the date ranges on the shipdate attribute of the Lineitem table using a Zipfian distribution. Using this technique, we generated 100 queries. Also, in typical DSS and DW environments the tables growing over time are clustered based on date attributes. This is because more recent data records have higher access rate compared to the older data records and clustering the records based on access rate reduces the I/O cost dramatically. For this reason, we clustered the Lineitem table on the shipdate column. In this experiment, the dataset size is 15 GB (TPC-H scale factor 10). The memory bufferpool size is 160MB (10,000 pages) and the SSD cache size is set to 320 MB (20,000
pages). The experiment results are shown in Figure 4. As seen in this figure, TAC performs much better than other online algorithms, close to the optimal algorithm. When the size of the SSD bufferpool is increased to 1.6 GB (10 % of the dataset size), the SSD bufferpool provides more than a three times improvement on the I/O cost, highlighting that big gains are available with a relatively small SSD investment.
4.3 Experiments with TPC-C TPC-C is a popular benchmark for comparing online transaction processing (OLTP) performance on various hardware and software configurations. TPC-C simulates a complete computing environment where multiple users execute transactions against a database. The benchmark is centered around the principal activities (transactions) of an orderentry environment. These transactions include entering and delivering orders, recording payments, checking the status of orders, and monitoring the level of stock at the warehouses. The transactions do update, insert, delete, and abort operations and numerous primary and secondary key accesses [26]. In our experiments, the scaling factor is set to 150 Warehouses during the data generation. With this scaling factor the database occupies a total of 15 GB of disk space. For the memory bufferpool, 368 MB (2.5% of the database size) of space is used while running the transactions of 20 clients. After capturing the disk traces, we ran the replay application and monitored the number of page hits on the SSD bufferpool. These results for different ratios between the size of the SSD bufferpool and the main memory bufferpool are shown in Figure 5. As the results prove, TAC outperforms the other replacement algorithms for all SSD bufferpool sizes. The difference in hit ratios is more pronounced for the case when the SSD bufferpool size is smaller (e.g. 1 or 2 times the size of the main memory bufferpool). This is due to the selective caching property of TAC (not caching pages colder than the coldest page cached), which reduces cache pollution. For large SSD bufferpool sizes, all algorithms (with the excep-
1441
tion of FIFO) perform about the same, because there is less contention for the SSD space.
1400 1200
While the current behavior of the SSD bufferpool is writethrough, a potential advantage of a write-back policy would be the ability to batch random disk writes to HDD into sequential ones. In OLTP environments, the data pages are frequently updated by the active transactions. When there is no space left for dirty pages in the bufferpool, the dirty pages are flushed to the disk. Since the dirty pages are mostly written to random locations on the disk, the random I/O cost reduces the performance. A write-back caching policy could accumulate the dirty pages in the SSD cache and write these pages to the HDD in sequential order once some threshold amount of dirty pages has been reached. There is a variety of ways this can be accomplished. One can reserve part of the SSD for write-back caching and flush the pages accumulated there to disk once full. Another possibility is to store dirty pages among the clean pages in the regular SSD cache but mark them as “dirty”. Once a threshold percentage of dirty pages has accumulated, they are flushed to disk and the corresponding SSD pages are marked “clean”. The latter strategy leaves more valuable SSD space for clean pages when there are few writes but it requires more bookkeeping and more random SSD reads during flushing. For both variants, the dirty pages to be written back to disk should be first sorted by disk location in order to minimize random disk seeks. To observe the benefit of this idea, we conducted an experiment using TPC-C traces. We implemented a replay application that works as follows. Given a trace file, the program considers only the write requests. For each write request, a page is written to the SSD bufferpool sequentially, instead of writing it to the HDD. When the cache is full, the pages are sorted by their hard disk locations and written to the disk sequentially. During the flush process, the pages are read from random locations on the SSD but this cost is negligible compared to the disk I/O cost. We ran the experiment four times while changing the SSD bufferpool size and the results are given in Figure 6. In the first run, the SSD is not used for buffering the dirty pages and the pages are written to the disk directly. In the subsequent runs the SSD size is increased slowly. As seen in the figure, this approach provides a significant performance gain compared to the case where the pages are directly written to the SSD. Therefore, a write-back SSD bufferpool has the potential to further improve performance over TAC. However, since this has non-trivial implications for recovery, we leave this to future work.
5.
IMPLEMENTATION IN IBM DB2
We implemented the Temperature-Aware Caching (TAC) method in DB2 LUW version 9.7 and we evaluated its performance using both customer and benchmark databases. In all experiments, data and indexes were placed on a separate disk from temporary tables.
5.1 ERP Scenario For the experimental evaluation, we used a setup similar to that used by some customers who run ERP solutions over DB2 LUW. This consists of a star schema with a 24 column fact table with 7 dimensions and 16 measures and
Execution Time (sec)
4.4 Effect of Write-Back Caching
1000 800 600 400 200 0 No SSD Cache
78 MB 156 MB SSD Cache Size (MB)
312 MB
Figure 6: Execution time effect of using SSD bufferpool for batching random writes into sequential writes
Table 2: Experimental Setup Details Table size:
Index sizes:
fact table of 16 million records with 176 bytes per record. Total data size of 3GB including fact and dimensions. 7 single part indexes and one multi part unique index. Total index size of 2GB.
associated dimension tables. There were 8 indexes defined on the fact table including a multi part unique index. The total database size including indexes was about 5GB. Table 2 provides more details of the schema we used in the experiment. The hardware and software specifications of the system are the same as those discussed in Section 4.1. The evaluation was done with a set of a dozen queries which had predicates on multiple dimensions, aggregates and multiple table joins. Two of these queries were long running and the rest had small to medium running time. These queries had a total working set size of about 30% (or 1.45GB) of the database size. They were executed using the db2batch utility that comes with DB2 LUW. During these runs, file system caching was turned off, so as to see the actual effect of the database I/O. It is common in customer situations for the database engine to manage the I/O instead of the file system. The evaluation aimed to compare single and multi stream query performance with different sizes of the SSD bufferpool. Each of the streams in the multi stream was made by picking a random query without replacement from the set of dozen queries. For each stream, the end to end time for query execution was recorded and the maximum of these timings was reported. For these experiments, the DRAM bufferpool was kept at 4% of the database size. This is in the range that customers use while running data warehousing on DB2 LUW. The size of the SSD bufferpool was varied from 0 pages to beyond the working set size of this workload. The SSD bufferpool was used to assist the DRAM bufferpool to cache the data and index pages only, not the temporary table pages. Figure 7 shows the query execution times for 1, 4 and 8 streams for a SSD bufferpool size of 24% (or 320K pages)
1442
45000 40000
30
35000
25
30000
Reads (GB)
Execution Time ( x 1000 sec)
35
DB2 LUW 9.5 Prototype on DB2 LUW 9.5
25000 20000
15 10
15000 5
10000
0
5000
0
0 1 stream
4 streams
8 streams
160 140 120 100 80 60 40 20 0 0
20
40
60 Time (min)
80
100
100
200 300 400 SSD Bufferpool Size (x 1000 pages) Data disk
Figure 7: Execution times of the ERP scenario for varying number of concurrent streams with 4% DRAM and 24% SSD bufferpool
Writes (MB / sec)
20
120
SSD Buffer pool Writes
Figure 8: Writes into the SSD bufferpool over time during the ERP 8 stream run
of the database size and a DRAM bufferpool of 4% (or 50K pages). It is being compared against base DB2 LUW running with a DRAM bufferpool of 4%. We obtained a speedup of 3x for a single stream, 4.5x for four streams and 5.3x for eight streams. As the number of streams was increased the speedup kept improving. This is partly because we were able to obtain temperature information faster and partly because we were able to exploit the I/O parallelism that is available in the fusionIO card with multiple streams. Figure 8 shows the volume of writes on the SSD bufferpool for the 8 stream run. In the initial part of the run, we see much higher writes as the bufferpool fills up and then subsequently it stabilizes to replacing pages based on the temperature. By the end of the run, the SSD bufferpool had absorbed 83% of the reads from the queries which spilled out of the DRAM bufferpool. This is shown in Figure 9. In a subsequent experiment, shown in Figure 10, the size of the SSD bufferpool was varied. The execution time keeps
500
600
SSD Buffer pool
Figure 9: Read amounts from disk and SSD bufferpool for various SSD bufferpool sizes during ERP execution
decreasing as we increase the size of the SSD bufferpool until we hit the active data set size. After that the improvement tapers off. It is to be noted that we obtain better speedup with multiple streams as shown in Figure 11. The maximum speedup obtained was 12x for 8 streams with a 400K page SSD bufferpool. As an alternative to using an SSD for caching, one could have used the SSD as a device to store some of the base data. We performed an experiment to give the DB2 system an SSD partition of 24% of the database size to store hot data objects. The hot objects considered were tables and indexes which could fit in this partition and which occurred frequently in the query plans. Given that the fact table would not have fit, and the dimension tables were relatively small (and would be cached in RAM), the indexes of the fact table were placed on the partition. The results of these experiments did not show any noticeable change in the timings of the base configuration over the previous experiments.
5.2 TPC-C Evaluation In this evaluation we used a 48 GB TPC-C database with 500 warehouses. The database was created on a tablespace striped across 3 disks with the logging done on the fusionIO card. A standard TPC-C mixed workload with 15 clients was run on it. The main memory bufferpool was kept at 2.5% of the database size. This resulted in a main memory bufferpool hit ratio in the range of typical customer scenarios. The SSD bufferpool was created on the FusionIO card. Its size was varied as a multiple of the main memory bufferpool size. The workload consisted of the TPC-C transaction types New Orders 45%, Payment 43%, Order Status 4%, Delivery 4% and Stock Level 4%. The transactions per minute (tpmC) for base DB2 LUW and the prototype was measured. These measurements were done after the system had reached a steady state in terms of the number of transactions running per minute. As indicated in Figure 12, a speedup of 2.4 was obtained in the tpmC figures when an SSD bufferpool of 12.5% of the database size was used to aid the main memory bufferpool.
1443
14
35000
12
30000
10
25000
Speed Up
Execution Time (sec)
40000
20000 15000
6 4
10000
2
5000 0
0 0
100 8 streams
200 300 400 SSD Bufferpool Size (x 1000 pages) 4 streams
500
600
0
1 stream
100
200 300 400 SSD Bufferpool Size (x 1000 pages)
8 streams
Figure 10: Impact of variation in SSD bufferpool size on ERP execution time for varying number of concurrent streams
600
1 stream
4
Tpm-C Relative Speedup
3.5
RELATED WORK
The first commercial system we are aware of that used an intermediate paging device between main memory and secondary storage was Multics (Multiplexed Information and Computing Service) as early as the 1970’s. Thus, the multilevel paging hierarchy described in [8] had to deal with many of the same issues as our system, namely replacement policy, page flow between devices, handling of dirty pages, etc. However, since no long-term temperature statistics were maintained, the replacement policies were based on shortterm information such as recency of use, i.e., LRU and later, Clock. More recently, multi-level caching is analyzed in [11, 29, 4, 19, 28]. One common thread is the observation that the locality of page accesses is much weaker in lower level caches because of the filtering effect of the high level caches. As a result, the effectiveness of traditional page replacement policies such as LRU is greatly reduced. The solutions proposed in the past include the coordination of the replacement policies at each level [11, 12], providing hints to the lower level cache manager [11] and special purpose secondlevel cache algorithms such as Multi-Queue [29]. Our solution is a temperature-aware replacement policy for the SSD-resident cache, which bases its admission/eviction decisions on long term usage trends and so it is less affected by the loss of locality that is characteristic of a second-level cache. Our grouping of cache blocks by temperature range is somewhat similar to the grouping in multiple queues of the Multi-Queue [29] and the ARC (adaptive replacement cache) algorithm [20, 21], except that our algorithm does not explicitly migrate blocks from one group to the other based on each page access. Rather, the regrouping happens peri-
4 streams
500
Figure 11: Speedup obtained as SSD bufferpool size is increased for varying number of concurrent streams during ERP execution
The speedup improved further to 3.7 when the SSD bufferpool size was increased to 25% of the database size. The SSD bufferpool delivered a hit ratio of up to 71% when it was set to 25% of the database size.
6.
8
3 2.5 2 1.5 1 0.5 0 0
12.5% SSD Bufferpool size
25%
Figure 12: Impact of variation in SSD bufferpool size on TPC-C transaction rate
odically, when the temperatures of currently cached blocks are re-evaluated. Using flash as a storage medium for a second-level cache in a DBMS is not a new idea. Thus, for example, multilevel caching using flash is discussed in [15]. There, various page flow schemes (inclusive, exclusive and lazy) between the main memory bufferpool and the SSD bufferpool are compared both theoretically, using a cost model, and experimentally. The conclusion drawn is that the best scheme is dependent on the particular workload. While we agree that page flow schemes can impact the performance, we consider this aspect orthogonal to the cache replacement policy question, which is the focus of our work. Another important issue arising in multi-device environments is the allocation of cache space dedicated to each device. Since each device can have very different access costs, especially if SSDs are involved, the cost of a page miss can be vastly different. Consequently it makes sense to assign
1444
a utility that reflects the page miss cost to each cache slot assigned to a device. The resulting optimization problem is discussed in [16] where a self-tuning system is proposed. We employ a similar notion of device-specific utility in our temperature calculations, with the notable difference that we also distinguish between random and sequential accesses. The idea of using an SSD as a write-back cache and converting random writes to the HDD into sequential ones is also exploited in the HeteroDrive system [14]. There, the SSD is used primarily for buffering dirty pages on their way to the HDD, and only secondarily as a read cache, which allows blocks to be written sequentially to the SSD as well. The use of region-level statistics for caching is also discussed in [13], which introduces the notion of a macroblock, essentially contiguous regions of memory with near-uniform access frequency. One difference is that this is done in the context of CPU caching and it is implemented by hardware, whereas our cache is a software solution for I/O reduction. The other difference is that their scheme is designed for general-purpose computing, while ours is optimized for database workloads. In the industrial space, Oracle’s Exadata Smart Flash Cache [22] takes advantage of flash storage for caching frequently accessed pages. The Flash Cache replacement policy avoids caching pages read by certain operations such as scans, redos and backups, as they are unlikely to be followed by reads of the same data. In our approach, pages read by scans will tend to have a low temperature so they will have a low priority for caching, unless they are scanned very frequently. Still in the industrial space, Teradata’s Virtual Storage [6] continuously migrates the hot data to the fastest areas of storage and the cold data to the slowest areas of the storage. Teradata Virtual Storage recognizes the relative performance of the various portions of each disk drive and matches it with the relative temperature of the data to be migrated. Note that while this solution is temperaturebased, like ours, it is a data placement approach, not a caching one. Finally, Sun’s ZFS enterprise file system uses a flash resident second-level cache managed by the L2ARC algorithm [18] which cooperates with the ARC algorithm managing the DRAM cache in an evict-ahead mechanism that batches soon to be evicted pages into large asynchronous writes to the SSD.
7.
CONCLUSION
We presented our work on SSD-resident bufferpool extensions for database systems. The regular memory-resident bufferpool acts like the primary cache, while the SSD portion of the bufferpool is used as a second level cache. Since the locality of references observed at a non-primary cache is much lower than that of the first level cache, standard replacement algorithms (e.g. LRU, Clock) are sub-optimal. To address this problem we designed a caching scheme that continuously monitors the disk access pattern at an extent level and uses the inferred “temperature” information for cache admission/eviction decisions. Our algorithm dynamically adapts to changing workloads by giving more weight to recent access information through an “aging” scheme. To validate our approach, we first compared our TAC cache with existing replacement policies by re-playing DB2 disk access traces in a simulator. Subsequently, we implemented the TAC cache inside the DB2 engine and compared the performance against the baseline DB2 when servicing
multiple concurrent streams of queries. Both sets of experiments demonstrate substantial improvements: up to 3x better than competing cache policies in the simulator and up to 12x over baseline in the DB2 implementation. Future work includes exploiting the persistence of the SSD for warm cache re-start after an orderly shutdown and data recovery after a failure; adaptive self-tuning of the SSD bufferpool size and other parameters for changing workloads; and collecting statistics about cache coverage of individual database objects and using that information in query optimization.
8. REFERENCES [1] L. Belady. A study of replacement algorithms for virtual storage computers. IBM Systems Journal, 5(2):78–101, 1966. [2] M. Canim, G. A. Mihaila, B. Bhattacharjee, K. A. Ross, and C. A. Lang. An object placement advisor for DB2 using solid state storage. Proc. VLDB Endow., 2(2):1318–1329, 2009. [3] F. Chen, D. A. Koufaty, and X. Zhang. Understanding intrinsic characteristics and system implications of flash memory based solid state drives. In SIGMETRICS ’09: Proceedings of the eleventh international joint conference on Measurement and modeling of computer systems, pages 181–192, New York, NY, USA, 2009. ACM. [4] Z. Chen, Y. Zhang, Y. Zhou, H. Scott, and B. Schiefer. Empirical evaluation of multi-level buffer cache collaboration for storage systems. SIGMETRICS Perform. Eval. Rev., 33(1):145–156, 2005. [5] DB2 for Linux, UNIX and Windows. http://www-01. ibm.com/software/data/db2/linux-unix-windows. [6] P. Frazier, P. Andersen, G. Boggs, C. Carrillo, D. Holtzman, J. M. Morris, P. K. Muller, and P. Rubio. Decoupled logical and physical data storage within a database management system. Patent Application no. 20080281939, May 2007. [7] P. Gray and H. J. Watson. Present and future directions in data warehousing. SIGMIS Database, 29(3):83–90, 1998. [8] B. S. Greenberg and S. H. Webber. The multics multilevel paging hierarchy. In IEEE, editor, Proc 1975 IEEE Intercon, 1975. [9] Performance value of solid state drives using IBM i, May 2009. http://www-03.ibm.com/systems/ resources/ssd_ibmi.pdf. [10] W. H. Inmon. Building the Operational Data Store. John Wiley & Sons, Inc., New York, NY, USA, 1999. [11] S. Jiang, K. Davis, and X. Zhang. Coordinated multilevel buffer cache management with consistent access locality quantification. IEEE Trans. Comput., 56(1):95–108, 2007. [12] S. Jiang, F. Petrini, X. Ding, and X. Zhang. A locality-aware cooperative cache management protocol to improve network file system performance. In ICDCS ’06: Proceedings of the 26th IEEE International Conference on Distributed Computing Systems, page 42, Washington, DC, USA, 2006. IEEE Computer Society. [13] T. L. Johnson and W. mei W. Hsu. Run-time adaptive cache hierarchy management via reference
1445
[14]
[15]
[16] [17]
[18] [19]
[20]
analysis. In Proceedings of 24th Annual International Symposium on Computer Architecture, June 1997. S.-H. Kim, D. Jung, J.-S. Kim, , and S. Maeng. HeteroDrive: Re-shaping the storage access pattern of oltp workload using ssd. In Proceedings of 4th International Workshop on Software Support for Portable Storage (IWSSPS 2009), pages 13–17, October 2009. I. Koltsidas and S. Viglas. The case for flash-aware multi level caching. Internet Publication, 2009. http://homepages.inf.ed.ac.uk/s0679010/ mfcache-TR.pdf. I. Koltsidas and S. Viglas. Utility-aware multi-device caching, 2009. C. A. Lang, B. Bhattacharjee, T. Malkemus, S. Padmanabhan, and K. Wong. Increasing buffer-locality for multiple relational table scans through grouping and throttling. Proc. of International Conference on Data Engineering, 0:1136–1145, 2007. A. Leventhal. Flash storage memory. Commun. ACM, 51(7):47–51, 2008. X. Li, A. Aboulnaga, K. Salem, A. Sachedina, and S. Gao. Second-tier cache management using write hints. In FAST’05: Proceedings of the 4th conference on USENIX Conference on File and Storage Technologies, pages 9–9, Berkeley, CA, USA, 2005. USENIX Association. N. Megiddo and D. Modha. ARC: A self-tuning, low overhead replacement cache. In In Proceedings of the 2003 Conference on File and Storage Technologies
(FAST, pages 115–130, 2003. [21] N. Megiddo and D. S. Modha. Outperforming LRU with an adaptive replacement cache algorithm. Computer, 37(4):58–65, 2004. [22] A technical overview of the Sun Oracle Exadata storage server and database machine. Internet Publication, September 2009. http://www.oracle. com/technology/products/bi/db/exadata/pdf/ Exadata_Smart_Flash_Cache_TWP_v5.pdf. [23] S. Padmanabhan, B. Bhattacharjee, T. Malkemus, L. Cranston, and M. Huras. Multi-dimensional clustering: A new data layout scheme in DB2. In A. Y. Halevy, Z. G. Ives, and A. Doan, editors, SIGMOD Conference, pages 637–641. ACM, 2003. [24] R. Ramakrishnan and J. Gehrke. Database Management Systems. McGraw-Hill, 2003. [25] J. Samos, F. Saltor, J. Sistac, and A. Bard´es. Database architecture for data warehousing: An evolutionary approach. In DEXA ’98: Proceedings of the 9th International Conference on Database and Expert Systems Applications, pages 746–756, 1998. [26] TPC-C, On-Line Transaction Processing Benchmark. http://www.tpc.org/tpcc/. [27] TPC-H, Decision Support Benchmark. http://www.tpc.org/tpch/. [28] C. Williamson. On filter effects in web caching hierarchies. ACM Trans. Internet Technol., 2(1):47–77, 2002. [29] Y. Zhou, Z. Chen, and K. Li. Second-level buffer cache management. IEEE Transactions on Parallel and Distributed Systems, 15:2004, 2004.
1446