Jun 4, 2012 - Flow monitoring technologies, such as Cisco's. This is the ..... hosts, the most advanced phase detected, and whether the attack is still ongoing;.
SSHCure: A Flow-Based SSH Intrusion Detection System Laurens Hellemons, Luuk Hendriks, Rick Hofstede, Anna Sperotto, Ramin Sadre, Aiko Pras University of Twente Centre for Telematics and Information Technology (CTIT) Faculty of Electrical Engineering, Mathematics and Computer Science (EEMCS) Design and Analysis of Communication Systems (DACS) Enschede, The Netherlands {l.a.j.hellemons,l.hendriks}@student.utwente.nl, {r.j.hofstede,a.sperotto,r.sadre,a.pras}@utwente.nl
Abstract. SSH attacks are a main area of concern for network managers, due to the danger associated with a successful compromise. Detecting these attacks, and possibly compromised victims, is therefore a crucial activity. Most existing network intrusion detection systems designed for this purpose rely on the inspection of individual packets and, hence, do not scale to today’s high-speed networks. To overcome this issue, this paper proposes SSHCure, a flow-based intrusion detection system for SSH attacks. It employs an efficient algorithm for the real-time detection of ongoing attacks and allows identification of compromised attack targets. A prototype implementation of the algorithm, including a graphical user interface, is implemented as a plugin for the popular NfSen monitoring tool. Finally, the detection performance of the system is validated with empirical traffic data.
1
Introduction
One third of the world population was connected to the Internet in 2011 [1]. The fact that the number of people using and relying on the Internet is increasing rapidly makes breaking into and compromising systems an ever more lucrative activity for hackers. One popular class of attack targets is that of Secure SHell (SSH) daemons. By means of SSH, a hacker can gain access to and potentially full control over remote hosts. Once compromised, a hacker can sabotage not only the host itself, but also use it for attacking other systems. The detection of intrusions, especially in the case of SSH, is therefore crucial for preventing damage to hosts and networks. Most intrusion detection systems (IDSs) are packet-based, relying on the inspection of packet payloads [2]. In high-speed networks, specifically those with average throughputs in excess of 1 Gbit/s, such an approach is no longer feasible. Additionally, the encryption of traffic, as is the case for SSH, makes packet payload inspection problematic [3]. Flow monitoring technologies, such as Cisco’s
This is the authors post-print version of the paper published at AIMS 2012. Citations to this paper should be as follows: Hellemons, L. and Hendriks, L. and Hofstede, R. and Sperotto, A. and Sadre, R. and Pras, A. (2012) SSHCure: A Flow-Based SSH Intrusion Detection System. In: Dependable Networks and Services. Proceedings of the 6th International Conference on Autonomous Infrastructure, Management, and Security, AIMS 2012, 4-8 Jun 2012, Luxembourg, Luxembourg. pp. 86-97. Lecture Notes in Computer Science 7279. Springer Verlag. ISSN 0302-9743 ISBN 978-3-642-30632-7
NetFlow [4] or the newer IPFIX [5] protocol, provide aggregated network data by means of flows. A flow is considered to be a set of packets passing by an observation point in a network during a certain time interval and having a set of common properties. Typically, these are the source/destination IP addresses and port numbers, and the transport-layer protocol [6]. Although flow data only provides an aggregated view of the network activity, it can be used in various application areas, including network security (see [7] for an overview). As a consequence, flow-based technologies are inevitable when it comes to designing network-based intrusion detection systems for high-speed networks. In this context, Sperotto et al. have analyzed brute-force SSH attacks and identified their characteristics at the flow level [8, 9]. It has been shown that brute-force SSH attacks typically consist of three attack phases that can be identified using those flow characteristics. Based on the above findings, we have developed our flow-based IDS called SSHCure for the real-time detection of brute-force SSH attacks originating from single attackers. The contribution of our work is two-fold. Firstly, we have designed an efficient and lightweight detection algorithm for SSHCure. The algorithm operates solely on flow data as exported by equipment such as NetFlow monitoring devices, and is able to both detect brute-force SSH attacks and identify compromised attack targets. Secondly, we have implemented a prototype of the IDS, realized as a plugin for the popular NfSen monitoring tool, and validated its detection performance with empirical traffic data. The remainder of this paper is structured as follows. In Section 2, we discuss related work. The detection algorithm is presented in Section 3, followed by a description of our prototype in Section 4. The validation of the proposed detection algorithm is presented in Section 5. Finally, we close this paper in Section 6, where we draw our conclusions.
2
Related Work
Flow-based intrusion detection is a very active research topic [7]. The goal of the present paper is to design and implement a flow-based intrusion detection system for brute-force SSH attacks. In [8] it has been shown that such attacks typically consist of three phases, and a Hidden Markov Model has been proposed to model their behavior at the flow level. Often, an SSH attack starts with a horizontal scan of the (sub-)network, which means that a (usually large) set of hosts is scanned on a specific port number. This is considered the first phase of an SSH attack. Several publications have discussed flow-based detection methods for scans, such as [10], which are generally designed to detect various kinds of scans. In this paper, we use a lightweight method tailored to the specific characteristics of attacks targeting SSH daemons. A work that is related to ours is [11], which proposes an algorithm for the flow-based detection of SSH dictionary attacks. In the three-phase model that we use in our paper, dictionary attacks correspond to the second phase of the attack, while we aim to detect attacks earlier, during their scanning phase.
For implementing our IDS, several frameworks and architectures are possible. One option is a framework called TOPAS (Traffic flOw and Packet Analysis System), proposed in [12], which analyzes flow data in real-time through userdefined detection modules. Another modular approach to flow analysis applications is the plugin framework provided by NfSen (NetFlow Sensor) [13]. This has been used by SURFmap [14, 15], for example. NfSen supports plugins for raw data processing, as well as data visualization. It is widely deployed, well known within the research community and is considered to be among the state-of-theart tools for network monitoring. As such, we have decided to develop SSHCure as a plugin for NfSen.
3
Detection Algorithm
In this section we will provide the background for the types of SSH attacks we consider, and discuss the metrics used for identification of the three attack phases (Section 3.1). After that, our algorithm will be presented in Section 3.2. 3.1
SSH Attack Analysis
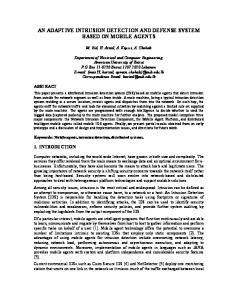
The work in [8, 9] has analyzed the flow-level characteristics of SSH intrusion attacks, in particular focusing on SSH dictionary attacks. For this type of attack, the authors of [8, 9] have found that the analysis of the attacker behavior over time, based on flows, shows a clear pattern of the evolution of the attack. Such an analysis is based on the connection pattern between the attacker and its targets, and on the intensity of the traffic in terms of packets-per-flow (PPF). Figure 1(a) visualizes such a connection pattern for an attack monitored at the University of Twente (UT). The UT campus network uses a /16 IPv4 address block. In the figure, we show how the attacker connects to the different IP addresses of the UT address block over the attack duration of around 2700 seconds. Every point in the plot corresponds to a flow record from the attacker to the UT network, respectively, from UT hosts back to the attacker. Three phases can be identified [8, 9]: 1. Scanning phase - The attacker scans an IP address block in order to find hosts running an SSH daemon (TCP port 22); 2. Brute-force phase - The attacker tries to login to a small subset of the scanned hosts, using a large number of username/password combinations; 3. Die-off phase - After a successful login, there is still traffic between the attacker and the compromised target. This residual traffic is due to commands being executed by the attacker on the target host. For the specific case depicted in Figure 1(a), the scanning phase takes place from the beginning of the attack until t ≈ 1000s, immediately followed by the bruteforce phase, which terminates at t ≈ 1750s. Finally, residual traffic is present on the network until t ≈ 2750s after the beginning of the attack.
50000
IP
40000
30000
20000
10000
0
0
500
1000
1500
2000
2500
3000
2000
2500
3000
Time (s)
(a) 70000
16
FROM ATTACKER TO ATTACKER
14
60000
12
50000
10
IP
ppf
40000
8
30000
6 20000
4
10000
2
0
0
0
500
1000
1500
2000
2500
3000
0
500
1000
1500 Time (s)
Time (s)
(b)
(a)
(a) Time-series for IP addresses 16
(b) Time-series for packets-per-flow (PPF)
Fig. 2. Temporal visualization of a brute-force SSH scan (a) and variation of packets per flow during the scan (b)
Fig. 1. Traffic generated by SSH attack, from [8]
14
12
A different view on the attacks is given by Figure 2(a). Each mark in the graph either represents a malicious connection from the attacker to a victim or the answering
10
ppf
Figure 1(b) provides a different view onthethe attack. It attacker. showsThe how the number connection from victim back to the y-axis gives the 65,535 possible destination addressesthe in thescanning university network. We identify three attack phases. During of PPF changes over the attack duration: phase is characterized scanning phase (first 1000 seconds), the attacker performs a sequential SSH scan by small flows; the brute-force the phase by the exchange of a significant number of spanning over the entire network address space. In this phases, the attacker gathers inpackets in a short amount of time; finally, the phaseSSHbyservice. sporadic formation on which hostsdie-off run a vulnerable Only fewresidual victims respond to the attack. Once this phase is completed, the attacker in initiates a brute-forcethe user/password traffic. Since detection of attack phase transitions is essential SSHCure, guessing attack (brute-force phase). In this phase, only a small subset of the hosts in PPF metric will play a prominent role within our detection algorithm, which (b) the next subsection. will be presented in The three phasesSSHdescribed above allowperfor Fig. 2. Temporal visualization of a brute-force scan (a) and variation of packets flow a wide range of attack evolutions. during the scanFor (b) example, some attacks stop before passing through all three phases. In addition, measurements performed on the UT campus network have shown that a A different view on the attacks is given of by Figure 2(a). Each mark in the SSH graph ei-intrusion attacks start directly in significant portion recently observed ther represents a malicious connection from the attacker to a victim or the answering thethebrute-force without passing through the scanning phase). The connection from victim back to thephase attacker. (i.e. The y-axis gives the 65,535 possible destination addresses in the university We identify three attack phases. During can evolve through the different state machine innetwork. Figure 2 describes how attacks the scanning phase (first 1000 seconds), the attacker performs a sequential SSH scan phases. spanning over the entire network address space. In this phases, the attacker gathers in8
6
4
2
0
0
500
1000
1500
2000
2500
3000
Time (s)
formation on which hosts run a vulnerable SSH service. Only few victims respond to the attack. Once this phase is completed, the attacker initiates a brute-force user/password guessing attack phase). In this phase, only a small subset of the hosts in 3.2(brute-force Algorithm
Core to the operation of SSHCure is the SSH intrusion detection algorithm, based on the attack analysis presented earlier. The algorithm classifies attacks into one or more subsequent attack phases, according to the state-machine in Figure 2. The traffic metrics used by the algorithm are calculated with a time granularity of 1 minute. In the remainder of this section, we present how the algorithm detects each attack phase. Scanning phase During the scanning phase, an attack has some clearly distinguishing characteristics. Since attacks are assumed to originate from a single attacker, many small flows from the attacking host to a large number of targets is an indication of an attack in the scanning phase. The detection algorithm selects suspicious traffic by means of the following two metrics:
Start
Start
Scanning
Brute-force
Die-off
End
Fig. 2. Attack phase state-machine
1. Packets-per-flow (PPF): The algorithm uses an upper limit of 2 PPF during the scanning phase, which is a typical feature of a port scan. Unlike attack traffic, regular SSH connections will use the same TCP connection once established, which will result in a higher value for the PPF metric. 2. Minimum number of flow records: If only the PPF metric was used for distinguishing scanning traffic, regular SSH traffic could still be classified erroneously as scanning traffic. This is, for example, the case with SSH sessions involving sporadic activity, because flow monitoring devices divide long-lived flows into multiple flow records. This fact is not a limitation of our algorithm, but of the design of flow monitoring technologies [4]. To overcome this issue, a threshold for the number of flow records per attack in the scanning phase has been defined. Based on measurements in the campus network of the UT in 2011, a value of 200 flow records per time interval of 1 minute was chosen. This threshold corresponds to roughly 200 SSH connection attempts per minute, which is almost guaranteed not to be regular SSH usage. As soon as scanning traffic is detected, both the attacker and target IP addresses are stored for further processing. Brute-force phase As shown in the state-machine depicted in Figure 2, attacks can enter the bruteforce phase either after the scanning phase, or by starting the attack directly from this phase. For identifying the brute-force phase of an attack, the following metrics are used: 1. Packets-per-flow (PPF): Figure 1(b) shows a sharp increase for the PPF metric on the transition of the scanning phase (1.5 PPF on average) to the brute-force phase (11 PPF on average). A PPF value between 11 and 14 is likely to represent 3 (failed) login attempts on an sshd 1 , depending on its configuration. To allow for some margin, our algorithm classifies traffic with a PPF of 8-14 as brute-force traffic. These bounds were chosen based on measurements in our campus network. 1
sshd is a commonly used abbreviation for SSH daemons.
2. Minimum number of flow records: Since we allow intrusion attacks to enter the brute-force phase without passing through the scanning phase, regular SSH traffic can be classified as brute-force traffic when only the PPF metric is applied. This is the case for benign failed login attempts, for example. These false positives can be avoided by including a lower bound for the number of flow records in the brute-force phase. Measurements on the campus network of the UT in 2011 have shown that a threshold of 20 flow records per minute (per attacker) is a reliable metric for distinguishing brute-force traffic. Attacker and target IP addresses involved in the brute-force phase are stored for further analysis. For example, to increase our confidence in the presence of an ongoing attack, SSHCure will try to correlate brute-force traffic with scanning traffic. It should be noticed that an attacker can only evade detection by performing both the scanning and the brute-force password guessing very slowly, thanks to the multi-phase detection approach used by SSHCure. Although such tactics are possible, they are atypical for dictionary attacks. Die-off phase Attacks can only progress to the die-off phase after passing through the bruteforce phase. The die-off phase will again be identified using the PPF metric, which will change significantly on transition from the brute-force phase. We identify die-off traffic when its characteristics differ from the brute-force phase. In particular, we concentrate on the values P P F < 8 ∨ P P F > 14. Traffic with a P P F < 8 can indicate an idle connection between an attacker and a (compromised) attack victim. On the other hand, traffic with a P P F > 14 can be a sign of a victim being actively used by an attacker. The intrusion detection algorithm, as has been discussed in this subsection, will be the core of our intrusion detection system. The next section will discuss SSHCure’s overall architecture, which includes its other components, such as data visualization and anonymization components.
4
Prototype
In this section we present the developed prototype. SSHCure has been implemented as a plugin for NfSen, an open-source and highly customizable platform for flow monitoring [13]. In the following subsections we describe its architecture and provide an introduction to the user interface and its functionality. 4.1
Architecture
Due to the fact that SSHCure has been implemented as a plugin for NfSen, it consists of a front-end and a back-end. The purpose of the front-end is data visualization, while the back-end is used for flow data processing. Figure 3 depicts the plugin’s architecture. SSHCure builds upon the NfSen internal architecture,
SSHCure back-end NetFlow Data Processor
SSHCure front-end
Database Handler
Database
Database Handler
Graph Generator
NetFlow data
Visualization Processor IP Address Anonymization
NfSen back-end
NfSen front-end
Fig. 3. SSHCure architecture
thus being able to access flow data in 5-minute chunks from the NfSen flow data repository. The NetFlow Data Processor component accesses the data and applies the detection algorithm discussed in Section 3.2 to it. More precisely, data chunks of 5 minutes are divided into chunks of 1 minute, to increase the precision of the algorithm’s metric calculations. To make sure that the original flow data remains unchanged, SSHCure produces new attack meta-data on SSH intrusions, which is stored in a database by the Database Handler. When SSHCure’s front-end is called from a Web browser, attack meta-data is retrieved from the database by the Database Handler. The Visualization Processor is in charge of building a graphical representation of this data, which is presented to the user by means of SSHCure’s Web interface. The Visualization Processor requests graphs from the Graph Generator, which is located in the back-end in order to take advantage of NfSen’s internal graphing functionality. Although SSHCure’s main information source is the attack meta-data, raw flow data and several types of statistics can be accessed from the front-end as well, in order to provide as much information about attacks as possible. Both the raw flow data and the meta-data can be anonymized before visualization. 4.2
User Interface
The SSHCure Web interface allows a user to browse the detected attacks, to obtain all information needed for analysis or administrative purposes. As described above, this information includes both attack meta-data, produced by SSHCure’s detection algorithm, and raw flow data. The Web interface consists of the following pages: the Dashboard page, providing an overview of ongoing and completed attacks; the Attack Details page, providing insights on a specific attack; and the Host Details page, focusing on a single attacker or target host. Dashboard Figure 4 shows a screenshot2 of SSHCure’s Dashboard page, which is the main page of the plugin. The Dashboard page contains the following elements: 2
Note that all IP addresses in this paper are anonymized.
Fig. 4. Screenshot of SSHCure’s Dashboard page
– Time window selector - A user can select the time period for which attacks and statistics regarding frequent attackers and targets will be displayed. All contents of the Dashboard page are subject to this selection; – Attack history graph - This graph shows a history of the number of ongoing attacks during the selected time period; – Attacks listing - This table shows all attacks that occurred during the selected time period, including the IP address of the attacker, the number of targeted hosts, the most advanced phase detected, and whether the attack is still ongoing; – Top attackers listing - This table contains the most prolific attackers during the selected time period. For each of these attackers, the number of involved attacks and targets are shown; – Top targets listing - This table lists the hosts that were targeted most often during the selected time window. It shows the number of times each target was attacked, the number of different attackers that targeted it and the number of times it was compromised.
Attack details The user is able to obtain detailed information about any attack, attacker or target by clicking on its entry on the Dashboard page. When an attack is selected in this way, the user is taken to the Attack Details page. A screenshot of this page, which allows the user to browse through all information relating to a specific attack, is shown in Figure 5. It consists of the following elements:
Fig. 5. Screenshot of SSHCure’s Attack Details page
– Basic information table - This shows the general information about the attack: start and end times, attacker IP address, detected attack phases and the totals of flows, packets and bytes associated with the attack; – Attack profile graph - This graph shows a plot of all flows coming from the attacker, laid out by target IP over time. This plot emulates the IP time series generated by Sperotto et al. (see Figure 1(b)), and is used to analyze the profile of the attack; – Target list - This table contains all hosts targeted by the attack, along with the phases each of them was involved in. Clicking on an entry shows the flows between that target and the attacker in the Flow listing; – Flow listing - This table lists all flows between the attacker and a selected target captured during the attack, sorted by start time. For each flow, the start and end times, flags, number of packets and bytes, and the direction (whether it was initiated by the attacker or by the target). This listing enables the user to do a detailed investigation and analysis of the events during the attack. Finally, we aim at extending the user interface with a Host Details page, which would present detailed information about an attacker or target, such as reverse DNS and geolocation data, together with an overview of the attacks in which the selected host has played a role. Such an extension is currently under development.
5
Validation
To validate the proposed detection algorithm, we utilized two data sets. The first set, which was also used in [8], was captured at the UT in 2008 and consists of one week of flow data. The second data set is comparable to the fist one (one week of data captured in the UT network), but it has been captured in February 2012. The aim of our validation was to investigate whether the proposed algorithm is able to identify attacks and classify them according to the attack phases discussed before. Both data sets were analyzed manually to establish a ground truth for validation, with each incident being classified according to the phases found to have occurred. The detection algorithm was then run on the data sets and the reported incidents were cross-referenced with the manual analysis. The results are listed in Table 1. This table lists, most importantly, the number of true positives (incidents from the ground truth classified correctly by the algorithm), false negatives (incidents not classified correctly) and false positives (non-incidents classified as attacks by the algorithm). By manual inspection, we identified 29 attacks in the data set of 2008 and 101 incidents in the data set of 2012. According to our algorithm, 17 attacks progressed to the brute-force phase, and only 16 to the die-off phase. Similarly, we have 58 incidents labeled as brute-force attacks in 2012, of which 25 reached the die-off phase. Several remarks can be made regarding these results. Firstly, there were no false positives at all, so all the reported incidents were actual attacks. Secondly, only two false negatives were identified. Closer inspection of both of these cases revealed that this was due to the the chosen threshold values in the algorithm. Since the algorithm averages PPF values of flow records over a time interval of one minute, the scanning phase detection was distorted by unexpected intermediate traffic, which resulted in an artificially high PPF value. When the scanning phase’s PPF value was then finally measured, the threshold for the minimum number of flow records was no longer satisfied. These issues are therefore both due to the choice of limits and thresholds, not the nature of the algorithm itself. Our validation confirms that the algorithm conforms to the analysis presented in Section 3.1 and that it is still valid for use in today’s networks. It is important to note that attacks measured to have reached the die-off phase indicate that hosts were most likely compromised. The number of attacks measured during the comparatively brief measuring periods that were classified as such, serves as an affirmation of the need for a network-wide intrusion detection system. Table 1. Validation results 2008 2012 Data set Incidents (scanning phase) 29 101 Incidents (brute-force phase) 17 58 Incidents (die-off phase) 16 25 True positives 28 100 False negatives 1 1 False positives 0 0
6
Conclusions
In this paper, we presented an intrusion detection system (IDS) plugin for NfSen, named SSHCure, which is able to detect SSH intrusion attempts and compromised hosts using flow data. These attacks consist of three phases: a scanning phase, a brute-force phase and a die-off phase, based on the analysis in [8]. Our algorithm utilizes a set of rules for identifying attacks and profiling them according to these phases, based on metrics such as packets-per-flow (PPF) and the number of flow records per minute. The upper/lower limit values for these metrics were established based on measurements on the UT campus network in 2011. Validation of the proposed detection algorithm has shown that SSH intrusion attacks and compromised hosts are identified accurately and that the number of false positives and false negatives is low. This can be concluded from a ground truth validation using the data set used in an earlier work, and from manual ground truth validation using data collected in 2012 on the UT campus network. As future work we plan to investigate the effects of packet sampling on the accuracy of our algorithm. Depending on the sizes of SSH attacks, the used metrics for detecting the various attack phases may need adaption to the applied sampling ratio. In addition, we plan to extend the algorithm to explicitly target distributed SSH dictionary attacks. In its current state, distributed attacks appear as a set of individual attacks in the algorithm’s results, without further aggregation.
Acknowledgments The presented work is supported by the EU FP7-257513 UniverSelf Collaborative Project and the SURFnet GigaPort3 Project for Next-Generation Networks.
References 1. International Telecommunication Union (ITU): ICT Facts and Statistics. http://www.itu.int/ITU-D/ict/facts/2011/material/ICTFactsFigures2011.pdf (2011) Accessed on March 29, 2012. 2. Snort. http://www.snort.org/ (2010) Accessed on March 29, 2012. 3. Koch, R., Rodosek, G.D.: Security System for Encrypted Environments (S2E2). In: RAID. Volume 6307 of Lecture Notes in Computer Science., Springer (2010) 505–507 4. Claise, B.: Cisco Systems NetFlow Services Export Version 9. RFC 3954 (Informational) (October 2004) 5. Sadasivan, G., Brownlee, N., Claise, B., Quittek, J.: Architecture for IP Flow Information Export. RFC 5470 (Informational) (March 2009) 6. Quittek, J., Zseby, T., Claise, B., Zander, S.: Requirements for IP Flow Information Export (IPFIX). RFC 3917 (Informational) (October 2004) 7. Sperotto, A., Schaffrath, G., Sadre, R., Morariu, C., Pras, A., Stiller, B.: An Overview of IP Flow-Based Intrusion Detection. IEEE Communications Surveys Tutorials 12(3) (2010) 343–356
8. Sperotto, A., Sadre, R., de Boer, P.T., Pras, A.: Hidden Markov Model modeling of SSH brute-force attacks. In: Proceedings of the 20th IFIP/IEEE International Workshop on Distributed Systems: Operations and Management (DSOM 2009). Volume 5841 of Lecture Notes in Computer Science., Springer (2009) 164–176 9. Sperotto, A.: Flow-Based Intrusion Detection. PhD thesis, University of Twente (October 2010) 10. Kim, M.S., Kong, H.J., Hong, S.C., Chung, S.H., Hong, J.: A Flow-based Method for Abnormal Network Traffic Detection. In: Proceedings of IEEE/IFIP Network Operations and Management Symposium (NOMS 2004). (April 2004) 599–612 11. Vykopal, J., Plesnik, T., Minarik, P.: Network-Based Dictionary Attack Detection. In: Proceedings of the 2009 International Conference on Future Networks. (2009) 23–27 12. M¨ unz, G., Carle, G.: Real-time Analysis of Flow Data for Network Attack Detection. In: Proceedings of the 10th IFIP/IEEE International Symposium on Integrated Network Management (IM 2007). (2007) 100–108 13. NfSen. http://nfsen.sourceforge.net/ (2011) Accessed on March 29, 2012. 14. SURFmap. http://surfmap.sourceforge.net/ (2012) Accessed on March 29, 2012. 15. Hofstede, R., Fioreze, T.: SURFmap: A Network Monitoring Tool Based on the Google Maps API. In: Application Session Proceedings of the 11th IFIP/IEEE International Symposium on Integrated Network Management (IM 2009). (2009) 676–690