Mol Gen Genomics (2006) 276:436–449 DOI 10.1007/s00438-006-0153-5
O RI G I NAL PAPE R
SSR mining in coVee tree EST databases: potential use of EST–SSRs as markers for the CoVea genus Valérie Poncet · Myriam Rondeau · Christine Tranchant · Anne Cayrel · Serge Hamon · Alexandre de Kochko · Perla Hamon
Received: 22 February 2006 / Accepted: 15 July 2006 / Published online: 19 August 2006 © Springer-Verlag 2006
Abstract Expressed sequence tags (ESTs) from CoVea canephora leaves and fruits were used to search for types and frequencies of simple sequence repeats (EST–SSRs) with a motif length of 1–6 bp. From a non-redundant (NR) EST set of 5,534 potential unigenes, 6.8% SSR-containing sequences were identiWed, with an average density of one SSR every 7.73 kb of EST sequences. Trinucleotide repeats were found to be the most abundant (34.34%), followed by di(25.75%) and hexa-nucleotide (22.04%) motifs. The development of unique genic SSR markers was optimized by a computational approach which allowed us to eliminate redundancy in the original EST set and also to test the speciWcity of each pair of designed primers. Twenty-Wve EST–SSRs were developed and used to evaluate cross-species transferability in the CoVea genus. The orthology was supported by the amplicon sequence similarity and the ampliWcation patterns. The >94% identity of Xanking sequences revealed high sequence conservation across the CoVea genus. A high level of polymorphic loci was obtained regardless of the species considered (from 75% for C. liberica to 86% for C. canephora). Moreover, the polymorphism revealed by EST–SSR was similar to that exposed by genomic SSR. It is concluded that CoVea ESTs are a valuable resource for microsatellite mining. EST-SSR markers developed from C. canephora sequences can V. Poncet (&) · M. Rondeau · C. Tranchant · A. Cayrel · S. Hamon · A. de Kochko · P. Hamon UMR 1097 Diversité et Génomes des Plantes Cultivées (DGPC), IRD, Institut de Recherche pour le Développement, 911 avenue Agropolis, BP 64501, 34394 Montpellier Cedex 5, France e-mail:
[email protected] URL: http://www.dgpc.org/index.html
123
be easily transferred to other CoVea species for which very little molecular information is available. They constitute a set of conserved orthologous markers, which would be ideal for assessing genetic diversity in coVee trees as well as for cross-referencing transcribed sequences in comparative genomics studies. Keywords SSR mining · EST–SSR · CoVea · Transferability · Genetic variation
Introduction Microsatellite markers derived from anonymous genomic sequences have been extensively used over the last decade because of their highly interesting properties (Ellegren 2004). These generally co-dominant and locus-speciWc markers have revealed high polymorphism levels. Good transferability between species and sometimes between genera has often been reported (Dirlewanger et al. 2002; Rallo et al. 2003; GonzalezMartinez et al. 2004; Poncet et al. 2004). These features have proven to be of great interest for genetic diversity studies, genetic and comparative mapping (Wu and Tanksley 1993; Gonzalo et al. 2005; Saha et al. 2005; Vigouroux et al. 2005). However, despite these advantages, they often correspond to non-coding sequences and thus cannot help in seeking candidate genes. Expressed sequence tags (ESTs) are sequenced portions of complementary DNA copies of mRNA—they represent part of the transcribed portion of the genome in given conditions. As expected, they mainly correspond to relatively conserved sequences. Techniques have been developed to reveal polymorphism associated with such sequences (Cato et al. 2001), and studies
Mol Gen Genomics (2006) 276:436–449
based on intron polymorphism (less conserved genic regions) have also been carried out (Lem and Lallemand 2003). However, EST sequence analyses revealed approximately 1.5–7.5% of sequences containing microsatellite motifs in cereals (Kantety et al. 2002; Thiel et al. 2003). Among dicotyledonous species, the frequency of ESTs containing SSRs was found to range from 2.65 to 16.82% (Kumpatla and Mukhopadhyay 2005). Therefore, regardless of the plant considered, an ever-increasing number of EST sequences provides a complementary source for microsatellite marker identiWcation. Although the conserved nature of coding sequences may limit their polymorphism, it should facilitate cross-ampliWcation of loci among phylogenetically related species (Scott et al. 2000) and even genera. Moreover, they have a high probability of being associated with functional portions of the genome. Among their many applications, these ESTderived markers (EST–SSR) can be used to cross-reference genes between species for enhancing the resolution in comparative genomics studies and identifying conserved genomic regions among species and genera (Brown et al. 2001; Decroocq et al. 2003; Gupta et al. 2003; Saha et al. 2004; Yu et al. 2004; Park et al. 2005; Varshney et al. 2005b). In the CoVea genus, SSR markers have recently become more available through the construction of enriched genomic microsatellite libraries (Rovelli et al. 2000; Dufour et al. 2001; Baruah et al. 2003). Microsatellite markers were further evaluated for ampliWcation among CoVea species (Baruah et al. 2003; Moncada and McCouch 2004; Poncet et al. 2004). Good crossspecies transferability and high genetic diversity were generally observed. However, only a handful of linkage maps have been constructed, including these markers (Lashermes et al. 2001; Coulibaly et al. 2003; N’Diaye et al. 2006). These maps were mainly constructed using AFLP markers but their relevance for coVee tree breeding programs is limited. Moreover, current CoVea maps derived from diVerent CoVea species hardly ever share an adequate number of common (anchor) markers to be able to bridge maps. Public accessibility to CoVea EST databases is limited to an SSH library of 527 non-redundant (NR) EST sequences associated with reactions to the rust fungus (Fernandez et al. 2004). These resources were very recently enhanced by the generation of 13,175 unigenes from C. canephora (Lin et al. 2005). Only nine EST–SSR markers have been developed to date (Bhat et al. 2005). We recently developed two C. canephora EST sequence sets in our laboratory from cDNA isolated from leaves and fruits at diVerent development and
437
maturation stages (total of 10,420 sequences, unpublished data). The Wrst objective of the present study was to identify and characterize microsatellites present in the NR set of our ESTs to evaluate its potential as a source for marker development. The second aim was to develop a set of highly polymorphic markers that could cross-amplify and distinguish between CoVea species. Here we report the development of EST–SSR markers based on C. canephora sequences and their crossspecies transferability to six CoVea species. Locus orthology was monitored by analyzing ampliWcation patterns and by sequencing some amplicons. Relevant information about the mutation model and the evolution of these loci was also noted. Polymorphisms detected within and between a set of CoVea species was also analyzed to assess whether these markers could be useful for diversity studies and distinguishing between CoVea species. We identiWed a set of anchor markers, most of them within genes of functional relevance, which would be helpful for functional and comparative mapping within the CoVea genus.
Materials and methods Plant DNA CoVee trees were maintained in a tropical greenhouse at the IRD research center in Montpellier (France). Total DNA from fully developed leaves was extracted according to Ky et al. (2000). Seven species (C. canephora Pierre, known as Robusta (CAN), C. eugenioides Moore (EUG), C. heterocalyx StoVelen (HET), C. liberica Portères (LIB), C. dewevrei Portères (DEW), C. sp. Moloundou (MOL), and C. pseudozanguebariae Bridson (PSE)) representing the three African main geographical clades (Lashermes et al. 1997) were analyzed. Polymorphism was assessed in 12 CAN, 10 DEW, 10 PSE and 8 LIB, representative of the genetic diversity of the four species, plus 2 EUG, 2 MOL, and the only known HET individual. Data mining for SSR markers The coVee EST databases used in this project were developed in our laboratory (de Kochko et al., unpublished data). They contained 10,420 sequences derived from fruit (5,814 sequences) and leaf (4,606) cDNA libraries (valid sequences submitted to GenBank under accession numbers EE191792–EE200565). The raw chromatograms were processed using ESTdb software
123
438
Mol Gen Genomics (2006) 276:436–449
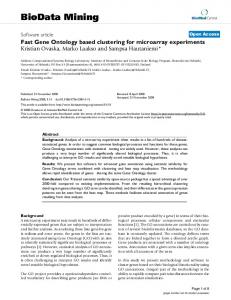
(http://www.mpl.ird.fr/bioinfo/). ESTdb is a set of analytical procedures that automatically verify, cleanse, store and analyze ESTs generated in our laboratory. ESTdb has three major components: (1) a pipeline analysis program based on public software integrated by an in-house developed script, (2) the results and related information are stored in a relational database accessible through (3) a web interface (Fig. 1). The functions of the EST sequences were predicted through similarity searches from protein sequence GenBank databases (http://www.ncbi.nlm.nih.gov) using BLASTx (Altschul et al. 1997). Potential unigenes (contigs and singletons from all EST sequences processed simultaneously) were identiWed after clustering for a NR EST set. These unigene sequences were screened for the presence of perfect and imperfect microsatellites using SSRpipeline, a Perl script developed by DubreuilTranchant (SSRpipeline is publicly available at http:// www.mpl.ird.fr/bioinfo/). This program integrated three Fig. 1 Flowchart of the clustering and annotation of ESTs via the IRD pipeline ESTdb, data mining of SSR-containing ESTs and primer design for a non-redundant SSR set
public software packages: (1) a Perl program developed by Cartingour (http://www.gramene.org) which detects perfect microsatellites, (2) Repeat Tandem Finder, an SSR repeat Wnder (http://www.tandem.bu.edu), and (3) Primer3, a PCR primer design program (Rozen and Skaletsky 2000). Moreover, this program allowed us to check the speciWcity of primer pairs by blasting against the EST sequences. This tool screened each sequence for SSRs. The parameters were set for detection of mono-, di-, tri-, tetra-, penta-, and hexanucleotide motifs with a minimum of 15, 9, 6, 5, 4, and 3 repeats, respectively. The major primer design parameters were set as follows: primer length from 18 to 21 bp (optimum 20), PCR product size from 100 to 300 bp, optimum annealing temperature 60°C. A set of 25 EST–SSR primers was further analyzed (sequences submitted to GenBank under accession numbers DQ778713–DQ778737). They were selected based on the feature of the sequence: we kept in priority
Coffea canephora Chromatograms files
ESTdb software (IRD)
Pre-processing of chromatograms Phred (Ewing, 1998) Vecscreen (NCBI) Matcher (EMBOSS) Trimmed ESTs Web interfaces
Elimination of redundancy stackPACK (Sanbi) Unigenes
Putative gene function via Similarity searches BLASTX (NCBI)
ORF search getORF (EMBOSS)
ESTdb database
EXPORT
Pipeline analysis program
Unigenes SSR pipeline (IRD) Microsatellite search tandem repeat finder
Primer design Primer3 (Whitehead Institute)
Selection of specific primers via alignment Blast
123
Position, type, number of SSR repeats Putative gene function ORF position Flanking primers Annealing temperatures Expected product size
Mol Gen Genomics (2006) 276:436–449
singleton ESTs. Every forward primer was 5⬘-tailed with the M13 sequence 5⬘-CACGACGTTGTAAAA CGAC-3⬘. The primers were synthesized by MWGBiotech AG (Ebersberg, Germany). Polymerase chain reaction (PCR) ampliWcation and visualisation of amplicons Polymerase chain reaction ampliWcations were carried out as described in Coulibaly et al. (2003) and Poncet et al. (2004) using a touchdown PCR proWle optimised for each set of primers: touchdown 60–55°C or touchdown 55–50°C. PCR products were detected on an IR2 Automated DNA Sequencer (LI-COR, model 4200L2, Lincoln, NE, USA) using an M13 primer coupled to the infrared tag IRD700 or IRD800 and after migration on 25 cm 6.5% KBplus (LI-COR, CAT# 82705607) polyacrylamide gels. The gel images were processed by SAGA GT™ software (LICOR Biotech) to estimate the size of amplicons according to a 50–350 bp size standard (LICOR, CAT# 829-05343, 829-05344).
439
information content (PIC), null allele frequency (rb) and heterozygote deWciency or excess (Fis) were calculated for each locus and for the four species represented by more than Wve genotypes, as indicated in Poncet et al. (2004), using PowerMarker (Liu and Muse 2005). For each species, polymorphic loci at 0.05 threshold frequency and mean allele number per polymorphic locus were evaluated.
Results EST unigene sets A total of 9,820 (94%) valid ESTs were obtained from all CoVea canephora chromatogram Wles. The average length was 602 bp. After clustering and assembly, 5,534 unigenes were identiWed, including 3,747 singletons and 1,787 contigs. The BLAST results revealed that about 22.3% of these NR ESTs showed no similarity to any GenBank sequences. Less than 0.03% of the ESTs was predicted to be from plastid cDNA.
Microsatellite cloning and sequencing
Frequency and distribution of C. canephora EST–SSR
Genomic DNAs were ampliWed with the appropriate forward and reverse primers but without the infrared Xuorescent M13. The products were puriWed using EZNA Cycle-Pure (OMEGA Bio-Tek, Doraville, GA, USA) and cloned onto the pCR®4-Topo plasmid using the TOPO TA cloning kit (Invitrogen, Groningen, The Netherlands) according to the manufacturer’s instructions. Cloning eYciency was checked through PCR ampliWcation of several colonies. The resulting products were run on polyacrylamide gels, with the initial genomic DNA ampliWcation outcome as control. The resolution used at this step was especially important to distinguish the two alleles from heterozygous individuals. After plasmid DNA puriWcation (Sambrook et al. 1989), the cloned PCR fragments were sequenced by MWG-Biotech (http://www.mwg-biotech.com/html/all/ index.php). The sequence data have been submitted to GenBank under accession numbers DQ787368– DQ787384. Sequences were edited and analyzed using the DNASTAR software package (Lasergene, Madison, WI, USA).
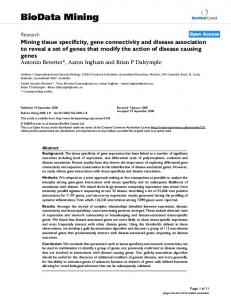
EST–SSRs were mined from a NR EST set of 5,534 potential unigenes. According to the search criteria adopted, 431 unique SSRs were found within a total of 376 unigenes. The chance of Wnding an SSR-containing sequence in the NR EST database was thus 6.8%, with an average density of one microsatellite every 7.73 kb. Tri-nucleotide motifs were the most abundant (34.34%), followed by di- (25.75%), and hexa-nucleotide repeats (22.04%) (Fig. 2). The most abundant trinucleotide repeat motif was AGG/TCC (23%), followed by AAG/TTC (20.3%) and AAC/TTG and AAT/TTA were the least abundant motifs (3.4% each) (Fig. 2). Among the di-nucleotide motifs, GA/CT was the most abundant (62.2%) and no GC/CG motif was found. For all repeat classes, the mean SSR length was 20.6 bp, but was higher for dinucleotides (24.1 bp), with a maximum of 94 bp. Out of the 25 EST–SSRs used for designing primers, nine were found in translated regions, eight in the 5⬘ untranslated terminal region (5⬘ UTR) and four in the 3⬘ UTR. The four other sequences generated no hits in the similarity search (Table 1).
Data analysis
Conservation of orthologous SSR loci among CoVea species
Number of alleles, observed heterozygosity (Ho), gene diversity (or expected heterozygosity, He), polymorphism
To assess the conservation of C. canephora microsatellite loci across CoVea species, we tested the
123
440
Mol Gen Genomics (2006) 276:436–449
a
60% 50%
% of SSR
40% 30% 20% 10% 0%
4
5
6
12.30% 25.75% 34.34%
2.32%
3.25%
22.04%
rice
8.81%
11.85% 56.13%
3.46%
4.61%
15.14%
soybean
12.79% 29.37% 31.19%
2.23%
1.49%
22.94%
Coffee
1
2
3
Repeat motif (bp)
b
90% 80% 70% 60% 50% 40% 30% 20% 10% 0%
GA
AT
AC
CG
ATC
ACG
ACT
CCG
AAC
AAT
Coffee
62.2% 22.5% 15.3% 0.0% 23.0% 20.3% 15.5% 12.2% 6.8%
6.1%
5.4%
4.1%
3.4%
3.4%
rice
79.2% 15.9% 4.9%
1.0%
soybean 64.6% 33.7% 1.7%
AGG
AAG
0.0% 19.8% 9.4% 0.0%
AGC
ACC
8.2%
5.1%
0.9%
4.8%
0.6% 49.7% 0.4%
7.3% 34.2% 5.8%
9.2%
8.9%
7.0%
4.3%
7.9%
0.7% 14.6%
Fig. 2 SSR frequency in the unigene CoVea canephora EST set (rice and soybean data from Gao et al. 2003) a according to the repeat motif length, b according to the motif of di- and trinucleotide repeats
cross-ampliWcation of 25 primer pairs on seven species representing three diVerent CoVea phylogenetic clades. Out of 25, 24 primer pairs ampliWed at least one species (only ES21 could not) (Table 2). Two microsatellites (ES3, ES15) did not amplify well, and the ampliWed products were substantially larger than expected. Finally, cross-species transferability within the CoVea genus was very high since each primer pair yielded a PCR product in an average of 6.1 species (out of seven tested) and 14 (56%) gave ampliWcation with all tested CoVea species. One or two bands per genotype were observed in all but one of the readable ampliWcation patterns obtained, suggesting that there was selective ampliWcation of one locus. The ES11 primer pair ampliWed 3–6 products with some C. liberica genotypes, indicating a possible
123
triplicate sequence—this was considered as missing data for the subsequent analyses. Given that primers were designed on the basis of C. canephora EST sequences, amplicons produced from C. canephora genomic DNA had the expected size in most cases (Table 2), consistent with locus-speciWc ampliWcation. In all other CoVea species, the allele sizes also did not substantially diVer from the expected size, which was consistent with selective orthologous ampliWcation. The microsatellite allele size distributions, expressed in base pairs, Wtted the stepwise model in most cases (Table 2)—with allelic diVerences, which are multiples of the repeat motif even if some intermediate allelic states were missing. Some “jumps” in allele size distribution, associated with mixed distribution patterns, might be attributed to the additional
(CT)14 (TTC)24 (CCA)2(CCT)11 (TCA)18 (TC)26 (TTC)10 (ACC)11/(TCC)6 (TTC)10 (AAT)4(CAG)13 (AG)16
(CCA)5/(CCA)10 (CT)12 (TA)15 (TG)16 (GGATCA)5 (CA)13(TA)6 (AAC)9
(T)28 (TTTTTTC)4
(AG)16 (TCTCC)7 (CCT)9
ES14 ES15 ES16 ES17 ES18 ES19 ES20
ES21 ES22
ES23 ES24 ES25 230 224 207
254 207
289 308 186 300 202 259 197
337 309 228 298 323 205 403 240 156 235
ORF (P)
3⬘ UTR 3⬘ UTR
AAG45420
AAO33591. P25317
AAF01534 AAD42941 AAC62396 CAG18177 AAM67530 AAQ14193 AAO45753
AAB84350 AAD55726 AAP40485 AAN28269 AAM54033 AAW28999
5’ UTR 5⬘ UTR ORF (T/S) 5⬘ UTR ORF(Q) 5⬘ UTR ORF (T) 5⬘ UTR 3⬘ UTR 5⬘ UTR ORF (SG) ORF (TH) ORF (N)
CAA64545 AAL65125 AAN71762
3⬘ UTR ORF (S) 5⬘ UTR
CAB75429
5⬘ UTR
ES4 ES5 ES6 ES7 ES8 ES9 ES10 ES11 ES12 ES13
AAD02552
ORF (Q)
308 349 371
(GCA)8 (A)14(CA)19 (TTTCT)9
ES1 ES2 ES3
Chlamydomonas reinhardtii
Arachis hypogaea Nicotiana tabacum
Arabidopsis thaliana Catharanthus roseus Ricinus communis Arabidopsis thaliana Arabidopsis thaliana Solanum tuberosum Cucumis melo
Arabidopsis thaliana Vitis riparia Arabidopsis thaliana Gossypium hirsutum Populus tremula Antirrhinum majus
Nicotiana plumbaginifolia Hordeum vulgare Glycine max Solanum tuberosum
Petunia hybrida
Species
GenBank accession No.
SSR position
Repeat motif
Locus
Expected ampliWcon size (bp)
Homologous sequences
CoVea EST–SSR
6e¡10
7e¡50 7e¡50
1e¡53 2e¡26 2e¡54 1e¡74 1e¡64 2e¡62 1e¡51
3e¡31 7e¡74 7e-47 1e¡63 8e¡69 3e¡44
4e¡21 2e¡31 1e¡41
1e¡41
2e¡06
BLAST E value
33
65 65
56 81 72 83 58 67 57
72 75 56 94 67 53
73 66 75
90
64
Identity (%)
PGPS (P-glycoprotein) No hit Oligouridylate binding protein Xylose isomerase GT-2 transcription factor Cinnamoyl CoA reductase 2 No hit Heat shock transcription factor Galactinol synthase AP2 domain transcription factor myb-Like transcription factor PIN1-like auxin transport protein 1-Deoxy-D-xylulose-5-phosphate synthase Protein kinase Ubiquitin-conjugating enzyme E2 Cysteine endopeptidase precursor UDP-galactose transporter Unknown protein Calcium homeostasis regulator RING/C3HC4/PHD zinc Wnger protein Early light induced protein glutathione S-transferase (auxin-regulated protein) No hit No hit Vegetative cell wall protein gp1
Putative function
Table 1 Expressed sequence tag (EST), putative gene function based on tBLASTx search of GenBank sequences (analysis on December 2005), SSR position in the cDNA sequence (corresponding repeated amino acid when translated)
Mol Gen Genomics (2006) 276:436–449 441
123
Expected size (bp)
327
368
390
356
328
247
317
251
224
422
259
175
254
308
327 205
319 221
278
216
273 226
249
EST–SSR
123
ES1
ES2
ES3
ES4
ES5
ES6
ES7
ES8
ES9
ES10
ES11
ES12
ES13
ES14
ES15 ES16
ES17 ES18
ES19
ES20
ES21 ES22
ES23
180–222 11 »640 218–222 2 256–284 9 204–219 4 – 213–232 6 236–262 8
318–327 3 356–371 6 >2,000 – 344–372 8 309–315 3 256 1 300–324 10 236–248 5 204–230 6 395–415 7 246–266 8 160–178 5 235–255 10 297 1
CAN (12)
206–212 4 »640 212 1 250 1 212 1 – – – 238–240 2
306–318 4 356–363 4 >2,000 – 338–396 8 291–306 5 238–268 4 302–315 6 246–258 4 210–218 3 392–420 5 240–269 6 169–178 3 237–241 2 291–297 3
DEW (10)
195–212 2 »640 206–218 2 250–252 2 215–229 7 – – – 240–270 12
306–321 2 342–356 3 >2,000 – 338–362 5 300–309 4 244–259 3 288–290 2 222–234 3 214 1 404 1 254–260 2 151–166 2 233–237 2 294–297 2
PSE (10)
Allele size rangea (bp)/allele no.
306–318 3 342–358 4 >2,000 – 346–372 6 297–315 4 256–298 4 288–307 6 236–258 5 204–214 4 389–404 5 240–266 9 169–178 4 233–241 2 291–294 2 Non scorable 207–236 8 »640 212–218 2 244 1 209–212 2 – 213–220 2 236–260 5
LIB (8)
– – »640 206 1 252 1 212 1 – – – 246 1
318 1 342 1 >2,000 – 350 1 294 1 238–256 2 307 1 228 1 – – – – 246 1 154 1 237 1 297 1
HET (1)
196–198 2 »640 206 1 252 1 212–219 2 – 230 1 236 1
318 2 346 1 >2,000 – 362–368 3 291–294 2 238–256 3 288–302 3 226–234 2 215 1 – – 234 2 160–163 2 239–241 2 – –
EUG (2)
196 1 »640 206–218 1 242 1 212 1 – – – 244–246 2
327 1 349 1 >2,000 – – – 300 1 262–259 2 332 1 224 1 – – – – 243–263 2 169 1 – – 297 1
MOL (2)
16
6
11 0
13
4
17
3
12
9
14
11
9
13
19
9
9
15
10
7
Total no of alleles
Stepwise
– Mixed
Mixed
Stepwise
Stepwise
– Mixed
Stepwise
Stepwise
Stepwise
Nearly stepwise
Nearly stepwise
Nearly stepwise
Stepwise
Nearly continuous
Mixed
Stepwise
Mixed
–
Stepwise
Stepwise
Type of allele size distribution
Table 2 Number and molecular size ranges of 25 EST–SSR tested on eight CoVea species: C. canephora CAN, C. dewevrei DEW, C. pseudozanguebariae PSE, C. liberica LIB, C. heterocalyx HET, C. eugenioides EUG, and C. sp. Moloundou MOL (sample size given in brackets)
442 Mol Gen Genomics (2006) 276:436–449
443
242 1 230 1 17 18 1.1
235 1 239 1 19 33 1.7
230 1 – – 15 18 1.2
7
6 21 220 10.5
Mixed
Stepwise
contribution of insertions/deletions (indels) in the ampliWed region. This pattern was observed between species at the ES16 locus. However, some substantial allele size diVerences were observed with three primer pairs (ES3, ES15 and ES17), with amplicons much larger than expected, irrespective of the species. For instance, the observed allele size for ES17 was about 640 bp for all species versus 319 bp expected. Products obtained by ampliWcation with ES2, ES4, ES6, ES16, ES17, ES19, and ES25 primer pairs were cloned and sequenced to conWrm the orthology. They were also analyzed to identify the origin of within- and between-species polymorphism as well as discrepancies between the observed and expected allele sizes (Table 3). The genotypes chosen for cloning presented allele sizes at the extremes of the distribution of a given marker. The relative sequence sizes were in agreement with the sizes evaluated after migration, with a mean SAGA software underestimation of ¡6.72 bp. The genomic DNA sequences clariWed three main points: (1) there was strong sequence homology all along the regions Xanking the repeat motif between amplicons derived from diVerent species (mean 96.9% identity), in agreement with the ampliWcation of orthologous loci; (2) the observed polymorphism mainly resulted from variations in repeat number, although some more complex mutation patterns (ES6, ES16) were also detected, involving additional variation of indels in the Xanking sequences; (3) the large size of ES17 genomic fragments was due to ampliWcation of a 426 bp intron in all species, although the polymorphism still resulted from a diVerent number of repeats
ES11 locus not included (multilocus marker in LIB)
Within- and between-species polymorphism
c
b
a
No. markers Total allele no. Average allele no. Polymorphic loci b Average allele no./polymorphic loci
226 ES25
M13 tail included in the size Polymorphic loci at the 5% level for sample size equal or over Wve individuals
225–235 2 218–221 2 20c 73c 3.7c 15c 4.1c 230–240 3 230–239 2 20 62 3.1 16 3.5 225–230 2 218–221 2 20 70 3.5 16 4.1 243 ES24
228–247 4 224–227 2 21 119 5.7 18 6.4
PSE (10) DEW (10) CAN (12)
Expected size (bp) EST–SSR
Table 2 continued
Allele size rangea (bp)/allele no.
LIB (8)
HET (1)
EUG (2)
MOL (2)
Total no of alleles
Type of allele size distribution
Mol Gen Genomics (2006) 276:436–449
The number and molecular size ranges of alleles obtained with each EST-SSR are shown in Table 2 together with the number of polymorphic loci. One locus appeared to be monomorphic for C. liberica (ES19), two for C. canephora (ES6, ES14) and C. pseudozanguebariae (ES9, ES10), and three for C. dewevrei (ES18, ES19, ES20). For the remaining loci, up to 12 alleles per locus were recorded (ES23 ampliWcation in C. pseudozanguebariae). For the three species represented by one (C. heterocalyx), two (C. sp. Moloundou) or three (C. eugenioides) genotypes, 18 alleles at 17 and 15 loci were detected for C. heterocalyx and C. sp. Moloundou, respectively, while 33 alleles at 19 loci were observed for C. eugenioides. When considering markers with di-, tri-, and more microsatellite repeated motifs, the average number of alleles detected per locus was 14.3 (86 alleles, 6 loci), 9.7 (107 alleles, 11 loci) and 5.7 (17 alleles, 3 loci),
123
444
Mol Gen Genomics (2006) 276:436–449
Table 3 Allele sequence analyses at seven microsatellite loci for diVerent species genotypes (homozygotes or heterozygotes) relative to the C. canephora EST sequence (ESTdb): total length, Locus
CoVea species
Individual
ES2
CAN PSE CAN
ESTdb P-8056 C-IF182
CAN DEW
ESTdb D 5765
CAN PSE
ESTdb P-55
LIB
L-A12
CAN CAN
ESTdb C-IF72
ES4 ES6
ES16
ES17 ES19
ES25
microsatellite repeat stretches, introns, indels (insertions/deletions), and % similarity of the Xanking sequences
Clone no.
Size (bp)
Polymorphism
Percentage similarity of Xanking sequences
ES2-11 ES2-21 ES2-22
349 341 357 351
(A)14(CA)19 (A)14(CA)15 (A)18(CA)21 (A)18(CA)18
100 97.3 98.0 98.3
ES4-15
337 349
(CT)14 (CT)20
100 97.4
ES6-12 ES6-11 ES6-25 ES6-26
228 227 220 255 247
(CCA)2(CCT)11 (CCA)3(CCT)8 (CCA)3(CCT)6 (CCA)4(CCT)10 + 20 bp (CCA)2(CCT)10
100 95.5 95.5 93.9 95.5
186 199 165 206
(TA)15 (TA)21 (TA)4 (TA)17 + 17 bp
100 96.1 95.9 95.5
LIB
L-A22
ES16-12 ES16-25 ES16-15
CAN PSE
ESTdb P60
ES17-10
300 718
(TG)16 (TG)10 + intron 426 pb
100 97.9
CAN CAN
ESTdb C-IF461
LIB
L-A11
ES19-15 ES19-16 ES19-26
260 266 246 233
(CA)13(TA)6(T)2 (CA)10(TA)11(T)4 (CA)2(TA)7(T)9 (CA)1(TA)0(T)9
100 98.6 98.2 99.1
CAN DEW PSE
ESTdb D-5462 P-1
ES25-11 ES25-24
207 200 219
(CCT)9 (CCT)6 (CCT)13
100 98.3 96.0
CAN C. canephora, DEW C. dewevrei, PSE C. pseudozanguebariae, LIB C. liberica
respectively. When considering the location of the microsatellite motif in relation with the gene annotation, an average of 8.1 (73/9), 12.7 (11/3), and 11.4 (57/ 5) alleles per locus were obtained for ORF, 3⬘UTR and 5⬘UTR locations, respectively. Clearly readable loci were analyzed to evaluate genetic diversity parameters, while taking into account only single-locus markers which gave an ampliWcation with more than Wve genotypes per species, between 16 (C. liberica) to 21 (C. canephora) (Table 4). A high level of polymorphic loci was observed whatever the species considered (from 75% (C. liberica) to 86% (C. canephora)). The mean allele number per polymorphic locus was highest for C. canephora (6.4) while lower but similar values were obtained for C. dewevrei, C. liberica, and C. pseudozanguebariae (4.1, 4.1, and 3.5, respectively). The observed heterozygosity was lowest for C. pseudozanguebariae (0.28) and highest for C. liberica and C. canephora (0.52 and 0.51, respectively). The PIC value ranged from 0 (monomorph locus) to 0.91 (ES23 for C. pseudozanguebariae, highly polymorphic locus) across the four species, with the lowest average value obtained for C. pseudozanguebariae (0.40) and similar average values for C. canephora and C. liberica
123
(0.59 and 0.57). There was no signiWcant correlation between interspeciWc PIC values except for the C. liberica/C. dewevrei combination (0.78; P = 0.003). Although variations between loci were observed, a global heterozygote deWcit (Fis = 0.10–0.26) and the presence of null alleles (rb = 0.03–0.09) could be estimated for all species. The lowest values were obtained for C. canephora and C. liberica, while the highest were obtained for C. dewevrei and C. pseudozanguebariae. Diagnostic alleles and locus identiWcation Allele sizes identiWed for the cultivated species C. canephora (CAN) were compared to the others. DEW/PSE species comparison was also considered since this couple was involved in the Wrst interspeciWc map (Ky et al. 2000). From 4 to 16 loci could be identiWed as diagnostic markers, i.e. markers for which there were no shared alleles between species (Table 4). The smallest number of such loci was obtained for the CAN/ LIB comparison and the greatest for CAN/MOL. Moreover, within these markers, some were characterized by a non-overlapping allele size distribution for both species: four for CAN/PSE, seven for CAN/HET,
Null allele frequency (rb)
0.17 0.92 0.77 0.17 0 0.92 0.77 0.77 0.25 0.85 0.83 0.77 0 0.92 0.1 0.62 0.1 0.77 0.46 0.38 0.2 0.51
0.75 0.6 0.78 0.33 0.2 0.5 0.4 0.25 0.4 0.6 0.22 0.2 0 0.75 0 NA 0 – 0.5 0.13 0.38 0.37
NA 0.3 0.5 0.43 0.1 0.3 0.22 NA NA 0.3 0.1 0.5 0.11 0 0.375 0 0.89 – 0.78 0.33 0.33 0.28
0.43 0.83 1 0.83 0.33 0.5 0.57 0.33 0.33 trip 0.83 0.17 0.5 0.83 0.2 0 0.33 NA NA NA NA 0.52
0 0 0 0 1/1 0 0 – – 0 0 0 0 – 0 0 0 – 0 0 0
1/2 0 2/3 0 1/2 1/3 1/2 0/1 – 1/2 1/2 3/3 – 1/2 2/3 1/2 0 0 0 0/1 0/1
0 0 – 0 2/2 0 0 – – 1/2 0 – 0 0/1 0 0 0/1 – 1/2 0/1 –
0.41 0.78 0.74 0.64 0 0.86 0.74 0.75 0.78 0.7 0.68 0.75 0 0.88 0.1 0.83 0.51 0.72 0.84 0.38 0.32 0.59
0.73 0.47 0.84 0.58 0.51 0.55 0.73 0.59 0.72 0.73 0.63 0.48 0.46 0.62 0 NA 0 – 0.38 0.12 0.43 0.50
NA 0.47 0.75 0.58 0.19 0.5 0.2 NA NA 0.46 0.1 0.46 0.11 0.28 0.43 0.41 0.76 – 0.91 0.29 0.28 0.40
0.52 0.65 0.81 0.64 0.69 0.78 0.71 0.65 0.78 trip 0.65 0.38 0.38 0.85 0.18 0 0.44 NA NA NA NA 0.57
0.17 ¡0.08 ¡0.02 0.29 0 ¡0.04 ¡0.02 ¡0.01 0.3 ¡0.09 ¡0.09 ¡0.01 0 ¡0.03 0 0.12 ¡0.07 ¡0.03 0.2 0 0.09 0.03 ¡0.01 ¡0.09 0.07 0.16 0.21 0.03 0.19 0.22 0.18 0.08 0.25 0.19 0.32 ¡0.08 0 NA 0 – ¡0.09 ¡0.01 0.04 0.09
NA 0.11 0.14 0.1 0.07 0.13 ¡0.01 NA NA 0.11 0 ¡0.03 NA 0.22 0.04 0.29 ¡0.07 – 0.07 ¡0.03 ¡0.04 0.06
0.06 ¡0.11 ¡0.11 ¡0.12 0.21 0.16 0.08 0.19 0.25 trip ¡0.11 0.15 ¡0.09 0.01 ¡0.02 0 0.08 NA NA NA NA 0.04
LIB 0.59 ¡0.19 ¡0.04 0.74 NA* ¡0.08 ¡0.04 ¡0.03 0.68 ¡0.21 ¡0.23 ¡0.03 NA* ¡0.05 ¡0.05 0.25 ¡0.2 ¡0.07 0.45 ¡0.01 0.38 0.10 ¡0.02 ¡0.29 0.16 0.43 0.61 0.09 0.45 0.58 0.44 0.18 0.65 0.58 1 ¡0.22 NA* NA NA* – ¡0.33 ¡0.07 0.13 0.26
NA 0.35 0.33 0.26 0.46 0.39 ¡0.08 NA NA 0.34 ¡0.05 ¡0.1 NA* 1 0.12 1 ¡0.17 – 0.14 ¡0.15 ¡0.2 0.23
CAN DEW PSE
Fis
0.18 ¡0.28 ¡0.24 ¡0.3 0.52 0.36 0.2 0.49 0.57 trip ¡0.28 0.56 ¡0.33 0.02 ¡0.11 NA* 0.25 NA NA NA NA 0.11 Total
LIB
++
++
++ *
*
+ ++ ++
+ *
++ * ++ ++ ++ ++ * *
CM
++
+
++
+ ++ ++
PD
+ + + ++ ++ ++ ++ * ++ 9 + 1* 8 + 4* 4+ 8 + 2* 10 + 6* 7+
*
* +
* ++ ++
+ ++
++
+
++ + * ++
++
++
++ * *
++
CL CE
++
CH
+ ++ ++ + +
CP
Diagnostic loci species combination
Diagnostic loci: with no overlapping allelic range between species of each couple NA not applicable (less than Wve individuals analysed or division by zero), – indicates no ampliWcation, trip denotes triplicated locus, ++ indicates no overlapping allele size distributions, + indicates no common alleles between the two species, * indicates no ampliWcation with the non-CAN species, C: C. canephora, P: C. pseudozanguebariae, H: C. heterocalyx, E: C. eugenioides, M: C. sp. Moloundou, D: C. dewevrei, L: C. liberica
ES1 ES2 ES4 ES5 ES6 ES7 ES8 ES9 ES10 ES11 ES12 ES13 ES14 ES16 ES18 ES19 ES20 ES22 ES23 ES24 ES25 Average
PIC
CAN DEW PSE LIB HET EUG MOL CAN DEW PSE LIB CAN DEW PSE
EST–SSR He obs
Table 4 Diversity statistics for 21 EST–SSR in CoVea species as described by the expected (He) and observed (Ho) heterozygosities, the polymorphism information content (PIC), null allele frequency (rb), and heterozygote deWciency or excess (Fis)
Mol Gen Genomics (2006) 276:436–449 445
123
446
three for CAN/LIB, six for CAN/EUG, seven for CAN/ MOL, and Wve for PSE/DEW comparisons.
Discussion ESTs are a rich source of SSRs in CoVea A total of 431 unique SSRs were identiWed from 5,534 potential unigenes. These results clearly demonstrated that CoVea ESTs are a valuable resource for mining SSR markers. Random sequencing within cDNA libraries leads to a high proportion of redundant ESTs. In our study, redundancy was eliminated prior to analysis in order to reduce the dataset size. The advantage of using NR ESTs is to avoid overestimation of the EST–SSR frequency. For example, after redundancy elimination, Kumpatla and Mukhopadhyay (2005) observed 37.3% loss in the number of SSR–EST for Arabidopsis thaliana. For coVee trees, we found that 6.8% potential unigenes contained microsatellite motifs, with an average of one microsatellite every 7.73 kb of EST sequence. This SSR–EST frequency was in the 2.65–10.62% range obtained by Kumpatla and Mukhopadhyay (2005) for dicot species. It was slightly higher than the 1.5–4.7% range reported by Kantety et al. (2002) for monocots. The overall frequency and the frequency of the diVerent repeat motifs are known to be dependent on the presence or not of redundancy, but also related to the criteria used to identify SSR in the database mining. In general, when the minimum repeat length is 20 bp, microsatellites of various plant species are present in about 5% of ESTs (Varshney et al. 2005a). Our results were somewhat in agreement with this estimation although our overall SSR–EST frequency might have been inXated by the detection of hexanucleodide repeat motifs in the analysis, a factor that is seldom considered in other studies (see below). In C. canephora ESTs, trinucleotide repeats were found to be the most abundant (34.34%), followed by di- (25.75%) and hexa-nucleotide motifs (22.04%). Trinucleotide repeats are generally the most common motif found in both monocots (54–78 % among cereals, Varshney et al. 2005a) and dicots (for example 51.5% in Medicago truncatula, Eujayl et al. 2004). Only one report (Kumpatla and Mukhopadhyay 2005) has described the prevalence of dinucleotide repeats in most of the dicots investigated. However, they suggested that their result might have been due to the over-representation of untranslated regions (UTRs) compared with open reading frames (ORFs). Indeed, because of the absence of frameshift mutations when there are length
123
Mol Gen Genomics (2006) 276:436–449
variations in tri- and hexanucleotide repeats, these motifs are found in excess in both coding and noncoding sequences, but other repeat types are much less frequent in coding regions than in UTRs (Metzgar et al. 2000). Our results conWrmed this distribution (Table 1): 7/9 microsatellites found in coding sequences were trinucleotide repeats and one was an hexanucleotide repeat, whereas microsatellites in UTR were mainly dinucleotide repeats (6/12) and trinucleotide repeats (3/12). As most microsatellite libraries used for marker development are generally enriched in di-, tri- and tetra-nucleotide repeats, computational mining of EST databases mainly involves these types of motifs (Kantety et al. 2002; Morgante et al. 2002; Eujayl et al. 2004; Pinto et al. 2004; La Rota et al. 2005). However, a nonnegligible abundance of mono- and hexanucleotide SSRs was observed in our study, i.e. 12.30 and 22.04%, respectively (Fig. 2). These data were in close agreement with those of Gao (2003), and supported the results obtained by Kumpatla and Mukhopadhyay (2005) and Morgante et al. (2002) on the abundance of mononucleotide SSRs. Moreover, when considering CoVea microsatellites with mono- to hexanucleotide repeats, their relative distribution matched that noted in soybean (Gao et al. 2003; Fig. 2). The GA/CT motif was the most abundant dinucleotide motif (62.2%) in our CoVea ESTs. These motifs were also the most frequently observed SSRs in plants (Scott et al. 2000; Gao et al. 2003; Thiel et al. 2003; Saha et al. 2004). The most abundant tri-nucleotide repeat motif detected in the present study was AGG/TCC (23%), closely followed by AAG/TTC (20.3%). These results are in agreement with other reports on dicot species (Scott et al. 2000; Eujayl et al. 2004; Kumpatla and Mukhopadhyay 2005). The rare CCG/GGC frequency compared with rice (Fig. 2) conWrmed the general trends noted in monocots, i.e. they have more CG-rich trinucleotide repeats than dicots (Morgante et al. 2002). Ortholog ampliWcation and cross-species transferability Our computational strategy to detect NR SSRs and develop unique EST–SSR markers appeared eYcient since nearly all the markers appeared to be single locus speciWc. The use of a set of NR sequences was important for the development of unique genic SSR markers. The speciWcity of the designed primer pairs was then checked by blasting against the EST sequences. However, the presence of paralogs (sequences derived from duplication events) together with orthologs (sequences derived from a common ancestor), might still be possible and
Mol Gen Genomics (2006) 276:436–449
the source of diYculties in interpreting betweenspecies comparisons. The >94% identity of amplicon sequences in SSR Xanking regions and the maintenance of repeat motifs conWrmed the cross-species sequence conservation and the primer speciWcity. Finally, the orthology was further conWrmed by an analysis of ampliWcation patterns (size and number of ampliWcation products). Cross-species transferability within the CoVea genus was very high since each primer pair yielded a PCR product in an average of 6.1 species (out of seven tested) and 14 (56%) gave ampliWcation with all the tested CoVea species, regardless of the phylogenetic relationships. This is an important feature of genic SSR markers, which are transferable among distantly related species or even genera (Decroocq et al. 2003; Liewlaksaneeyanawin et al. 2004; Varshney et al. 2005b; Sethy et al. 2006). Compared to previous results based on genomic microsatellites (Poncet et al. 2004), EST–SSR appeared to be more transportable markers (62.5–92 vs. 61.7%). Similarly, the transferability of EST–SSR markers from Pinus taeda (loblolly pine) to P. contorta ssp. latifolia was total, while it was only less than a third for non-EST derived microsatellite markers (Liewlaksaneeyanawin et al. 2004). EST–SSR polymorphism A high level of polymorphic loci was noted whatever the species considered. Although the conserved nature of EST–SSR promoted transferability, it could also have limited polymorphism. This has been suggested in several reports where the level of EST–SSR polymorphism was lower than that with SSR derived from genomic libraries (Cho et al. 2000; Eujayl et al. 2001; Gupta et al. 2003). However, some recent studies reported high levels of polymorphism with EST–SRR markers (Eujayl et al. 2004; Fraser et al. 2004; Saha et al. 2004), with cases where EST–SSR markers were associated with equivalent or even higher levels of polymorphism than genomic SSR (e.g. Liewlaksaneeyanawin et al. 2004; Varshney et al. 2005a). Our results on seven CoVea species also supported these observations. Three to 19 alleles per polymorphic locus were recorded among the set of species tested. This range is larger than that reported by Bhat et al. (2005)—7–13 alleles detected using nine EST–SSR—although a wider spectrum of species was tested (14 CoVea and four Psilanthus). Interestingly, it is also larger than that noted by Poncet et al. (2004), with around 60 genomic microsatellites analyzed on four CoVea species (2 to 9 alleles). A comparison of genetic parameters estimated from this previous study (Poncet et al. 2004) and the
447
present results could be illustrated with two examples. First, the cultivated species C. canephora displayed higher values with EST–SSR than with genomic microsatellites, i.e. mean allele number per locus (5.7 vs. 3.6), observed heterozygosity (0.51 vs. 0.38) and PIC (0.59 vs. 0.48). Secondly, comparable values for these three parameters and for the mean Fis value were obtained for C. pseudozanguebariae independently of the type of SSR marker. A comparison of genetic parameters obtained for each species illustrated that EST–SSR markers were ideal for assessing genetic diversity in coVee trees. For example, C. pseudozanguebariae appeared to be less polymorphic than C. canephora when both genomic microsatellite and EST–SSR markers were used and less polymorphic than C. dewevrei and C. liberica when using EST–SSR markers. This observation is in agreement with the more restricted geographical distribution of C. pseudozanguebariae. When considering the two related species C. liberica and C. dewevrei, they diVerentiated earlier when using morphological traits, molecular markers (AFLP) and male fertility of F1 hybrids (N’Diaye et al. 2005). The C. dewevrei individuals analyzed in the present study were formerly cultivated genotypes collected in the Central African Republic. The C. liberica sample corresponded to a mix of geographic origins comprising cultivated and wild forms. Under these conditions, it was not surprising to observe higher levels of PIC and heterozygosity associated with lower Fis values, and a null allele frequency (rb). Another important feature of our EST–SSRs was their eYciency in distinguishing individuals from pairs of related species. 40 to 52% diagnostic loci were identiWed when the Wve interspeciWc combinations (CAN/ EUG, CAN/HET, CAN/LIB, CAN/PSE and PSE/ DEW) were considered. Finally, our results demonstrated that: (1) C. canephora EST–SSR markers can be easily transferred to wild CoVea species for which no information is available on their DNA sequences; (2) they are good candidates for the development of conserved orthologous markers for genetic analysis across CoVea species. This high degree of transferability between species will facilitate comparative mapping and homologous gene cloning. Acknowledgments This work was partly supported by EU grant No. ICA4-CT-2001-10068. The authors wish to thank I. Mougenot, C. Fizames, B. Piegu, A. Wissocq, F. Lechauve, F. Moreews, X. Argout, F. Chevalier, and many Genetrop researchers for their involvement in the development of ESTdb, and M. Lorieux for his help in developing the SSR script (http://www.mpl.ird.fr/bioinfo/). Thank to Dr. Santiago C.González-Martínez for his valuable comments on the manuscript.
123
448
References Altschul SF, Madden TL, SchaVer AA, Zhang J, Zhang Z, Miller W, Lipman DJ (1997) Gapped BLAST and PSI-BLAST: a new generation of protein database search programs. Nucleic Acids Res 25:3389–3402 Baruah A, Naik P, Hendre S, Rajkumar R, Rajendrakumar P, Aggarwal RK (2003) Isolation and characterization of nine microsatellite markers from CoVea arabica L., showing wide cross-species ampliWcations. Mol Ecol Notes 3:647–650 Bhat PR, Krishnakumar V, Hendre PS, Rajendrakumar P, Varshney RK, Aggarwal RK (2005) IdentiWcation and characterization of expressed sequence tags-derived simple sequence repeats, markers from robusta coVee variety ‘CxR’ (an interspeciWc hybrid of CoVea canephora £ CoVea congensis). Mol Ecol Notes 5:80–83 Brown GR, Kadel EE III, Bassoni DL, Kiehne KL, Temesgen B, van Buijtenen JP, Sewell MM, Marshall KA, Neale DB (2001) Anchored reference loci in loblolly pine (Pinus taeda L.) for integrating pine genomics. Genetics 159:799–809 Cato SA, Gardner RC, Kent J, Richardson TE (2001) A rapid PCR-based method for genetically mapping ESTs. Theor Appl Genet 102:296–306 Cho YG, Ishii T, Temnykh S, Chen X, Lipovich L, McCouch SR, Park WD, Ayres N, Cartinhour S (2000) Diversity of microsatellites derived from genomic libraries and GenBank sequences in rice (Oryza sativa L.). Theor Appl Genet 100:713–722 Coulibaly I, Revol B, Noirot M, Poncet V, Lorieux M, CarascoLacombe C, Minier J, Dufour M, Hamon P (2003) AFLP and SSR polymorphism in a CoVea interspeciWc backcross progeny [(C. heterocalyx £ C. canephora) £ C. canephora]. Theor Appl Genet 107:1148–1155 Decroocq V, Fave MG, Hagen L, Bordenave L, Decroocq S (2003) Development and transferability of apricot and grape EST microsatellite markers across taxa. Theor Appl Genet 106:912–922 Dirlewanger E, Cosson P, Tavaud M, Aranzana J, Poizat C, Zanetto A, Arus P, Laigret F (2002) Development of microsatellite markers in peach [Prunus persica (L.) Batsch] and their use in genetic diversity analysis in peach and sweet cherry (Prunus avium L.). Theor Appl Genet 105:127–138 Dufour M, Hamon P, Noirot M, Ristrerucci AM, Brottier P, Vico V, Leroy T (2001) Potential use of SSR markers for CoVea spp. genetic mapping. In: ASIC (ed) 19th international science colloquium on coVee, Trieste, Italy Ellegren H (2004) Microsatellites: simple sequences with complex evolution. Nat Rev Genet 5:435–445 Eujayl I, Sledge MK, Wang L, May GD, Chekhovskiy K, Zwonitzer JC, Mian MA (2004) Medicago truncatula EST-SSRs reveal cross-species genetic markers for Medicago spp. Theor Appl Genet 108:414–422 Eujayl I, Sorrells M, Baum M, Wolters P, Powell W (2001) Assessment of genotypic variation among cultivated durum wheat based on EST-SSRS and genomic SSRS. Euphytica 119:39–43 Fernandez D, Santos P, Agostini C, Bon MC, Petitot AS, Silva MC, Guerra Guimaraes L, Ribeiro A, Argout X, Nicole M (2004) CoVee (CoVea arabica L.) genes early expressed during infection by the rust fungus (Hemileia vastatrix). Mol Plant Pathol 5:527–536 Fraser LG, Harvey CF, Crowhurst RN, De Silva HN (2004) ESTderived microsatellites from Actinidia species and their potential for mapping. Theor Appl Genet 108:1010–1016 Gao LF, Tang JF, Li HW, Jia JZ (2003) Analysis of microsatellites in major crops assessed by computational and experimental approaches. Mol Breed 12:245–261
123
Mol Gen Genomics (2006) 276:436–449 Gonzalez-Martinez SC, Robledo-Arnuncio JJ, Collada C, Diaz A, Williams CG, Alia R, Cervera MT (2004) Cross-ampliWcation and sequence variation of microsatellite loci in Eurasian hard pines. Theor Appl Genet 109:103–111 Gonzalo MJ, Oliver M, Garcia Mas J, Monfort A, Dolcet Sanjuan R, Katzir N, Arus P, Monforte A (2005) Simple-sequence repeat markers used in merging linkage maps of melon (Cucumis melo L.). Theor Appl Genet 110:802–811 Gupta PK, Rustgi S, Sharma S, Singh R, Kumar N, Balyan HS (2003) Transferable EST-SSR markers for the study of polymorphism and genetic diversity in bread wheat. Mol Genet Genomics 270:315–323 Kantety RV, La Rota M, Matthews DE, Sorrells ME (2002) Data mining for simple sequence repeats in expressed sequence tags from barley, maize, rice, sorghum and wheat. Plant Mol Biol 48:501–510 Kumpatla SP, Mukhopadhyay S (2005) Mining and survey of simple sequence repeats in expressed sequence tags of dicotyledonous species. Genome 48:985–998 Ky CL, Barre P, Lorieux M, Trouslot P, AkaVou S, Louarn J, Charrier A, Hamon S, Noirot M (2000) InterspeciWc genetic linkage map, segregation distortion and genetic conversion in coVee (CoVea sp.). Theor Appl Genet 101:669–676 La Rota M, Kantety RV, Yu JK, Sorrells ME (2005) Nonrandom distribution and frequencies of genomic and EST-derived microsatellite markers in rice, wheat, and barley. BMC Genomics 6:23 Lashermes P, Combes MC, Prakash NS, Trouslot P, Lorieux M, Charrier A (2001) Genetic linkage map of CoVea canephora: eVect of segregation distortion and analysis of recombination rate in male and female meioses. Genome 44:589–596 Lashermes P, Combes MC, Trouslot P, Charrier A (1997) Phylogenetic relationships of coVee-tree species (CoVea L.) as inferred from ITS sequences of nuclear ribosomal DNA. Theor Appl Genet 94:947–955 Lem P, Lallemand J (2003) Grass consensus STS markers: an eYcient approach for detecting polymorphism in Lolium. Theor Appl Genet 107:1113–1122 Liewlaksaneeyanawin C, Ritland CE, El-Kassaby YA, Ritland K (2004) Single-copy, species-transferable microsatellite markers developed from loblolly pine ESTs. Theor Appl Genet 109:361–369 Lin C, Mueller LA, Carthy JM, Crouzillat D, Petiard V, Tanksley SD (2005) CoVee and tomato share common gene repertoires as revealed by deep sequencing of seed and cherry transcripts. Theor Appl Genet 112:114–130 Liu K, Muse SV (2005) PowerMarker: an integrated analysis environment for genetic marker analysis. Bioinformatics 21:2128–2129 Metzgar D, Bytof J, Wills C (2000) Selection against frameshift mutations limits microsatellite expansion in coding DNA. Genome Res 10:72–80 Moncada P, McCouch S (2004) Simple sequence repeat diversity in diploid and tetraploid CoVea species. Genome 47:501–509 Morgante M, Hanafey M, Powell W (2002) Microsatellites are preferentially associated with nonrepetitive DNA in plant genomes. Nat Genet 30:194–200 N’Diaye A, Noirot M, Hamon S, Poncet V (2006) Genetic basis of species diVerentiation between CoVea liberica Hiern and C. canephora Pierre: analysis of an interspeciWc cross. Genet Resour Crop Evol (in press) N’Diaye A, Poncet V, Louarn J, Hamon S, Noirot M (2005) Genetic diVerentiation between CoVea liberica var. liberica and C. liberica var Dewevrei and comparison with C. canephora. Plant Syst Evol 253:95–104
Mol Gen Genomics (2006) 276:436–449 Park YH, Alabady MS, Ulloa M, Sickler B, Wilkins TA, Yu J, Stelly DM, Kohel RJ, el-Shihy OM, Cantrell RG (2005) Genetic mapping of new cotton Wber loci using EST-derived microsatellites in an interspeciWc recombinant inbred line cotton population. Mol Genet Genomics 274:428–441 Pinto LR, Oliveira KM, Ulian EC, Garcia AA, de Souza AP (2004) Survey in the sugarcane expressed sequence tag database (SUCEST) for simple sequence repeats. Genome 47:795–804 Poncet V, Hamon P, Minier J, Carasco-Lacombe C, Hamon S, Noirot M (2004) SSR cross-ampliWcation and variation within coVee trees (CoVea spp.). Genome 47:1071–1081 Rallo P, Tenzer I, Gessler C, Baldoni L, Dorado G, Martin A (2003) Transferability of olive microsatellite loci across the genus Olea. Theor Appl Genet 107:940–946 Rovelli P, Mettulio R, Anthony F, Anzueto F, Lashermes P, Graziosi G (2000) Microsatellites in CoVea arabica L. In: Sera T, Soccol CR, Pandey A, Roussos S (eds) CoVee biotechnology and quality. Kluwer, Netherlands, pp 123–133 Rozen S, Skaletsky HJ (2000) Primer3 on the WWW for general users and for biologist programmers. In: Krawetz S, Misener S (eds) Bioinformatics methods and protocols: methods in molecular biology. Humana Press, Totowa, pp 365–386 Saha MC, Mian MA, Eujayl I, Zwonitzer JC, Wang L, May GD (2004) Tall fescue EST-SSR markers with transferability across several grass species. Theor Appl Genet 109:783–791 Saha MC, Mian R, Zwonitzer JC, Chekhovskiy K, Hopkins AA (2005) An SSR- and AFLP-based genetic linkage map of tall fescue (Festuca arundinacea Schreb.). Theor Appl Genet 110:323–336
449 Sambrook J, Fristch EF, Maniatis T (1989) Molecular cloning–a laboratory manual. Cold Spring Harbor Laboratory edn. Cold Spring Harbor Scott KD, Eggler P, Seaton G, Rossetto M, Ablett EM, Lee LS, Henry RJ (2000) Analysis of SSRs derived from grape ESTs. Theor Appl Genet 100:723–726 Sethy NK, Choudhary S, Shokeen B, Bhatia S (2006) IdentiWcation of microsatellite markers from Cicer reticulatum: molecular variation and phylogenetic analysis. Theor Appl Genet 112:347–357 Thiel T, Michalek W, Varshney RK, Graner A (2003) Exploiting EST databases for the development and characterization of gene-derived SSR-markers in barley (Hordeum vulgare L.). Theor Appl Genet 106:411–422 Varshney RK, Graner A, Sorrells ME (2005a) Genic microsatellite markers in plants: features and applications. Trends Biotechnol 23:48–55 Varshney RK, Sigmund R, Borner A, Korzun V, Stein N, Sorrells ME, Langridge P, Graner A (2005b) InterspeciWc transferability and comparative mapping of barley EST-SSR markers in wheat, rye and rice. Plant Sci 168:195–202 Vigouroux Y, Mitchell S, Matsuoka Y, Hamblin M, Kresovich S, Smith JS, Jaqueth J, Smith OS, Doebley J (2005) An analysis of genetic diversity across the maize genome using microsatellites. Genetics 169:1617–1630 Wu KS, Tanksley SD (1993) Abundance, polymorphism and genetic mapping of microsatellites in rice. Mol Gen Genet 241:225–235 Yu JK, La Rota M, Kantety RV, Sorrells ME (2004) EST derived SSR markers for comparative mapping in wheat and rice. Mol Genet Genomics 271:742–751
123