starting simple – adding value to static visualisation through simple interaction AVI98 paper Alan Dix† and Geoffrey Ellis‡ † School of Computing, Staffordshire University, UK
[email protected] http://www.soc.staffs.ac.uk/~cmtajd/
‡ School of Computing and Mathematics, Huddersfield University, UK
[email protected]
Abstract Interactive visualisation has been one of the most exciting areas in HCI over recent years. The key term here is 'interactive', and in this paper we assert that virtually any static representation can become more powerful by the addition of simple interactive elements. This is demonstrated by adding interactivity to standard representations including stacked histograms, pie charts and scatter plots. We show how adding interactivity can help resolve many of the trade-offs inherent in static visualisations by allowing multiple options to be available and most importantly for them to be interactively related. Many years of creativity and effort have been invested in traditional generic and bespoke visualisations. Adding interactivity leverages this accumulated experience, however it adds an extra dimension. keywords: information visualization, visual interaction, interactive graphics
1
Introduction and background In which we establish that the heart of modern visualisation techniques is interaction and propose that interaction can be applied to any representation however simple.
1.1
Interactive visualisation
Interactive visualisation has been one of the most exciting areas in HCI over recent years. Many examples use three dimensional effects to increase effective screen realestate and give a feeling of engagement. Others use two dimensional representations or even 'plain' textual views of data. These systems often include novel representations to make maximum use of the interactive elements. However, two significant problems arise as a result of this. First, these systems involve substantial creativity and insight on the part of their designers. Is a similar level of insight required for every new interactive visualisation? Because the representations are novel, they may also involve a considerable learning curve before they are of maximum use to the users. Second, there are many years of accumulated experience embedded within traditional static visualisations. Some of these are generic, others developed within particular domains. The latter are particularly problematic. Although it is reasonable to expend considerable effort in developing interactive techniques for visualising generic features such as hierarchies, it may however not be possible to expend the
same effort on more specific domains. In this section, we review some examples of traditional visualisation before looking at some of the many examples of relatively recent interactive visualisation systems: three dimensional, two dimensional and text-based. The key feature is interactivity and we propose that virtually any existing static representation can be made more powerful by adding interactivity. In the rest of the paper we examine this assertion in more detail. Section 2 gives some examples where this general principle can be seen at work in existing systems and subsequently how it can be applied to invent new visualisations. Section 3 considers the reasons why interactivity is such an advantage in guiding its appropriate use. Finally, we look at some of the potential application areas and implementation issues that arise. 1.2
Historical/traditional visualisation
Due to the constraints of media available at the time, early visualisation were predominately paper-based and static, although a 16th century copy of Eular's Elements includes 'pop-up' paper models to demonstrate geometric theorems [Billingsley 1570]. Tables have been used since the earliest civilisations, with examples of Mesopotamian tablets with tables of Cuneiform numbers dating back to 2900BC [Vorderman 1996]. Time-series charts (Figure 1) have been used since the 10th century [Funkhouser 1936] to present data to the audience in a more understandable way but the viewer is always faced with someone's interpretation of the data. This is perhaps more obvious in older pictorial representations including battle friezes, such as the Bayeaux Tapestry, which represent (non-quantified) chronologies of events. Historically, presentations have been generated by artists rather than statisticians and hence a tradition of over embellishment of charts arose where the data was just a vehicle for the artists' talents. On numerous occasions these artistic talents have been used deliberately to distort the interpretation of the data thus misleading the viewer.
Figure 1. 10th Century time line (from Funkhouser 1936)
Some early examples of improving visualisation were the various mechanical models which were built to demonstrate the solar system in motion. In some ways these could be regarded as interactive as the user could progress time by winding a 2
handle and observe the changes in the position of the planets. However it would be difficult to find answers to questions such as: when is the next full eclipse of the sun or when are Jupiter, Mars and Saturn lined up without winding the handle too many times! The advent of computers and graphical display systems have enabled complex mathematical calculations to be processed and the results expressed visually on the screen. With the power of a modest desktop computer it is now possible to give a realistic simulation of flying on a comet through the solar system or even sitting on a space probe negotiating the rings of Saturn! In terms of more traditional data visualisation, this move to computer generated charts has given the ability to choose from a large variety of chart designs, representing 2 or 3 dimensions, all in glorious Technicolor and we have to question whether we are returning to the days of 'artistic' rather than informative charts. According to Tufte [Tufte 1983] embellishment of charts with unnecessary lines and shading, what he calls chartjunk, hinders the users judgmental accuracy. Empirical studies [Kosslyn 1994, Siegrist 1996] show that the benefit from adding three dimensional depth to charts is questionable but most agree that users need more time to evaluate charts with 3D depth. 1.3
Interactive charts and tables
Charts often provide a summary of the data. Where large amounts of data need to be displayed, interaction has been employed. The simplest form of this is the scrolling and panning found in all spreadsheets and word-processors. Most spreadsheets also provide some form of hiding or elision of columns and rows to allow easier comparison of different data series. In addition, some spreadsheets and OLAP include multi-dimensional 'slice and dice'. Furthermore, in TableLens [Rao and Card 1994, Pirolli and Rao 1996] this general idea has been extended by displaying miniature histograms of elided columns and rows. This gives a form of fisheye display and also allows visual comparisons between histograms to detect trends and correlations.
Figure 2. HIBROWSE for Hotels top level
Another example using table views and selection is HIBROWSE [Ellis et al. 1994]. This application provides a searching and browsing interface to a relational database of hotel data for the UK. It features multi-windowed views of different attributes of 3
the data, some aggregated, some hierarchically structured, and it utilises progressive refinement based on direct manipulation of the visualised query results. Figure 2 shows an overall view of the contents of the database. The user is automatically provided with information on the distribution of hotels geographically, by number of rooms and by star rating. The user can refine the view of the data by selecting multiple attributes of interest. The result of a typical query is shown in Figure 3. Further refinement of the query could easily be made by selecting further attributes. Another useful feature is the opportunity for the user to sort the data in each table view; questions such as which company has the most large upmarket hotels in Northern UK can be answered quickly.
Figure 3.
HIBROWSE for Hotels for 3 star AA rating and above with 200 or more bedrooms in North England and Scotland
The HIBROWSE approach has also been successfully applied to other relational and bibliographic databases [Pollitt 1997]. 1.4
2D computer visualisation
A common method of visualising data is through 2D graphs. A major difficulty with presenting large data sets is the inability to see sufficient detail on the screen without loosing the overall context of the data being displayed. The pan and zoom systems employed by most DTP and CAD applications face this shortcoming but the problem is made worse when attempting to correlate multiple attribute data visually. The use of an additional overview window [Beard and Walker 1990] overcomes this problem to some extent, however it forces the viewer to integrate the detailed view with its context mentally. Various systems give a fisheye view, with data of focus shown in detail to the user and data further a field shown progressively in less detail. This can be accomplished either by zooming individual nodes of interest [Schaffer et al. 1996] or by giving a hyperbolic view of the data space [Lamping et al. 1995]. Inherent in 3D visualisations, data further from the users' interest tends to fade into the distance but this gives rise to other problems as discussed in the next section. Another approach to exploring data is demonstrated by VICKI [Dawkes et al. 1996] which uses interactive histograms with colour 'brushing' to show relationships between attributes. Starfield displays [Williamson and Shneiderman 1991, Ahlberg 4
and Shneiderman 1994] on the other hand, make use of scatter plots to visualise large data sets and dynamic filtering to refine the data to areas of interest. An extension to this is the PDQ Tree-browser visualisation tool [Kumar et al. 1997] which offers the user both an overview of the tree structured data and a detailed tree view, with filters which can be applied at each node to prune the information space. While some of the above systems use maps displays, filtering or aggregation, other systems such as Visage [Lucas and Roth 1996] and that proposed by Goldstein [Goldstein and Roth 1994] use a combination of these techniques together with outliners and drill-down to provide the user with a powerful visualisation mechanism. An interesting approach to visualising personal histories is presented as an outliner vs. timeline graph by LifeLines [Plaisant et al. 1996]. It uses colour, line thickness and icons to represent additional information together with dynamic highlighting to show relationships between events. 1.5
3D computer visualisation
Over recent years many novel 3D representations have been developed to visualise large or complex data sets. Some of the earliest uses of 3D were in VR-style scientific visualisation, such as the Virtual Windtunnel [Bryson and Levit 1992]. VR has also been used to view and navigate over 3D surfaces and scatter plots [Benford 1994, Brown et al. 1996]. In 2D and tabular displays, elision and fisheye techniques are needed to reduce detail of material which is not currently of concern. In 3D virtual environments, we get this reduction of detail almost for free as distant material appears smaller. However, the density of data points in many 3D displays necessitates some further elision. For example, the Bead system [Chalmers et al. 1996] has mechanisms which automatically add or remove textual labels depending on the distance and density of objects. This controls the overlapping of labels in order to make them readable. Many systems (not just 3D) also employ some form of drill-down whereby datapoints can be selected and extra information can be revealed [Jern 1997]. The natural effects of distance, shadows and perspective have also been used to represent structured information which could, in principle, be represented in big enough 2D displays. One example of this is the Perspective Wall where a wide 2D display is bent to make part of it salient and the rest fade into the distance. Another example is the way Cone trees and Cam trees represent hierarchical data such as organisation and file trees [Robertson et al 1991]. The part of the tree which is in focus is at the front and less interesting parts are obscured. If a node on the tree is selected then this particular node and its parents are rotated so that the node of interest is at the front and hence unobscured. 1.6
Interaction
As we have seen, many novel computer visualisation techniques have been developed in recent years. Some use sophisticated computation to generate the raw data to be displayed, others make use of 3D effects enabled by advances in graphics. However, the crucial aspect is the fact that they are interactive. Interaction is being used to drill down and zoom in to reveal detailed data, to dynamically make selections from larger data sets and to generate various forms of visually distorted or mathematically aggregated overviews. 5
Clearly 3D displays make use of our abilities to see and reason in the real world, using depth and perspective to enable more complex displays to be grasped and understood. Yet, even 3D displays are ineffective without interaction. As we have noted there is evidence that, however visually appealing, static 3D diagrams are less comprehensible than their 2D counterparts. Our natural abilities to understand 3D space can be utilised effectively when we can explore and move about within that space. VR without interaction is simply computer graphics! Where visualisations do not support full 3D navigation (as is the case with Cam trees), the objects within that space must be interactively spun, moved or otherwise manipulated to reveal their nature. 1.7
Apply interaction to everything?
Although the visualisations we have considered are novel and exciting, this is perhaps also their weakness. As we have seen, there is a huge wealth of experience in the design of static 2D visualisation, both in generic representations (histograms, line graphs etc.) and domain specific representations (e.g. log-normal plots in statistics, hi-lo plots in economics, Nyquist diagrams in control theory). These static representations have been developed over hundreds (and in some cases thousands) of years. Will we have to wait as long for innovative and effective interactive representations to be developed? This sounds depressing, but if interaction is the key to current novel representations, couldn’t interaction also be used in common representations such as simple charts to improve the effectiveness of the data presentation, to aid interpretation and offer the user alternative views. Can we give the user more but keep it simple? Our hypothesis is that this is indeed the case – you can add interactivity to almost any existing static representation and thus make maximum use of millennia of human experience.
2
Adding interaction In which we look at some existing examples such as contour maps, tourist maps and Mac folders and also consider new representations such as dynamic stacked histograms, outliner PIE charts, multi-line graphs and scatter plots.
2.1
The general principle
This section will further examine the hypothesis that, by adding interactivity, we can add value to virtually any representation. We shall look at some examples of existing systems that satisfy this principle and consider how this principle can be used to generate new interactive visualisations from simple 2D representations. 2.2
Existing systems
On the wind-swept sea-front of virtually any British sea-side town interactive tourist maps can be found. Around the edge of the cased map are buttons labelled with features of interest such as 'restaurants', 'pubs', 'churches'. You press the button and on the map one or more lightbulbs are illuminated showing the locations of the features you are interested in. Of course, the same information could be conveyed through the use of different colours and shapes of symbol on a single paper map, 6
however, interactivity has been used to highlight selected information. Folders on the Macintosh can either be displayed spatially using icons, or in largely textual lists (Figure 4). The list views may be sorted by features such as name, size and date. This could be done in any paper-based table. However, the sort order on the electronic folder can be changed by a simple menu selection or by clicking on the appropriate column title.
Figure 4. Macintosh folder sorted by size
Table Lens also exploits simple representations, namely tables and histograms, allowing interactive choice between the dual representations and dynamic sorting by column. In fully tabulated mode this is just like the Mac folder, but when rows are folded down to histogram only, it is possible to visually assess different correlations by sorting on different columns. Another slightly more complex example is contour maps and cross sections. Contour maps make it easy to ask questions like “how high is X above sea level”, and experienced map readers can see that closely packed contour lines represent steep slopes. However, it is hard to work out the exact shape of a particular hill or valley. In climbing and walking guides, and also in geological maps, it is common to have one or two transects drawn on the map, each with a corresponding cross-section. The same technique has been used on computer maps, but the choice of the transect is made interactively, thus allowing the user to explore different parts of the map, rather than relying on those the map-maker has chosen [Jern 1997]. 2.3
Inventing new examples
The systems we have just considered all make use of existing paper representations and often obtain increased utility from small interactive additions. Can we deliberately design new interactive visualisations from standard paper-based representations? stacked histograms Some while ago, one of the authors blithely stated the central hypothesis of this paper in a lecture on visualisation, "of course, you can add interactivity to anything". Having made such an extravagant claim with 80 undergraduate computer scientists, there were only two ways out: retraction or demonstration. On the board was a 7
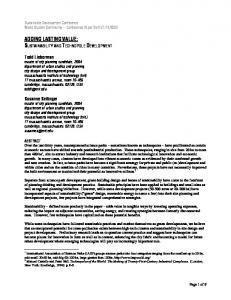
picture of a stacked histogram, from an earlier discussion on choosing appropriate representations. "Let's see what we can do with this". A stacked histogram allows three judgements: (i) the trends on the total height of the columns, (ii) the proportion of each category within each column and (iii) the trends in the lowest category. The trends, or even inter-column comparisons for any other category is very difficult as the blocks are at different heights. We had already discussed this problem, so an interactive modification was obvious. Imagine clicking on one of the categories, or on the key (Figure 5a). star ratings by region 700
lodge 1 star
h o 600 t e 500 l s 400
2 star 3 star 4 star 5 star
300 200 100 0
Figure 5a. Stacked histogram showing the distribution of hotels in the UK by star rating
The columns of the histogram then 'sink' so that the baseline of the chosen category now rests on the axis of each column (Figure 5b). The columns now range up and down from the axes and so judgement (i) is no longer possible, but it is possible to make judgement (iii) about the chosen category and also (we discovered as the altered histogram was re-drawn) about the category below it. star ratings by region 300 h o t e l s
lodge 1 star
200
2 star 3 star 4 star 5 star
100 0 100 200 300 400 500
Figure 5b. An interactive stacked histogram comparing the distribution of 2 star hotels in the UK.
No previous use of this device is know to us (although it is so simple we feel it must have been used somewhere!) but the critical thing is not in the novelty, but in the process. In 30 seconds, by the addition of interactivity, in one fell swoop, a perennial problem with stacked histograms is dissolved.
8
pie charts Of course, it is possible we struck lucky! Some time later, having described the stacked histogram in public, we then (foolishly) agreed to do the same for some other standard representation— pie charts were suggested. Multiple pie charts (e.g. year-by-year data) can be augmented in similar ways to stacked histograms: rotating all the pie charts round so that the same category is at the 12 o'clock position. However, we were challenged with a single pie chart. One problem with pie charts is that there are often many small categories and it is hard to compare groups of categories. For example, if we were looking at proportions of a countries GDP (manufacturing, agriculture, raw materials, etc.), we may have subcategories of manufacturing (cars, consumer goods, high-technology). If we show the sub-categories as pie wedges, it may be difficult to compare all of manufacturing with all of agriculture. If a wide colour palette is available the problem can be solved by using different shades of the same colour. However colours in a chart are often hard to match with the corresponding items in a key. This solution is also impractical for the colour blind.
tourist board areas hotels 3444 33 811 639 10 531 1200 220
region UK Channel Islands Midlands North England Northern Ireland Scotland South England Wales
Figure 6a. An outliner pie chart applied to hotels within regions of the UK
Now consider, representing the pie chart's key in outliner style with sub-categories nested within their superordinate category (Figure 6a). As you fold or unfold a category its subcategories are merged or distinguished on the pie chart (Figure 6b). Again a couple of minutes work produces a simple, but effective solution. tourist board areas hotels 3444 33 811 639 89 7 209 111 223 10 531 1200 220
region UK Channel Islands Midlands North England Cumbria Isle of Man North West Northumbria Yorkshire & Humberside Northern Ireland Scotland South England Wales
Figure 6b. An outliner pie chart expanded to show tourist board areas within North England
9
highlighting – scatter plots, line graphs and train timetables The sea-front tourist map works by simply highlighting selected information. The same principle can be applied to many graphs where there is complex information. For instance, Dynamic HomeFinder [Williamson 1991] uses this principle in displaying scatter plots. As range sliders are manipulated, the points which lie within all the ranges are highlighted. In fact, in many paper scatter plots, the points come from a small number of categories often denoted by different plot symbols (triangle, cross etc.). Simply highlighting the chosen points as you click on the key may be powerful enough for many purposes, and can be achieved using standard tools, such as Microsoft PowerPoint or Macromedia Director by simply swapping between screens. Line graphs have similar problems and can be addressed in the same manner. Often several lines are drawn on the same graph. Where the lines represent dissimilar things (like height and weight over time), they can be suitably scaled so that they do not cross. However, this is not always possible, for example if you plot the daily weights of a group of babies all born on the same day, you will need to use the same scale for comparison, but they will inevitably lie close to one another and cross and recross as the babies have small growth spurts. Again, interactively highlighting a particular baby's growth curve makes it possible to identify one line amongst many, and also to compare it against the overall pattern.
Figure 7. Trains from Paris to Lyon (from Tufte 1983, p.31)
A particular example of this is Marey's graphical train schedule (Figure 7). This shows a timeline for each station and then draws trains as lines between their arrival and departure times at different stations. The direction of trains along the line is evident by whether the line on the chart slopes upwards or downwards, and express trains are clearly visible as steeper lines. Therefore it is possible to look at a particular time and assess the best train to catch, which may not always be the first one. If trains never overtake one another it is easy to follow a single train through multiple stations, but if this were the case, then one would simply have caught the first train anyway. In fact, the worst case is where a train overtakes another within the confines of the same station. If they overtake whilst moving one can follow the 10
straight lines through the crossover point, but if they are both stationary, the lines will temporarily lie parallel to the time axis and overlap. Simply highlighting the selected trains instantly makes the representation more effective. Another example of a train schedule which could benefit greatly from interaction is that once issued by the Java railroad and reproduced by Tufte [1990, p.24]. This has 16 variables plotted on the chart including train times, height of stations, type of train. Making the distinction between the regular super express train and the seasonal night cargo train could be very important to the traveller!
3
Beating the trade-offs In which we see how traditional representations have to make tradeoffs between various factors based on purpose and human visual powers, but that interaction can allow alternative representations and temporal fusion can add an extra dimension.
3.1
Analysis
In the previous section we saw examples of how interaction can re-vitalise traditional representations. Now we shall analyse at a deeper level why interaction improves visualisation. This is important for three main reasons. Firstly, it can help us design new interactive visualisations by focusing on the critical shortcomings of traditional ones. Secondly, it can help us avoid inappropriate interactivity. For instance, in the case of multiple pie charts, simply allowing interactive rotation of each individual chart is probably less helpful than automatic rotation which aligns specific categories. Finally, where multiple interactive techniques are being considered, understanding what each representation achieves may enable one to choose a simpler, cheaper, yet more easily implemented alternative that still does the required job. 3.2
Factors for visualisation
Many factors influence the choice of effective visualisation techniques, including issues such as familiarity and ease of drawing. We will concentrate on three of these factors: visual affordances, objectives and aesthetics. visual affordances Visual representations and interfaces are driven by the capabilities of the eye and the human visual system. At extremes, this limits the volume and the kind of visual data we can process. For example, we would not be able to distinguish two parallel lines a few microns apart, or even see lines in the infra-red part of the spectrum. Interestingly, the limitations of current printing and screen technology implies that these particular problems are not commonly encountered. However, it is not uncommon to find maps where the colours used to denote different heights are such close shades that it is possible to see boundaries, but not match a particular shade on the map with that in the key. In fact, this last example shows an important point; our ability to match colours at a distance is far poorer than our ability to distinguish adjacent colours. Even worse is our ability to name colours. Most people in the UK can manage only about ten colours, with trained artists doing somewhat better. In nature, things are often of 11
similar colour, hence we are able to pick out features in one colour against a background, even if that background is cluttered or of contrasting colours, especially when there is a difference in intensity and saturation. This is precisely the visual ability used when selected objects or lines are highlighted. We can make visual comparisons of length, but only reliably when the lines are parallel, close to one another and are not partially overlapping. This is why stacked histogram can only be used for certain types of comparisons. We also perceive the area of regions, more than their length or width as representing their size. As a result, it is important to ensure that, where different sized circles (or other pictures or shapes) are used to represent a numeric value, the diameter is proportional to the square root of the value so that the area is proportional to the value itself. In addition to these simple comparisons, we have more complex pattern matching capabilities, which enable us, for example, to see trends and to identify clusters. Understanding these visual affordances allows one to analyse what kinds of comparison and pattern extraction are possible and even guide the design of a representation to allow particular comparisons. In 3D, things get more complex depending on the nature of interaction and immersion. This is perhaps why static 3D diagrams pose such problems. It is far from clear whether we interpret the volume, the area we are presented with, or something in between. For example, can we tell from figure 8, how much bigger the 33 ton tower of ice is compared to the 4,340 lb chicken!
Figure 8. Exports by ‘volume’! (from Tufte 1983, p. 73)
objectives, goals and tasks Understanding visual affordances allows us to determine what can be ascertained from a visualisation. However, we also need to know what is required. Therefore the typical objectives of the reader/user have to be taken into account when looking at the representation. In user interface terms, this implies that the goals or tasks of the users must be considered. For instance, if we are only interested in the relative sizes of GDP components in one year then we might use a pie chart, but if we were interested in absolute values over several years, then a stacked histogram may be 12
more appropriate. The same is true of more complex visualisations, for example, Table Lens allows linear or monotonic correlations to be identified, but it would be difficult to identify quadratic or more complex relationships. aesthetics Developers of visualisation techniques are driven not only by utility, but also by aesthetics. Although one may not always agree with the use of colour scheme, it is clear that many are visually engaging, thus inviting experimentation and use. However, aesthetics and utility do not always go together and this is more obvious in various forms of 3D ‘effect’. Examples include text at angles that make it hard or impossible to read, pie charts rendered in perspective so that the relative angles of slices can no longer be judged and even histograms which disappear into the distance so that small bars close to the viewer can appear larger than distant tall ones. 3.3
Trade-offs
The choice of a visual representation is influenced by all the above factors. Typically, one would like to make the representation visually appealing and use visual affordances to reveal the required information and allow the specific comparisons and judgements dictated by the users tasks. aesthetics vs. functionality As we have already noted, there may be a trade-off between aesthetics and functionality. This is not just a problem for information displays, but it also applies to all forms of graphic design. How many times do you see a paper poster, multimedia package or web page where the photographic or otherwise busy background renders the text describing the event or subject unreadable. For advertisements the bias towards aesthetics is reasonable, once you have grabbed the readers attention they may be willing to struggle to read further details. However, for information visualisation it is clear that aesthetics must usually take second place. The trade-off between different aspects of functionality is more difficult. If we have a single goal, for example to compare the values of a single type of data through time, then it is easy to chose a representation – to compare things we need the heights aligned from a common baseline, leading to a standard timeseries graph. More often we have to choose between alternative representations or choose parameters for a given representation. In control theory, a common problem is to describe the way devices modify signals. Where the devices are linear, the device can be completely described (as a black box) by its effect on simple periodic signals (sine waves). For each frequency one can measure the gain (how much the output signal is stronger or weaker than the input) and the phase shift (whether the output signal lags behind the input signal in time). One representation of this is the Bode diagram which simply plots gain and phase as functions of frequency. An alternative representation is the Nyquist diagram. This is more complex as it regards the gain and phase (measured as an angle) as a point in 2D space using polar coordinates. As the input frequency changes, the point draws out a curve. Experts can interpret the curve and tell, for example, whether the device is stable or unstable if the output were connected to the input (yes, this is important 13
in control theory!). Both representations are important for different purposes, but even if both are drawn it is hard to relate the two. The stacked histogram shows a simpler type of trade-off. Only the bottom category is easy to compare between bars. So, in preparing a static stacked histogram one must choose which of the categories to show at the bottom. Comparisons of other categories will then be correspondingly harder. Similarly, when presenting tables, one must choose which column to sort on. Another kind of trade-off occurs when choosing whether to list all the information about every data item, or to use some sort of aggregate representation, such as a scatter plot. The former gives details about specific items, but no overview, the latter allows trends or clusters to be identified. In the same vein, if several different types of data are displayed on the same graph, it makes it easier to compare them and get an overall impression, but harder to examine trends and features of specific types. 3.4
Managing conflict
With static representations we are forced to resolve these trade-offs and where conflicts occur, make a choice. Inevitably this biases the representation towards certain types of task. With interactive representations we can manage these trade-offs dynamically. We still have to choose an overall set of representations, but we can allow the user to move between multiple representations and viewpoints. The interactive stacked histogram in figure 5b is an example of this. Using a single histogram, we can choose the category we wish to compare and move this easily to the baseline. By moving the histograms up and down, we put other categories in this situation, hence partially resolving the trade-off. It is still impossible to simultaneously compare two categories unless they are adjacent, although we could provide additional functionality for the user to alter the order of the categories in the key. The Macintosh folders which can be sorted on different columns is another example where this principle can be applied. The problem of overview vs. detail can be managed by various systems. Many scatter plot systems show progressive detail, either as one gets closer (in the case of 3D visualisations) or as the number of displayed items gets so small that the extra information will not overlap. In the case of graphs showing many simultaneous types of line or point, simple interactive highlighting of selected categories, or hiding of unselected items can allow both overall and type-by-type judgements. Consider the example of control theory representations. This is typical of complex domain specific representations and has previously been identified as amenable to temporal fusion [Dix 1996]. Temporal fusion is a general design principle for interactive visualisation whereby several different information sources are brought together by the use of time, either by animation or interaction. In the case of Nyquist diagrams and Bode diagrams both can be displayed simultaneously and a corresponding point can be shown on each graph. The user can grab either point and then move it along, seeing the corresponding point move on the other graph.
14
4
Kinds of interaction In which we build a taxonomy of different kinds of interactivity during visualisation in order to make it easier to match requirements to techniques.
Let us summarise the different ways in which interactivity adds value and resolves conflicts in representation. Given one or more static representations, we can look at such a list and use it to suggest ways in which interactivity can help. This does not remove the need for creativity, but gives some guidance and suggestions. highlighting and focus The sea-front maps, train timetables and multi-line graphs all benefit from interactively highlighting particular subsets of data. Given the emphasis in this paper, interactive highlighting should supplement various established techniques to allow rapid visual discrimination such as the use of colour, different shapes and Chernoff faces [Chernoff 1973]. Remember that interaction is good, but eye movements and visual recognition are faster still!
accessing extra information – drill down and hyperlinks Certain features of data items will be used in any specific visualisation technique. Rather than trying to represent everything simultaneously, extra information can be revealed, either on demand with drill down or hypertext links, or automatically, as is the case with systems such as Visage [Lucas and Roth 1996] and Bead [Chalmers et al. 1996]. overview and context – zooming and fish-eye views Techniques such as zooming and fish-eye views allow users to see an overview of the data and the details. Although both rely on interaction, fish-eye views including Table Lens’ histograms for example, give context and detail at every moment unlike zooming which requires interaction to see this. These differ from hyperlinks in that with zooming and fish-eye views, the same features are displayed at different resolution whereas with hyperlinks, different facets of the data items are revealed. The term ‘drill down’ is, in fact, used for both categories revealing new facets of data items or, in the case of the interactive pie chart and HIBROWSE, as a type of outliner revealing the same feature in more detail. Note again that best practice from paperbased representations is a good guide, for example maps of the same region often represent the same features in different ways depending on the scale of the map. same representation, changing parameters The sacked histogram shows the power of interactively changing some parameters of a representation (in this case the baseline). Systems such as VICKI and Starfield displays, which change the actual items displayed based on interactive selection, are another example of this principle. 15
same data, changing representation It is common to see systems which allow switching between, say, tables and graphical displays of the same data. Even this simple expedient allows one to escape some of the trade-offs inherent in choice of representation. Again best practice must apply, some representations are inappropriate for certain types of data and each representation needs to be tuned for its purpose. Allowing the user to decide is not an excuse for laziness on the part of the system designer. linking representations – temporal fusion Simply swapping between representations, or even simultaneously representing the same data still leaves the user with the job of determining the relationship between them. Temporal fusion allows multiple representations to be linked using time and interactivity. In Dix [1996] three types of temporal fusion are identified: (i)
Successive images (discrete time multiplexed) Fade in/out between two representations sharing common axes, such as maps of the same area and scale showing different features (e.g. geology vs. topography). The commonality of frame of reference is important, fading between a pie chart and a histogram tells you that the two may be linked, but does not emphasise the nature of the linkage.
(ii)
Moving images (continuous time multiplexed) A good example of this is the interactive sliders used in HomeFinder and VICKI. The user sees a continuously changing image reflecting the interactive choice of selection parameters. Also, this is the important factor in various forms of animated transition. For example, in Cam Trees, as a node is selected the tree rotates to the new position, it is not simply redrawn. Also in the case of multiple pie charts, rotating the charts to a new orientation will give a much better idea of the relationship between the data in successive views.
(iii) Simultaneous change (time connected, space multiplexed) We have already discussed Nyquist and Bode diagrams in this context. The fact that the same change happens to two simultaneously displayed representations allows the user to understand the relationship between them. The interactive cross-section through a contour map is another good example of this. As the transect moves, the user not only sees the cross-section at a particular point, but also sees the relationship between cross-sections and contours. By its nature temporal fusion is about dynamic effects. When applying temporal fusion one can not only utilise best practice in static representations, but also look for dynamic representations as used in television and video materials. In the UK, the Open University uses many dynamic visualisations in its open-learning television programmes, and across the world many documentaries use exciting and informative graphics. These are animated, but not interactive, however they often give useful ideas for interactive versions.
16
5
Applications and technology In which we consider where we want interactive visualisation – different application areas, and how to achieve it – implementation techniques and issues.
Many of the novel interactive visualisation systems are seen as part of bespoke tools where the primary object is ‘visualisation’ of information. However, by adding interactivity to simple representations we can consider many more mundane applications. Most spreadsheets and databases have charting facilities. Currently these produce static representations, but there is no reason why these should not be routinely augmented by interactive features. Although these will not be usable in the printed form, increased use of electronic distribution means that they can be available to others and also used during presentations and demos. This method of interactive charting could be included in standard packages, or as an add-on application linked to spreadsheets by OLE, Active X or similar mechanisms. Electronic publishing and multimedia production can also benefit from straightforward interactive visualisations, not least for distribution on the World Wide Web. Sometimes the data sets are very large requiring server-end processing, but often small amounts of data (possibly derived from larger sets) are all that is required as in the case of the stacked histogram. In such cases, downloaded Java applets can supply more dynamic client-end interactivity. One of the markets for advanced visualisation tools is in the financial services where analysts have to make sense of vast amounts of data from stocks, monetary dealing etc.. On a lesser scale, ordinary management functions require MIS systems to give them an overview of the financial and organisational state of their company. With data warehousing, the interpretation of data and extraction of patterns and trends (data mining) has become a major issue. Simple dynamic additions to the simple representations currently used for paper reports, can make an enormous difference without requiring extensive training or expensive implementation.
6. Conclusions In which we sum up that simple representations can be made more powerful by interaction and that we are generally on to a good thing. The central feature of recent computer visualisation systems is interactivity. This paper has argued that virtually any static visualisation can be made interactive. Interactive visualisations derived from this principle make use of the extensive experience embedded within traditional visualisation; they will be easily understood, being based on well-known representations; and, being simple, they will be relatively easy to implement. We have applied this generic principle to several standard static representations: stacked histograms, pie charts and multi-line plots. In each case, the addition of simple interaction has produced a novel interactive visualisation that adds significant value over the static representation. The paper also examined the reasons why interaction is so powerful to aid visualisation and in particular, how it helps to avoid some of the conflicts inherent in representation choice. In a static representation the available visual affordances have 17
to be used for one purpose or another, but by dynamically changing aspects of the visualisation several tasks can be supported. Understanding these trade-offs is very important in determining appropriate interactive extensions to static representations. To aid this further, the paper categorised different kinds of interaction used in visualisation. Finally, we looked at some of the areas in which these simple visualisation techniques could be used, including bespoke visualisation, electronic publishing, WWW and MIS. Although not a mechanical process, we have shown that novel visualisation techniques can be generated in a systematic fashion based on existing representations. This is particularly important for domain specific visualisations (such as Nyquist diagrams) which have been developed by professionals in the field over many years, and where it would not be cost effective (and probably not desirable) to invent a completely new representation for interactive visualisation. In summary, the most important thing about computer visualisation is interaction and you can add interaction to anything.
References Ahlberg C. and Shneiderman B. (1994) Visual Information Seeking: Tight Coupling of Dynamic Query Filters with Starfield Displays Proc. ACM CHI94, (Boston, April 1994) ACM Press pp313-317 Beard D.V. and Walker J.Q. (1990) Navigational Techniques to Improve the Display of Large Two-dimensional Spaces Behavioural Information Technology vol.9(6) pp451-466 Benford S. (1994) Virtual Environments for Data Sharing and Visualisation - Populated Information Terrains IDS'94 2nd International Workshop on User Interfaces to Databases, (Ambleside, UK, April 1994). Springer Verlag. Workshops in Computer science pp168-182 Billinglsey H. (translator) Euclid, The Elements of Geometrie. London. (partial facimile in Tufte 1990, p.16) Brown C., Benford S. and Snowdon D. (1996) Collaborative Visualization of Large Scale Hypermedia Databases.ERCIM workshop on CSCW and the Web, (Sankt Augustin, Germany), Arbeitspapiere der GMD 984, GMD/FIT. pp115–123 Bryson S. and Levit C. (1992) The virtual windtunnel: a environment for the exploration of three-dimensional unsteady fluid flows. Computer Graphics and Applications. Academic Press, London Chernoff H. (1973) The Use of Faces to Represent Points in a K-Dimensional Space Graphically Journal of the American Statistical Association, Vol. 68, No. 342, 1973, pp361-368 Dawkes H., Tweedie L., Spence R. (1996) VICKI - The VIsualisation Construction KIt AVI'96 Proc. Advanced Visual Interfaces, (Gubbio, Italy, May 1996)
18
Dix A. (1996) Time, space and interaction Proc. of FADIVA 3, Gubbio, Italy, University of Rome. pp99–103 http://www.soc.staffs.ac.uk/~cmtajd/papers/FADIVA/ Ellis G.P., Finlay J.E. and Pollitt A.S. (1994) HIBROWSE for Hotels: bridging the gap between user and system views of a database IDS'94 2nd International Workshop on User Interfaces to Databases, (Ambleside, UK, April 1994) Springer Verlag. Workshops in Computer science, pp45-58 Funkhauser H.G. (1936) A Note on a Tenth Century Graph. Osiris, vol.1 pp 260–262 (diagram reproduced in Tufte 1983, p.28) Goldstein J. and Roth S.F. (1994) Using Aggregation and Dynamic Queries for Exploring Large Data Sets Proc. ACM CHI94, (Boston, April 1994) ACM Press pp23-29 Jern M. (1997) Information Drill-down using Web Tools. http://www.uniras.dk/info/seminars/Drilldown.htm (accessed 26/10/97) Kosslyn S.M. (1994) Elements of Graph Design. Freeman, New York Kumar H.P., Plaisant C. and Shneiderman B. (1997) Browsing Hierarchical Data with Multi-level Dynamic Queries and Pruning Journal of Human-Computer Studies 1997 vol.46 pp103-124 Lamping J. and Rao R. (1995) The Hyperbolic Browser. A Focus+Context Technique for Visualizing Large Hierachies Journal of Visual Languages and Computing, 6(4) Lucas P. and Roth S.F. (1996) Exploring Information with Visage Conference Companion ACM CHI96 (Vancouver, April 1996) ACM Press pp396-397 Pirolli P. and Rao R. (1996) Table Lens as a Tool for Making Sense of Data. Proc. ACM CHI96 (Vancouver, April 1996) ACM Press pp67-80 Plaisant C., Milash B., Rose A., Widoff S. and Shneiderman B. (1996) LifeLines: Visualizing Personal Histories Proc. ACM CHI96 (Vancouver, April 1996) ACM Press pp221-227 Pollitt A.S. (1997) The key role of classification and indexing in view-based searching IFLA '97 (Copenhagen Aug 31 1997) 63rd IFLA General Conference Booklet 4, Section on Classification and Indexing Session 95 Paper 009-CLASS-1-E Rao R. and Card S.K. (1994) The Table lens: Merging graphical and symbolic representations in an interactive focus + context visualization for tabular information Proc. ACM CHI94, (Boston, April 1994) ACM Press, pp318-322 Robertson G.G., MacKinlay J.D., and Card S.K. (1991) Cone Trees: Animated 3D Visualizations of Hierarchical Information Proc.CHI'91 (New Orleans, April 1991) ACM Press, pp189-194 Schaffer D., Zuo Z., Greenberg S., Bartram L., Dill J., Dubs S., and Roseman M. (1996) Navigating Hierarchically Clustered Networks through Fisheye and Full-Zoom Methods Proc. ACM CHI 94 (Boston, April 1994) ACM Press, vol.3, no.2 pp162-188 Siegrist M. (1996) The Use or Misuse of Three-dimensonal Graphs to Represent Lowerdienion Data Behaviour & Information Technology, vol.15 no.2 pp96-100 Tufte E.R. (1983) The Visual Display of Quantative Information Graphics Press, New York 19
Tufte E.R. (1990) Envisioning Information Graphics Press, New York Tweedie L., Spence B., Williams D. and Bhogal R. (1994) The Attribute Explorer Video Proc. CHI'94, (Boston, April 1994) ACM Press Vorderman C. (1996) How Mathematics Works Dorling Kindersley, London Williamson C. and Shneiderman B. (1991) The Dynamic HomeFinder: Evaluating Dynamic Queries in a Real-estate Information Exploration System SIGIR'92 Proc. 15th Annual Int. ACM SIGIR Conf. on Research and Development in Information Retrieval, ACM Press, pp338-346
20


![Adding Value - ACL [PDF]](https://m.moam.info/img/260x300/adding-value-acl-pdf_6479d678098a9e4d6c8b46ad.jpg)