file): http://dss.princeton.edu/training/DataPrep101.pdf. ❑ ..... Math. 10 33.33
66.67. Econ. 10 33.33 33.33. Major. Freq. Percent. Cum. . tab major. Total.
Getting Started in Data Analysis using Stata (v. 6.0)
Oscar Torres-Reyna
[email protected]
December 2007
http://dss.princeton.edu/training/
Stata Tutorial Topics
What is Stata? Stata screen and general description First steps: Setting the working directory (pwd and cd ….) Log file (log using …) Memory allocation (set mem …) Do-files (doedit) Opening/saving a Stata datafile Quick way of finding variables Subsetting (using conditional “if”) Stata color coding system From SPSS/SAS to Stata Example of a dataset in Excel From Excel to Stata (copy-and-paste, *.csv) Describe and summarize Rename Variable labels Adding value labels Creating new variables (generate) Creating new variables from other variables (generate) Recoding variables (recode) Recoding variables using egen Changing values (replace) Indexing (using _n and _N) Creating ids and ids by categories Lags and forward values Countdown and specific values Sorting (ascending and descending order) Deleting variables (drop) Dropping cases (drop if) Extracting characters from regular expressions
Merge Append Merging fuzzy text (reclink) Frequently used Stata commands Exploring data: Frequencies (tab, table) Crosstabulations (with test for associations) Descriptive statistics (tabstat) Examples of frequencies and crosstabulations Three way crosstabs Three way crosstabs (with average of a fourth variable) Creating dummies Graphs Scatterplot Histograms Catplot (for categorical data) Bars (graphing mean values) Data preparation/descriptive statistics(open a different file): http://dss.princeton.edu/training/DataPrep101.pdf Linear Regression (open a different file): http://dss.princeton.edu/training/Regression101.pdf Panel data (fixed/random effects) (open a different file): http://dss.princeton.edu/training/Panel101.pdf Multilevel Analysis (open a different file): http://dss.princeton.edu/training/Multilevel101.pdf Time Series (open a different file): http://dss.princeton.edu/training/TS101.pdf Useful sites (links only) Is my model OK? I can’t read the output of my model!!! Topics in Statistics Recommended books PU/DSS/OTR
What is Stata? • It is a multi-purpose statistical package to help you explore, summarize and analyze datasets. • A dataset is a collection of several pieces of information called variables (usually arranged by columns). A variable can have one or several values (information for one or several cases). • Other statistical packages are SPSS, SAS and R. • Stata is widely used in social science research and the most used statistical software on campus. Features
Stata
SPSS
SAS
R
Learning curve
Steep/gradual
Gradual/flat
Pretty steep
Pretty steep
User interface
Programming/point-and-click
Mostly point-and-click
Programming
Programming
Very strong
Moderate
Very strong
Very strong
Powerful
Powerful
Powerful/versatile
Powerful/versatile
Very good
Very good
Good
Excellent
Affordable (perpetual licenses, renew only when upgrade)
Expensive (but not need to renew until upgrade, long term licenses)
Expensive (yearly renewal)
Open source (free)
Data manipulation Data analysis Graphics Cost
PU/DSS/OTR
Stata’s previous screens
Stata 10 and older
Stata 11
Stata 12/13+ screen
Variables in dataset here
Output here
History of commands, this window
?????
Files will be saved here Write commands here
Property of each variable here PU/DSS/OTR
First steps: Working directory To see your working directory, type pwd . pwd h:\statadata
To change the working directory to avoid typing the whole path when calling or saving files, type: cd c:\mydata . cd c:\mydata c:\mydata
Use quotes if the new directory has blank spaces, for example cd “h:\stata and data” . cd "h:\stata and data" h:\stata and data PU/DSS/OTR
First steps: log file Create a log file, sort of Stata’s built-in tape recorder and where you can: 1) retrieve the output of your work and 2) keep a record of your work. In the command line type: log using mylog.log This will create the file ‘mylog.log’ in your working directory. You can read it using any word processor (notepad, word, etc.). To close a log file type: log close To add more output to an existing log file add the option append, type: log using mylog.log, append To replace a log file add the option replace, type: log using mylog.log, replace Note that the option replace will delete the contents of the previous version of the log. PU/DSS/OTR
First steps: memory allocation Stata 12+ will automatically allocate the necessary memory to open a file. It is recommended to use Stata 64-bit for files bigger than 1 g. If you get the error message “no room to add more observations…”, (usually in older Stata versions, 11 or older) then you need to manually set the memory higher. You can type, for example
set mem 700m Or something higher. If the problem is in variable allocation (default is 5,000 variables), you increase it by typing, for example: set maxvar 10000 To check the initial parameters type query memory
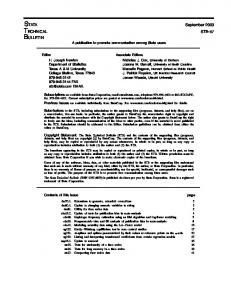
First steps: do-file Do-files are ASCII files that contain of Stata commands to run specific procedures. It is highly recommended to use do-files to store your commands so do you not have to type them again should you need to re-do your work. You can use any word processor and save the file in ASCII format, or you can use Stata’s ‘do-file editor’ with the advantage that you can run the commands from there. Either , in the command window type: doedit Or, click on the icon here:
You can write the commands, to run them select the line(s), and click on the last icon in the do-file window
Check the following site for more info on do-files: http://www.princeton.edu/~otorres/Stata/
First steps: Opening/saving Stata files (*.dta) To open files already in Stata with extension *.dta, run Stata and you can either: • Go to file->open in the menu, or • Type use “c:\mydata\mydatafile.dta” If your working directory is already set to c:\mydata, just type use mydatafile To save a data file from Stata go to file – save as or just type: save, replace If the dataset is new or just imported from other format go to file –> save as or just type: save mydatafile /*Pick a name for your file*/ For ASCII data please see http://dss.princeton.edu/training/DataPrep101.pdf PU/DSS/OTR
PU/DSS/OTR
First steps: Quick way of finding variables (lookfor) You can use the command lookfor to find variables in a dataset, for example you want to see which variables refer to education, type: lookfor educ . lookfor educ variable name educ
storage display type format byte
%10.0g
value label
variable label Education of R.
lookfor will look for the keyword ‘educ’ in the variable name and labels. You will need to be creative with your keyword searches to find the variables you need. It always recommended to use the codebook that comes with the dataset to have a better idea of where things are.
PU/DSS/OTR
PU/DSS/OTR
First steps: Subsetting using conditional ‘if’ Sometimes you may want to get frequencies, crosstabs or run a model just for a particular group (lets say just for females or people younger than certain age). You can do this by using the conditional ‘if’, for example: /*Frequencies of var1 when gender = 1*/ tab var1 if gender==1, column row /*Frequencies of var1 when gender = 1 and age < 33*/ tab var1 if gender==1 & age