analyze and debug diagrammatic, yet precise, descriptions of ... often with explicit timing constraints, that combine to form ... graphics editors, in which one can model certain aspects of reactive systems but in which a user can do little with ... of output reports. .... composition of the SUD into its physical components, called.
STATEMATE:t for the Development D. Harel’*‘, M. Politi,
A Working of Complex
Environment Reactive Systems
H. Lachover, A. Naamad, A. Pnueli’, R. Sherman3 and A. Shtul-Trauring
i-Logix Inc., Burlington, and Ad Cad Ltd.,
Rehovot,
MA 01803 Israel
1. Introduction Reactive systems (see [P, HP]) are characterized as owing much of their complexity to the intricate nature of reactions to discrete occurrences. The computational and continuous parts of such systems are assumed to be dealt with using other means, and it is their reactive, controldriven parts that are considered here to be the most problematic. Examples of reactive systems include most kinds of real-time computer embedded systems, control plants, communication systems, interactive software of varying nature, and even VLSI circuits. Common to all of these is the notion of reactive behavior, whereby the system is not adequately described by a simple relationship that specifies outputs as a function of inputs, but, rather, requires relating outputs to inputs through their allowed combinations in time. Typically, such descriptions involve complex sequences of events, actions, conditions and information flow, often with explicit timing constraints, that combine to form the system’s overall behavior.
Abstract: This paper provides a brief overview of the STATE MATE system, constructed over the past three years by i-Logix Inc., and Ad Cad Ltd. STATEMATE is a graphical working en-
vironment,
r
-
intended for the specification,
documentation
of large and complex
.,
analysis, design and
reactive
systems,
such as
real-time embedded systems, control and communication systems, and interactive software. It enables a user to prepare, analyze and debug diagrammatic, yet precise, descriptions of the system under development from three inter-related points of view, capturing, structure, functionality and behavior. These views are represented by three graphical languages, the most intricate of which is the language of statecharts used to depict reactive behavior over time. In addition to the use of statecharts, the main novelty of STATEMATE is in the fact that it ‘understands’ the entire descriptions perfectly, to the point
of being able to analyze them for crucial dynamic properties, to carry out rigorous animated executions and simulations of the described system, and to create running code automatically. These features are invaluable when it comes to the quality reliability of the final outcome.
and
It is fair to say that the problem of finding good methods to aid in the development of such systems has not been satisfactorily solved. Standard structured design methods do not adequately deal with the dynamics of reactive systems, since they were proposed to deal primarily with nonreactive, data-driven applications, in which a good functional decomposition and data-flow description are sufficient. As to commercially available tools for real-time system design, most are, by and large, but sophisticated graphics editors, in which one can model certain aspects of reactive systems but in which a user can do little with the resulting descriptions beyond testing them for syntactic consistency and completeness and producing various kinds of output reports. These systems are often helpful in organizing a designer’s thoughts and in communicating those thoughts to others, but they are vastly inadequate when it comes to the more difficult task of preparing reliable specifications and designs that satisfy the initial requirements, that behave over time as expected, and from which a reasonable final system can be constructed with relative ease.
Keywords: code generation, computable specifications, functional decomposition, reactive systems, statecharts, STATEMATE.
t STATEMATE
is a registered
trademark
of i-Logix,
Inc.
’ Also with the Department of Applied Mathematics, The Weizmann Institue of Science, Rehovot, Israel 2 This author’s work partially carried out at the Computer Science Department, Carnegie-Mellon University, Pittsburgh, PA. 3 This author’s work partially carried out at the University of Southern California’s Information Sciences Institute, Marina
del-Ray,
If we were to draw an analogy with the discipline of conventional programming, there is an acute need for the reactive system’s analog of a programming environment
CA.
027%5257/88/0000/0396!$01
.OO 0 4 988 IEEE
396 Recommended by: K. Ochimizu and T. Matsubara
of hardware in some systems to the subroutines in the software parts of others.
that comes complete, not only with a programming language, a useful program editor and a syntax checker, but also with a working compiler and/or interpreter with debugging facilities, so that programs can be not only written but also run, tested, debugged and analyzed. As it turns out, the problems confronting a team out to design a reactive system are far more difficult than those confronting a programmer out to write a conventional program. Typical reactive systems are highly concurrent and distributed; they fall quite naturally into multiple levels of detail, and usually display unpredictable, often catastrophic, behavior under unanticipated circumstances. More often than not, the development phases of such systems are laden with misunderstandings between customers, designers and users, as well as among the various members of the design team itself, and their life-cycle is replete with trouble-shooting, modifications and enhancements.
The dominant conceptual decomposition of the SUD is carried out via the functional view, where one identifies a hierarchy of activities, complete with the details of the data items and control signals that flow between them. This is essentially what is often called the functional decomposition of the SUD. However, in the functional view we do not specify dynamics: we do not say when the activities will be activated, whether or not they terminate on their own, and whether they can be carried out in parallel. The same is true of the data-flow: in the functional view we specify only that data can flow, and not whether and when it will. For example, if we have identified that two of the subactivities of an Automatic Teller Machine we are describing are identify-customer and report-balance, and that the data item account-number can flow from the former to the latter, then no more and no less than that is implied; we still
The languages in which reactive systems are specifed ought to be clear and intuitive, and thus amenable to generation, inspection and modification by humans, as well as precise and rigorous, and thus amenable to maintenance, analysis and simulation by computers. Such languages ought to make it possible to move easily, and with sufficient semantic underpinnings, from the initial stages of require- @;-/-ments and specification to prototyping and design, and to form the basis for modifications and maintenance at later stages. One of the underlying principles adopted in this paper is such specifications, the behavioral aspects included, should be based to a large extent on visual formalisms, i.e., on languages that are highly visual in nature, depending on a small number of carefully chosen diagrammatic paradigms, yet which, at the same time, admit a formal semantics that provides each feature, graphical and nongraphical alike, with a precise and unambiguous meaning. For reactive systems this means that it should be possible to prepare intuitive and comprehensible specifications that can be analyzed, simulated and debugged at any stage with the aid of a computerized support system. This paper describes the ideas behind STATEMATE, computerized working environment for the development reactive systems, which adheres to these principles.
and blocks
I I
SUD
/
il
/ / / 1
\,
J/
a of
RUCTURE decomposition & information 0OW
$,,&A
fcI3 2. STATEMATE
at a Glance
Figure
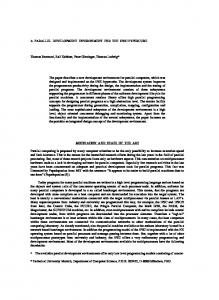
The underlying premise of STATEMATE is the need to specify and analyze the system under development (SUD in the sequel) from three closely related points of view: structural, functional and behavioral. These are illustrated in Figure 1.
1: Three views of the system under description
(SUJJ)
have not specified when that item will flow, how often will it flow, and in response to what, and indeed whether the flow will be initiated by the former activity or requested by the latter. In.other words, the functional view provides the decomposition into activities and the possible flow of information, but it says little about how those activities and their associated inputs and outputs are controlled during the continued behavior of the SUD.
In the structuraI view one provides a hierarchical decomposition of the SUD into its physical components, called modules here, and identifies the information that flows between them; that is, the ‘chunks’ of data and control signals that flow through whatever physical links exist between the The word ‘physical’ should be taken as rather modules. general, with a module being anything from an actual piece
It is the behavioral view, our third, that is responsible for specifying control. This is achieved by allowing a
397
control activity to be present on each level of the activity hierarchy, controlling that particular level. It is these controllers that are responsible for specifying when, how and why things happen as the SUD reacts over time. Among other things, a controlling statechart can start and stop activities, can generate new events, and can change the values of variables. It can also sense whether activities are active or data has flown, and it can respond to events and test the values of variables. These connections between activities and control will be seen in Section 3 to involve a rather elaborate set of events, conditions and actions, whereas the relationship between modules and activities is far simpler, and consists essentially of specifying which modules implement which activities. (Some of our ideas as to the way functionality and control are related, are similar to those appearing independently in (Ht, LK, WI.) For each of these three views, the structural, functional and behavioral, STATEMATE provides a graphical, diagrammatic language, complete with a rule-based graphics editor that checks for syntactic validity as the appropriate specifications are developed. These languages, modulecharts, activity-charts and statecharts, respectively, are all based on a common set of simple graphical conventions (see [H2]) and come complete with formal semantics that are embedded into STATEMATE . They are described in more detail in Section 3.
Figure 2 illustrates the overall structure of STATEMATE. The database is central, and obtains much of its input from the three graphics editors, and also from an editor for a forms language, in which the nongraphical information is specified. Perhaps the most interesting parts of STAT’EMATE are the queries, testing and simulation (i.e., execution) packages, described in Section 4, and the code-generation and protoyping capabilities, described in Section 5. As mentioned, the entire approach is governed by the desire to enable the user to run, debug and analyze the specifications and designs that result from the graphical languages. To this end, the database has been constructed to make it possible to rigorously execute the specification and to retrieve information of a variety of kinds from the overall three-sided description of the SUD provided by the user. Two of the special tools provided by STATEMATE for these purposes are the object list generator (OLG), a language for querying the database and retrieving information from it, and the simulation control language (SCL), which allows the user to emulate the SUD’s environment, execute the specifications with animated response, and track errors and run-time problems. In addition, STATEMATE provides a number of dynamic tests, such as reachability and the detection of deadlock and nondeterminism. STATEMATE provides an automatic translation of the entire specification into Ada*, yielding code that can be linked to real or simulated environment modules, and enriched by additional code describing the bottom-level activities that were left unspecified in the specification itself. This results in a prototypical version of the final system that can be run much faster than the animated simulation.
Statecharts Activity-charts FOIlU.3 -
Module-charts
STATEMATE was constructed by a team of around 25 people over a period of three years. The currently available version runs on a color6 VaxStation (or a network of such) with a VMS operating system, and its database is DEC’s Rdb. Unix0 versions running on Sun and Apollo workstations will become available in the Summer of 1988.
Administrator or Project Manager Instructions
Additional User Code
Simulation Reports
Working Reports, Documents & Plots
l7:-..x.r. 3. n.,,,,ll
Analysis ReptS
.+rrv+,.rq
We should note that most of the ideas and methods embodied in STATEMATE have been field-tested successfully in a number of large real-world development projects, . . . among which is the mission-specific avionits system for the Lavi fighter aircraft designed by the Israel Aircraft Industries.
Ada Code
4 Ada is a trademark of the US Department of Defense. ’ While color appears to siznificantlv ” enhance the anneal _* of STATEMATE, a monochrome version of STATEMATE is also available. 6 Unix is a registered trademark of AT&T Bell Labs.
of STATEMATE
398
---
1 r operator 1
I limits
J
:
SHARED-
’ :
Fieure 3. The Modelling
Languages
3: Module-chart
of the early warning
of STATEMATE
In this section we present the highlights of the three graphical languages and the forms language that the user of STATEMATE employs to specify the SUD. No formal syntax or semantics are given here, neither are all of the features presented. The reader is referred to [i-L11 for a more comprehensive description, and to [Hl, HPSS] for a detailed treatement of the language of statecharts. The languages are described with the help of a simple example of an Early Warning System (EWS in the sequel), which has the ability to take measurements from an external sensor, compare them with some prespecified upper and lower limits and warn the user when the measured value exceeds these limits.
Fipure
4: An activity-chart
decomposed into submodules, as shown. The information flowing between the modules is specified too.
The structural view of the SUD is described using the language of module-charts, which describe SUD modules (i.e., its physical components), environment modules are ( i.e., those parts that for the purpose of specification deemed to be external to the SUD), and the clusters of data and/or control signals that may flow among them. Modules are depicted as rectilinear shapes, with storage modules having dashed sides and with encapsulation capturing the sub-module relationship. Environment modules appear as dashed-line rectangles external to that of the SUD itself. Information flow is represented by labelled arrows or hyperarrows’. Various kinds of connectors cau appear in these charts, both to abbreviate lengthy arrows and to denote compound chunks of data.
The functional view of the SUD is captured by the language of activity-charts. Graphically, these are very similar to module-charts, but here the rectilinear shapes stand for the activities, or the functions, carried out by the system. Solid arrows represent the flow of data items and dashed arrows capture the flow of control items.* A typical activity will accept input items and produce output items during its active time-spans, its inner workings being specified by its own lower level decomposition. Activities that are basic (i.e., on the lowest level) are assumed to be described as simple input/output transformations using other means. More about this in Sections 4 and
Figure 3 is (part of) the module-chart of our early warning system. It specifies in a self-explanatory fashion that the modules, or subsystems, of the EWS are a main component, a man-machine-interface (MMI) and a signalhandler, and that the sensor, timer and alarm are considered to be external to the system. The MM1 is further A hyperarrow
system
5.
8 In displaying module-charts and activity-charts on the screen STATEMATE employs different conventions regarding color and arrow type, so that a user can distinguish between them quite easily. Thus, for example, the arrows in module-charts are drawn using rectilinear segments parallel to the axes, whereas in activity-charts they are drawn using smooth spline functions.
has more than two endpoints.
399
Activity-charts may contain two additional kinds of objects: data-stores and control activities. Data-stores can be thought of as representing databases, data structures, buffers of various kinds, or even physical containers or reserviors, and typically correspond to the storage modules in the module-chart. They represent the ability to store the data items that flow into them and to produce those items as outputs upon request. The control activities constitute the behavioral view of the system and they appear in the activity-chart as empty boxes only, one (at most) within each non-basic activity, aa shown in Figure 4. The contents of the control activities are described in the third of our graphical languages, statecharts, which are discussed below. In general, a control activity has the ability to control its sibling activities by essentially sensing their status’ and issuing commands to them. Thus, for example, in Figure 4 the control activity & can, among other things, perform actions that cause sub-activities A,B and R to start and stop, and can sense whether those subactivities have started or stopped by appropriate events and conditions. Various consequences of are integrated into the semantics of the such occurences activity-charts language, such as the fact that all subactivities stop (respectively, suspend) upon the stopping (respectively, suspension) of the parent activity.
(a)
Fipure
(b)
5: OR-decomposition
Consider Figure 5, in which (a) and (b) are equivalent. In 5(b) states S and T have been clustered into a new state, U, so that to be in U is to be either in S or in T. The farrow leaving U denotes a high-level interrupt, and has the effect of prescribing an exit from U, i.e., from whichever of S or T the system happens to be in, to the new state V. The h-arrow entering U would appear to be underspecified, as it must cause entry to S or T; in fact, its meaning relies on the internal default arrow attached to T to indeed effect an entrance to T. Turning to AND decomposition, consider Figure 6, in which, again, (a) and (b) are equivalent. Here, to be in state U the system must be in both S and T. An unspecified entrance to U relies on both default arrows to enter the pair {V,W}, from which an occurrence of e, for example, would lead to the new pair {X,Y}, and k would lead to {V, 2). The meaning of the other transitions appearing therein, including entrances and exits, can be deduced by comparing 6(a) and 6(b). It is worth mentioning that this AND decomposition, into what we call otthogonal state components, can be carried out on any level of states and is therefore more convenient than allowing only single-level sets of communicating FSM’s. Orthogonality is the feature statecharts employ to solve the state blow-up problem; see [Hl, H2]. (Clearly, orthogonal state decomposition also replaces the need to allow multiple control activities within a single activity, as is done, e.g., in [WI.)
We now turn to the behavioral view. Statecharts, which were introduced in [Hl] (see also [H2, HPSS]), are an extension of conventional finite-state machines (FSM’S) and their visual counterpart, state-transition diagrams. Conventional state diagrams are inappropriate for the behavioral description of complex control, since they suffer from being flat and unstructured, are inherently sequential in nature, and give rise to an exponential blow-up in the number of states (Le., small extensions of a system cause unacceptable growth in the number of states to be considered). These problems are overcome in statecharts by supporting decomposition of states in an AND/OR fashion, combined with an instantaneous broadcast communication mechanism. A rather important facet, of these extensions is the ability to have transitions leave and enter states on any level.
U
(b)
(a)
Figure
6:
in a statechart
AND-decomposition
400
in a statechart
The general syntax tion in a statechart is
of an expression
labelling
r
a transi-
4f-A/ P
in
where a! is the event that triggers the transition, C is a condition that guards the transition from being taken unless it is true when (Y occurs, and p is an action that is carried out if, and precisely when, the transition is taken. Any of these can be omitted. Events and conditions can be considered as inputs, and actions as outputs, except that here this correspondence is more subtle, due to the intricate nature of the statecharts themselves and their relationship with the activities. For example, if p appears as an action along one transition and also as a triggering event on a transition in an orthogonal component of the same statechart, then executing the action will immediately cause the transition to be taken simultaneously. Moreover, in the expression o! / /?, rather than being simply a primitive action that might cause other transitions, /? might be the special action start(A) that causes the activity A to start, and similarly, rather than being simply an external, primitive event, cr might be the special even t stopped(B) that occurs (and hence causes the transition to take place) when B stops or is stopped. Table 1 shows a selection of some of the special events, conditions and actions that can appear as part of the labels along a transition. It should be noted that the syntax is also closed under Boolean combinations, so that, for example, the following is a legal label: entered(S) [in(T) suspend(C)
and not active(C)] ; X:= Y+7
exited(S)
connecting
started(A)
statechart
stopped(A)
-I
active(A)
start(A) stop(A) suspend(A)
information items
time
Table
1
ACTIONS
in(S)
entered(S)
statechart
hanging(A)
resume(A)
read(D)
D=exp
D:=exp
written(D)
D
exp
activities
1:
made-true(C)
f&e(C)
make
timeout(E,n)
schedule(Ac,n)
Some special events, conditions
ralse(
C)
and actions
on the same level as the activities and flow in question. Thus, in Figure 4, for example, some of the events and actions that can appear in the statechart S1 are St(A), rs!(B) and wr!(d), but ones referring to, say, H and K, such as at!(H), cannot, and would appear only in Sz.” This scoping mechanism for hiding information is intended to help in making STATEMATE specifications modular and amenable to the kind of division of work that is required in large projects. There are ways of utilizing primitive events and actions to override this scoping rule, but we shall not describe them here.
/
Besides allowing actions to appear along transitions they can also appear associated with the entrance to or exit from a state (any state, of course, on any level).g This association is specified in a form in the forms language discussed below. Thus, if we associate the action resume(A) with the entrance to state S, activity A will be resumed whenever 5’ is entered.
Figure 7 shows the activity-chart of the early warning system. The user, via the operator terminal, can send commands to the control activity, a structured data item which, via a form, is specified to consist of set-up, execute and reset instructions. The operator can also send the upper and lower required limits to the get&check subactivity of setup. These limits can be stored in the data-store range, to be sent upon request to the compare and report-fault activities. (The item req-limits is also structured, and stands for the pair containing the required upper and lower limits.) A special activity, get-measurements can receive the signal from the sensor and a clock reading from the timer, and translates these into a time-stamped digital value sampie, which can be sent to the comparing activity. If out of range, a signal and value can be sent to the controller and
Some of the special constructs appearing in Table 1 thus serve to link the control activities with the other objects appearing in an activity-chart, and, as such, are part of the way behavior is associated with functionality and data-flow. There are other facets to this association, one of which is the ability to specify an activity A as taking place throughout a state S, which is the same as saying that A is started upon entering S and stopped upon leaving it. This connection is also stated via forms. The power to control and sense the status of activities is limited by a scoping rule to the control activity appearing can be seen to generalize see [HU].
CONDITIONS
to
Notice that conventional variables can be used too, with changing values allowed as events, standard comparisons as conditions and assignment statements as actions.
’ In this way, statecharts Mealy and Moore automata;
EVENTS
lo Here, and also in the Figure 8, we are using abbreviations of the elements appearing in Table 1, such as at instead of started, rs! instead of resume and tm instead of timeout. STATEMATE recognizes these abbreviations too.
both
401
EWS-activities ---1
r operatorI terminal
L, 1
.----___
connect “--
“qrnits
,/
, /i
S&-Up
msgs
r
I
EWS-conrra
--_
/
-
-----I &erator- I , terminal I
no-response --.
-J 2
i--
,.,
commands
\
- -
\
Jt ----
G--J
(set-up-conlrol)
---$‘T ] - -
\ ---1 sensor
I- ----I I timer I L --,-I
I y
I b
‘\ get-measurements
\ , _compare
4
sampI>
7: Activity-chart
Fivure
of the early warning
system
EWS-control
P idle halt
Figure
8: Statechart
for the high-level
activity
402
of the early warning
system
J
the report-fault activity, respectively. The latter is responsible for sending out an alarm and formatting and sending the user an appropriate message. The second level of Figure 7 is self explanatory.
The attributes are recognizable by the query language and therefore able to be part of the criteria for retrieving information about the SUD. The color graphical editors for all three charts languages are rule-driven, continuously checking the input for syntactic soundness, and the database of STATEMATE is updated as graphical elements are introduced. They are mouse- and menu-based, and support a wide range of possibilities, including move, copy, stretch,hide,reveal and zoom options, all applicable to single or multiple elements in the charts, that can be selected in a number of ways. The form for a selected element can be viewed and updated not only from STATEMATE’s special forms editor but from the appropriate graphical editor too.
It is important to emphasize the recurring word ‘can’ in the previous paragraph. Figure 7 is not required to provide dynamic, behavioral information about the EWS; that is the role of the controlling statecharts. Figure 8, for example, shows one possible statechart for the high-level control activity of Figure 7, i.e., EWS-control, and the reader should be able to comprehend it quite easily. While the connections between activity-charts and statecharts are rather intricate, those between modulecharts and activity-charts are more straightforward. Using forms, one indicates the module that implements a given activity, and the storage module that implements a given data store. In our example, some of these associations are that the MAIN module implements the EWS-control activity, SIGNAL-HANDLER implements get-measurements and compare, and MMI implements set-up and reportfault. Within the latter association the send-err subactivity is implemented by the output-proc submodule and the other three by set-up-main.
Extensive consistency and completeness tests, as well as more subtle static logic tests can be carried out during a STATEMATE session. Examples include checking whether the hierarchy of modules is consistent with that of the activities, listing modules that have no outputs or activities that are never started, and identifying cyclic definitions of nongraphical elements (e.g., events and conditions).
We now turn to the forms language. It maintains a special form for each of the elements in the description, in which additional information can be input. This includes details that do not normally show up in the graphics, such as lengthy definitions of compound events and conditions, as well as elements that are nongraphical in nature, such as the type and structure of data items. Figure 9 shows an example of the form for a data item, in which most items are self-explanatory. The ‘Consists of’ field therein makes it possible to structure data items into components, and the ‘Attribute’ fields make it possible to associate attributes with the items (e.g., units and precision for certain kinds of data-items, or the names of the personnel responsible for the specification for certain high-level elements).
4. Queries, Executions
Synonym
cescriolion : ----P-M ,...-.-, .., . .:.,-,l.:..Lb.B~rr.. Definition : ._. .! --
STATEMATE provides a query language, the object list generator (OLG), with which the user can retrieve information from the database, effectively querying the model of the SUD as described in the modelling languages. The OLG works by generating lists of elements that satisfy certain criteria. At all times it keeps a pending list that gets modified as the user refines the criteria or asks for a list of elements of another type. For example, starting with an empty pending list, one can ask for all states in the controlling statechart of activity A, and the resulting list promptly becomes the new pending list. This list might then be refined by asking for those states therein that contain a substate named ‘off’. Then one might ask for all activities that are started within any of those states, and so on. This query language, on the face of it, might appear to be bounded in its expressive power by that of the conjunctive queries of [CM]. However, since the OLG supports certain kinds of transitive closures (such as the ancestor and descendent relationships between states or activities), it is not directly comparable with the conjunctive queries, and can be shown to be a subset of the more general fixpoint queries of [CH].
Structure
_m
(Record.
: ,‘-------
*as+.
...n.
.-. .
.-_a.. 4c ..-
List. Group, tine-of)
_.
__ __I.-.-
7
. -L---l-..-.
or Type (Inteperl
-_ _-.--
--.
..-
. -I
Float I String) :
q
Consists of : ~--_----B-q
Attribute _----
Name :
L
.I
Fivure
Attribute .-_--m..,.
9:
!
Value : -~-
Tests
In this section we describe some of the tools that STATEMATE supplies for debugging and analyzing the specification of the SUD as provided by the user via the modelling languages.
DATA-REM Name:
and Dynamic
Turning to the execution and simulation capabilities, the heart of these is STATEMATE’s ability to carry out a step of the SUD’s dynamic behavior, with all its consequences taken into account. Thus, the semantics of all of our modelling languages (in particular, that of the state-
--1
: ,A’--&
The form for a data item
403
charts) are fully incorporated into STATEhIATE’s software. A step, briefly, is one unit of dynamic behavior, at the beginning and at the end of which the SUD is in some legal status. A status captures the system’s currently active states and activities, the current values of variables and conditions, etc. During a step the environment activities can generate external events, change the truth values of conditions, and update variables and other data items. Given the potentially intricate form that STATEMATE’s description of the SUD might take on, such changes can have a profound effect on the status, triggering transitions in statecharts, activating and deactivating activities, further updating data items, and so on. Clearly, each of these changes, in turn, can possibly cause many others. The portion of STATEMATE that is responsible for calculating the effect of a step contains involved algorithmic procedures, which, among many other things, implement a formal semantics of statecharts similar to that described, e.g., in (HPSS].
Executions can thus be stopped and restarted, and intervening changes can be made; the effects of events generated with prescribed probabilities can be checked, and the computational parts of the SUD and its environment can be emulated. Moreover, during such simulated executions a truce database is maintained, which records all changes made in the status of the SUD. The trace database can later be reviewed, filed away, printed or discarded, and, of course, is an invaluable tool for analyzing the execution and its effects. A variety of simulation reports can be produced, in which parts of the information are gathered as the execution proceeds, via instructions in the SCP, and other parts are taken from the trace database after the execu.tion ends. The part of the SUD that is simulated in either interactive or batch modes can be restricted in scope., For example, one can simulate any part of the description that is identifiable by the name of some state or activity, and the rest of the STATEMATE specification is considered to be nonexistent for the duration of that simulation. Moreover, there is no need to wait until the entire SUD is specified before initiating executions and simulations; a user can start simulating, or running, a description from the moment the portion that is available is syntactically intact. In the simulation the user will typically provide those events and other items of information that are external to the specified portion, even though later they might become internal to the specification.
STATEMATE supports two basic ways of ‘running’ the SUD: interactive and batch. In the first, the user specifies some initial status of the SUD and thereafter proceeds to generate external events, change conditions and carry out other actions (such as changing the values of variables) at will, and STATEMATE considers all these to have occurred within a single step. When the user gives the GO command STATEMATE responds by transforming the SUD into the new resulting status. Typically, there will be a statechart on the screen while this is happening, and also an activity-chart, and the currently active states and activities will be highlighted with special coloring.” Batch simulation (or execution), can be described as the ability to carry out many steps in order, controlled by a simulation control program (SCP in the sequel) written in STATEMATE’s specially tailored simulation control language (SCL). During a batch execution, the same color codes are used to continuously update the displayed charts. The result is a visually pleasing discrete animation of the behavior of the SUD.
In general, then, a carefully prepared SCP can be used to test the specification of the SUD under a wide range of test data, to emulate both the environment and the as-ofyet unspecifed parts of the SUD, to check the specification for time-critical performance and efficiency, and, in general, to debug it and identify subtle run-time errors. Needless to say, the kinds of errors and misconceptions that can be discovered in this way are quite different from the syntactic completeness and consistency checks that form the highlights of most of the other available tools for system design, and which STATEMATE carries out routinely.
The SCPs themselves look a little like conventional programs in a high-level language; they employ variables and support several control structures that can be nested and indented. They are used to control the simulation by reading events and changes from previously prepared files and/or generating them using, say, random sampling from a variety of probability distributions. Several kinds of breakpoints can be incorporated into the program, causing the execution to stop and take certain actions when particuIar situations come up. These actions can range from adding 1 to a counter (e.g. to accumulate statistics about performance), through switching to interactive mode (from which the user can return to batch mode by a simple command), and all the way to executing a lengthy calculation that might constitute the inners of a basic, unspecified, activity.
Since STATEMATE can fully execute specifications, it becomes tempting to provide the ability to test, quite rigorously, for some of the crucial dynamic properties of the SUD - those we desire it to satisfy as well as those we want to make sure it does not. Accordingly, STATEMATE has been programmed to provide several kinds of dynamic tests, essentially by carrying out exhaustive, brute-force, sets of executions. These include reachability, nondeterminism, deadlock and usage of transitions. For the first of these the user inputs final conditions and STATEMATE will seek sequences of external events and other occurrences that lead from an initial status to one that satisfies these conditions, producing them if they exist and stating that there are none otherwise. It is important to stress that this is run-time, dynamic, reachability, not merely a test for whether two boxes in a diagram are connected by arrows. The same applies to the other dynamic tests too.
l1 Actually, the system will highlight only those states and activities that are on the lowest level visible.
404
5. Code-Generation
to fill in the required information, and thereafter the document will be generated automatically, projected on any retrievable portion of the description of the SUD.
and Rapid Prototyping
An additional feature recently added to the basic STATEMATE system is the code-generation capability. The user can request that the specification of the SUD (or some portion thereof) be translated automatically into Ada. The system will apply a fixed translation scheme to convert the specified activity-chart and statecharts into Ada. Moreover, code can be added by the user to emulate the environment and/or to supply meanings for the bottom-level basic activities. All of this results in a prototypical version of the final system, and will typically run much faster than the animated simulation. This Ada prototype has the ability to form the basis of a realistic simulation of the system itself, with simulated graphics representing the various physical interfaces with the user. STATEMATE might be extended in this direction in the future.
7. Conclusions In conclusion we might say that the STATEMATE system combines two principles, or theses,which we feel should guide future attempts to design support tools for system development. The first is the long-advocated need for ezecutable specifications, and the second is the advantage of using visual formalisms. As far as the first of these goes, the development of complex systems must not allow for design and construction of the final product from untested requirements or specifications. Rather, ways should be found to model the SUD on any desired level of detail in a manner that is fully executable, or simulatable, and which allo ws for deep and comprehensive testing and debugging prior to building the system itself.
The rigid nature of the translation sheme prevents a user from incorporating his or her own design decisions into the code, except insofar as such decisions were incorporated already into the STATEMATE specification, For this reason the Ada code that STATEMATE produces is of prototype quality only and will not necessarily be as efficient or as finetuned as production code. Future plans call for enhancing the code generator with the ability to incorporate decisions made interactively by the human designer, as well as with various further optimization features. 6. Reports
and Document
As to the second principle, we believe that visual formalisms will turn out to be a crucial ingredient in the next stage of the continuous search for more natural and powerful ways to exploit computers. It is our feeling that the everfalling prices and ever-rising quality of graphical computers and workstations, combined with the incredible capabilities of the human visual system, will result in a revolution in the way we carry out many of our conceptually complex engineering activities. The surviving approaches will be, to a very large extent, of diagrammatic nature, yet will be formal and rigorous, in both syntax and semantics.
Generation
STATEh4ATE can be asked to plot the charts that constitute the SUD’s description. The user has control over the portion of the chart that will be plotted, as we11 as its size and depth. In addition, the user can ask for several kinds of fixed-format reports that are compiled directly from the description of the SUD in the database, and which can be displayed on the workstation screen or output to an alphanumeric terminal or printer. Each of these can be projected, so to speak, on any part of the description that is retrievable by the OLG. In other words, the user may first use the OLG to capture, say, a set of activities of particular interest, and then request the report; it will be applied only to the activities in the list. Among the reports currently implemented a,re data dictionaries of various kinds, textual protocols of states or activities containing all the information relevant to them, interface diagrams, tree versions of the various hierarchies, and the so-called N2 -diagrams. Using a number of parameters, the user can control various aspects of the reports produced, such as the depth of the trees in the tree reports, and the keys by which the dictionaries will be sorted.
AcknowledEments: We are grateful to all the staff members of Ad-Cad Ltd., the research and development branch of i-Lo& Inc., who have been indispensible in turning the ideas described here into a real working system. Ido Lachover deserves special thanks for being the most pleasant manager imaginable, contributing his experience and expertise to all phases of the work.
We would also like to thank Jonah Lavi and his group at the Israel Aircraft Industries for their constructive criticism during the period in which the system was developed.
References
In late 1988 STATEUTE will be able to generate documentation to comply with the requirements of the Dod Standard 2167. This will not be a stand-alone feature, but, rather, part of a more general approach that involves a language for user-specified document generation. In this language the user constructs his or her own document template, complete with the queries whose responses will serve
405
[CHI
A. K. Chandra and D. Harel, “Structure and Complexity of Relational Queries”, J. Comput. Syst. Sci. 25 (1982), 99-128.
PM1
A. K. Chandra and P. Merlin, “Optimal Imple mentation of Conjunctive Queries in Relational Databases*, Proc. 0th ACM Symp. on Theory of Computing, Boulder Co., 1977, pp.77-90.
PI
D. Harel, “Statecharts: A Visual Formalism for Complex Systems,” Science of Computer ProVamming 8 (1987), 231-274.
w4
D. Hare& “On Visual Formalisms”, Communications of the ACM, to appear, June 1987.
WI
D. Hare1 and A. Pnueli, “On the Development of Reactive Systems,” in Logics and Models of Concurrent Systems (K. R. Apt, ed.), Springer-Verlag, New York, 1985, pp. 477-498.
[HPSS]
D. Harel, A. Pnueli, J. P. Schmidt and R. Sherman, “On the Formal Semantics of Statecharts,” Proc. 2nd IEEE Symp. on Logic in Computer Science, Ithaca, NY, 1987, pp. 54-64.
WI
D. J. Hatley, uA Structured Analysis Method for Real-Time Systems”, Proc. DECUS Symp., Dec. 1985.
WI
J. E. Hopcroft and J. D. Ullman, Wroduction to Automata Theory, Languages, and Computation, Addison-Wesley, 1979.
[i-L11
“The Languages of STATEMATE”, Technical port, i-Logix Inc., Burlington, MA, 1987.
[i-L21
“Methodologies of Building Specifications Using the STATEMATE System”, Technical Report, iLogix Inc., Burlington, MA, 1987.
ILKI
J. Z. Lavi and E. Kessler, “An Embedded Computer Systems Analysis Method”, Manuscript, Israel Aircraft Industries, November 1986.
PI
A. Pnueli, “Applications of Temporal Logic to the specification and Verification of Reactive Systems: A Survey of Current Trends”, in Current Trends in Coneurreney (de Bakker et al. eds.), Lect. Notes in Comput. Sci., Vol. 224, Springer-Verlag, Berlin, 1986, pp. 510-584.
[WI
P. Ward, “The Transformation Schema: An Extension of the Data Flow Diagram to Represent Control and Timing”, IEEE Transactions on Software Engineering 12 (1986), 198-210.
Re-
406