Static features in real-time recognition of isolated vowels at high pitch Aníbal J. S. Ferreiraa兲 Department of Electrical and Computer Engineering, University of Porto, Rua Dr. Roberto Frias s/n, 4200-465 Porto, Portugal
共Received 16 September 2006; revised 22 July 2007; accepted 23 July 2007兲 This paper addresses the problem of automatic identification of vowels uttered in isolation by female and child speakers. In this case, the magnitude spectrum of voiced vowels is sparsely sampled since only frequencies at integer multiples of F0 are significant. This impacts negatively on the performance of vowel identification techniques that either ignore pitch or rely on global shape models. A new pitch-dependent approach to vowel identification is proposed that emerges from the concept of timbre and that defines perceptual spectral clusters 共PSC兲 of harmonic partials. A representative set of static PSC-related features are estimated and their performance is evaluated in automatic classification tests using the Mahalanobis distance. Linear prediction features and Mel-frequency cepstral coefficients 共MFCC兲 coefficients are used as a reference and a database of five 共Portuguese兲 natural vowel sounds uttered by 44 speakers 共including 27 child speakers兲 is used for training and testing the Gaussian models. Results indicate that perceptual spectral cluster 共PSC兲 features perform better than plain linear prediction features, but perform slightly worse than MFCC features. However, PSC features have the potential to take full advantage of the pitch structure of voiced vowels, namely in the analysis of concurrent voices, or by using pitch as a normalization parameter. © 2007 Acoustical Society of America. 关DOI: 10.1121/1.2772228兴 PACS number共s兲: 43.72.Ar, 43.71.Es, 43.70.Mn 关DOS兴
I. INTRODUCTION
Language learning and speech therapy applications require robust automatic identification of speech sounds uttered in isolation, notably vowels. Most frequently, the automatic identification of isolated vowels is implemented through formant analysis using, for example, linear prediction 共LP兲 techniques 共Zahorian and Jagharghi, 1993兲. The basic assumption when using LP techniques is that the production of voiced sounds by the human phonetic system can be modeled as an all-pole filter that is excited by a periodic train of glottal pulses. The repetition rate of these pulses corresponds to the fundamental frequency 共F0兲 of the voiced sound, or pitch, and the poles of the all-pole filter correspond to resonances of the vocal tract, or formants. The frequencies of the first three formants 共F1, F2, F3兲 are usually considered as good acoustic correlates of a given vowel 共Fant, 1970兲. When F0 is significantly lower than the lowest formant 共F1兲, the formant frequencies give rise to clear peaks in the envelope of the magnitude spectrum of the vowel signal. LP analysis techniques can therefore be used to reliably estimate the resonant frequencies of the vocal tract 共or formant frequencies兲. Subsequently, a simple acoustic-phoneme association can be used to identify the vowel 共Rabiner and Juang, 1993兲. On the other hand, when F0 is comparable to or higher than F1, which is typical in female or child speech, or singing, LP techniques are not reliable in estimating the formant frequencies and in subsequently identifying vowels. In fact, the pitch frequency of female or child speech can be on the order of 300 Hz 共or even more兲, which significantly exa兲
Electronic mail:
[email protected]
J. Acoust. Soc. Am. 122 共4兲, October 2007
Pages: 2389–2404
ceeds the upper limit of the typical male pitch range 共about 160 Hz兲, but is comparable to a typical frequency of the first formant 共F1兲. In this case, the LP approach normally fails to provide a reliable estimate of the formant frequencies, essentially because the magnitude spectrum becomes undersampled 共i.e., it is sampled at integer multiples of the pitch frequency兲. A frequent observation is that using LP, the estimated formant frequencies are “locked” to the harmonic frequencies of the fundamental frequency. In other words, as noted by Zahorian and Jagharghi 共1993兲, Bladon 共1982兲, and Mollis 共2005兲, conceptually, the LP model is valid for speech production, but is not appropriate for speech perception, notably in the case of vowel identification at high pitch frequencies. This problem has been addressed by de Cheveigné and Kawahara 共1999兲 as a problem of missing-data model of vowel identification. To a large extent, it also corroborates that the question formulated by Klatt 共1982兲 of how the “central nervous system can examine an input vowel spectrum and select out the relevant acoustic details in order to make a phonetic judgement,” remains significantly unanswered. In this paper a new approach to the problem of automatic identification of voiced vowels is proposed, where pitch plays a central role. The underlying concept of vowel perception assumes that the human auditory system 共HAS兲 discriminates vowels by performing a perceptual clustering of partials in the harmonic structure of the vowel. This concept is designated in this paper as perceptual spectral cluster 共PSC兲. While the formant concept derives from speech production and is specifically associated with the resonant frequencies of the vocal tract, the PSC concept is linked to perception and attempts to identify clusters of harmonic par-
0001-4966/2007/122共4兲/2389/16/$23.00
© 2007 Acoustical Society of America
2389
tials whose features, namely center of gravity 共COG兲, left and right borders, and average spectral power, give rise to relevant perceptual cues that are used by the HAS in vowel discrimination and identification. The focus is placed on static features since previous results, such as those presented by Zahorian and Jagharghi 共1993兲, have indicated that static features are the most important features in vowel discrimination, and also because the main application objectives considered in this paper involve real-time visual representation of static features extracted from sustained vowel sounds, and real-time vowel identification. Therefore, it is presumed in this context that a voiced vowel is uttered in isolation and in a sustained way 共i.e., there is silence before and after the vowel sound兲. The envisioned application scenarios imply that the accumulated delay due to the signal processing involved in signal analysis, feature extraction, vowel classification, and visual representation is commensurate with the time the HAS takes in identifying isolated vowels. For most sustained vowels, robust human recognition occurs very reliably in less than 100 ms.
A. Motivation to real-time isolated vowel recognition
An interest in real-time robust vowel identification emerged when the author was involved in a project aiming at building a set of interactive demonstrators on the subject of sound and the human auditory system.1 One such specific demonstrator was a real-time audio/speech analyzer featuring time and frequency displays, accurate pitch estimation, accurate identification and visual representation of harmonic structures, and visually oriented vowel recognition using LP formant tracking. After fine-tuning the operation of the vowel recognizer for the main Portuguese vowels, it was quite disappointing to find that LP formant tracking was very reliable and robust when used with vowels uttered by adult male speakers, but not when used with vowels uttered by adult female or child speakers. Our interest is motivated by two relevant application areas: language learning and speech therapy. These areas require interactive computer-based visual feedback of acoustic features extracted from phonemes, uttered in isolation, notably vowels, in order to reinforce or replace the natural acoustic feedback pathway. In the case of language learning, as pointed out by Palethorpe et al. 共1996兲, it is known that the learning and training of vowels represents the first important stage in language learning, control of the phonetic system, and understanding of the vowel-consonant interactions. Therefore, a technology support for visual feedback of acoustic features reinforces the acoustic feedback and facilitates faster learning convergence to correct pronunciation. On the other hand, robust real-time phoneme recognition technology is also desirable in a clinical context involving speech therapy. The main advantages are that it increases the motivation of patients by providing a visual feedback environment, it provides a rich and stimulating diversity of practice exercises, facilitates their upgrade, and it accelerates rehabilitation programs by offering patients viable 2390
J. Acoust. Soc. Am., Vol. 122, No. 4, October 2007
opportunities for self-training as a complement to formal speech therapy sessions conducted by a professional therapist. In particular, children attending language learning or speech therapy programs represent the population segment that is most likely to benefit from phoneme recognition technology. In fact, children are naturally motivated to interact with computer-based games offering challenges, competition, and discovery. For example, a computer game may be designed using visual feedback of acoustic features and using sound as the preferred medium of interaction. Furthermore, the effectiveness of such a game may be increased by including automatic assessment functionalities. Conceptually, these simple phoneme identification scenarios are just a small fraction of the broad automatic speech recognition problem, in the sense that they focus on robust feature extraction rather than on sophisticated languageaware classification strategies. Despite this fact, automatic identification of phonemes uttered in isolation suggests challenges in its own right since, to a large extent, human performance in recognizing isolated vowels 共i.e., without context兲, in a speaker independent way, is not even approximated by current state-of-the-art technology. This perspective is shared by Dusan and Rabiner 共2005兲, who support that there is “gap between machine and human performance of recognition systems across a wide range of problems.” On the other hand, vowel recognition of child phonemes, which is the focus in this paper, has not received much research effort in recent years 共Palethorpe et al., 1996兲. B. The problem of vowel recognition at high pitch
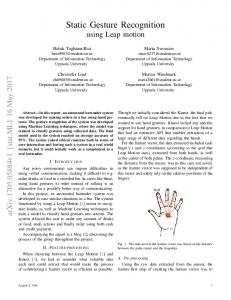
According to Hess 共1983兲, the fundamental frequency 共or pitch兲 of the speech uttered by a human speaker can vary over a range of almost four octaves 共50– 800 Hz兲. In singing, including the falsetto register, the pitch may extend from 50 to 1800 Hz 共Hess, 1983, p. 64兲. If a vowel is whispered or is uttered at very low pitch, the corresponding magnitude spectrum is represented by a very dense structure of components that “illuminate” the envelope of the spectral representation with considerable detail. As a result, prominences 共i.e., formants兲 in the spectral envelope that correspond to resonances of the vocal tract can be easily identified. A few spectral envelope models that are typical of the tonic Portuguese vowels /a/, /o/, /e/, /u/, and /i/, are illustrated in Fig. 1. As formant estimation based on LP analysis tries to model the envelope of the magnitude spectrum of a sound, and its peaks in particular, reliable results are obtained when F0 is sufficiently low to resolve detailed prominences in the spectral envelope model such as those that are typical of the vowel /a/, as illustrated in Fig. 1. If F0 is sufficiently high as to not provide that resolution capability, as illustrated in Fig. 1 for vowel /i/, important spectral peaks are just “missed” and, as a result, formant estimates are not reliable. This scenario is even worse when F0 is comparable to the frequency of the first formant 共F1兲, which happens frequently in singing, for example. Surprisingly, even in these cases, the HAS Aníbal J. S. Ferreira: Static features in high-pitched vowel recognition
that the frequency locations of the first two formants 共identified as local peaks in the spectral envelope兲 determine very strongly the vowel they are associated with. In particular, the second formant alone represents the main differentiating factor between vowels /o/ and /e/, and also between vowels /u/ and /i/. However, the technique of formant estimation using LP is not speaker independent and the discrimination ability of the approach fails in the case of children speech or singing voice 共Thorpe and Watson, 2000兲. In fact, as pointed out by Plomb 共2002兲, “the overlap of the first two formants for different vowels due to men, women, and children is so considerable that the same configuration of formants may correspond with different vowels for the three, categories of speakers.” The most typical problems of LP-based formant estimation are as follows: 共1兲 The estimation accuracy depends strongly on the order of the LP model, the literature indicating that filter orders of practical interest are in the range 10–16. 共2兲 The sampling frequency of the speech signal affects significantly the operation of the LP filter and, in particular, when it is much higher than the frequency of the formants, their estimation is difficult and unreliable, even for high LP orders. 共3兲 The pitch of the voiced speech signal may act as an adverse distracting factor to the whole LP formant estimation process. Some solutions commonly used to attenuate these problems and used to improve the performance of LP-based formant estimation, include: FIG. 1. Illustration of typical spectral envelope models pertaining to vowels /a/, /o/, /e/, /u/, and /i/ 共the different models are shifted along the Y axis for convenience of visualization兲. When the pitch frequency is sufficiently low to resolve the prominences 共i.e., formants兲 in the spectral envelope, as in the illustrative example at the top and regarding vowel /a/, LP analysis is able to provide reliable estimates of the formant frequencies. When the pitch frequency is relatively high, as illustrated at the bottom, formants are not well captured by the harmonic partials and as a consequence, LP analysis is not reliable in formant frequency estimation.
has an astonishing capability of recognizing vowels reliably, independent of the gender or age of the speaker, which suggests that the human auditory system is likely to use cues other than formants in the recognition process. An extensive characterization of the problem is discussed by de Cheveigné and Kawahara 共1999兲. C. Specific problems of formant estimation based on LP
It has been mentioned previously that formant tracking using linear prediction is a technique widely used to recognize vowel sounds. In particular, in the case of male adult speech, and for low sampling frequencies 共e.g., 8 kHz兲, the representation in a plane of the frequencies of the first two formants estimated using LP allows a clear discrimination between the different vowels. This plane is normally known as the F1-F2 plane. As an example, Fig. 1 helps to illustrate J. Acoust. Soc. Am., Vol. 122, No. 4, October 2007
共1兲 Decimation so as to reduce the sampling frequency and so as to separate low frequency formants, 共2兲 Preemphasis in order to facilitate LP estimation of highfrequency formants, 共3兲 Shifting the low-frequency poles of the LP model closer to the unity circle 共of the Z plane兲 so as to emphasize different peaks in the spectral envelope, 共4兲 Nonlinear frequency scaling so as to increase the angular separation between formants, particularly at low frequencies 关a popular technique is perceptual linear prediction, Honig et al. 共2005兲兴. Due to the unreliability of formant estimation using LP techniques, most often, as described in Sec. I D, an automatic formant estimation procedure is followed by manual correction so as to eliminate errors and inconsistent results 共Palethorpe et al., 1996兲. D. Literature review
Several acoustic features that are alternative to formant tracking using LP have been proposed in the literature. Palethorpe et al. 共1996兲 have suggested a technique based on critical band analysis and classification of speech signals. Their approach was motivated by the observation that inconsistencies exist in the relationship between a vowel classification based on formants and that based on listener judg-
Aníbal J. S. Ferreira: Static features in high-pitched vowel recognition
2391
ments. They compared the performance of formant tracking using 10-pole LP autocorrelation analysis, and spectral analysis on a critical band rate 共Zwicker, 1961兲 up to 6400 Hz. Using both techniques and Gaussian classification, results have revealed that the best scores for correct classification of vowels were in both cases on the order of 60% for child speakers and about 90% for adult speakers. The authors have emphasized that although both critical band and formant based frequency analysis provide similar scores in the classification of vowels produced by both child and adult speakers, a fundamental difference lies in the fact that the LP-based formant tracking required a significant amount of hand-editing, while such hand-editing was not required in the case of the critical-band spectral analysis.2 Similar results have been presented by Zahorian and Jagharghi 共1993兲, who compared global spectral-shape features 共similar to cepstral coefficients兲 versus formants, on a data base of 30 speakers 共10 men, 10 women, and 10 children兲. In a test of static vowel classification and using the Bayesian maximum likelihood classifier, results have indicated that a set of 10 global-spectral shape features scored about 77.0%, while a set of four formant features scored about 72%. The inclusion of the pitch as a feature had the effect to increase these scores slightly3 共about 0.5% in the former case and about 3% in the latter case兲. The authors have noted that these results are far behind the human performance that has been concluded to be on the order of 91% correct identification. Using further tests, the authors have also concluded that duration cues appear to play a rather small role in vowel discrimination. Thorpe and Watson 共2000兲 have presented an alternative method that represents the vowel space directly by a factorial analysis of the harmonic amplitudes, without requiring explicit identification of formant frequencies. Taking into consideration that at high pitches, the vocal tract resonances are sampled only at multiples of the fundamental frequency, principal component analysis 共PCA兲 is performed on the set of harmonics and significant eigenvalues are represented in bivariate scattergrams. As a reference, F1-F2 scattergrams are also obtained using a 12-order LP analysis and formant tracking. Vowels sung by professional singers at different pitches were recorded and analyzed. Results have shown that at high pitches, F1-F2 scattergrams lose the ability to distinctly represent the different vowels as they do at low pitches. PCA scattergrams show better results at high pitches but still a significant overlap between different vowel representations can be observed, which makes vowel discrimination difficult. Hermansky et al. 共1985兲 have proposed a vowel analysis procedure that is based on the perceptually based linear prediction model 共PLP兲. This model performs a critical band analysis of the speech signal using 18 filters, preemphasis, intensity-loudness conversion, and inverse FFT delivering autocorrelation coefficients on the warped frequency scale. A fifth-order all-pole model is then used to extract at most two major peaks from the auditory spectrum. The PLP method identifies front vowels4 by two strong peaks whose frequencies are very similar to F1-F2 formants, and back vowels5 by a single peak whose center frequency and bandwidth denote 2392
J. Acoust. Soc. Am., Vol. 122, No. 4, October 2007
the spread of the F1-F2 formant region. Peak trajectories of vowels by male and female speakers were shown to be quite similar. Very convincing performance scores 共approaching 98%兲 in speaker-independent automatic recognition of digit utterances are presented in a subsequent paper 共Hermansky, 1990兲, but do not correspond to our target testing conditions since whole words are classified and thus dynamic time information has a significant influence on the results. de Cheveigné and Kawahara 共1999兲 suggest that vowel identification may be seen as a process of pattern recognition with missing data. Vowel recognition is implemented by evaluating the distance of a test signal to a vowel template using a weighting function derived after pitch estimation, and that emphasizes harmonic spectral regions much like a “harmonic sieve.” The paper presents a rich discussion on alternative approaches addressing the problem of vowel recognition at high F0, and supports an F0-dependent smoothing not necessarily coincident with formant peaks. The proposed model of vowel recognition is presented in two versions 共a frequency domain version and an autocorrelation version兲 and although the relative merits are discussed from a conceptual perspective, a complete evaluation of the performance of the proposed model is, however, not provided. As pointed out by Hillenbrand and Houde 共2003兲, the missing data model of de Cheveigné and Kawahara was not evaluated on naturally spoken utterances. Only a few examples of template-matching are used to compare narrowband input spectra to smoothed spectral-shapes templates. In a similar way, Mollis 共2005兲 has addressed the relative performance of formant based-models and wholespectrum models 共including a method using excitation patterns and perceptual linear prediction cepstral coefficients兲 while using synthetic vowels in the testing methodologies. Results have indicated that representations that included only formant frequency information, performed poorly, although improvements could be obtained by adding relative formant magnitude information. The presented results are qualitative rather than quantitative because synthetic vowels with variations restricted to F2 and F3 formant frequencies have been used in the tests, and thus do not attempt to characterize a “practicable model of vowel perception,” as admitted by the authors 共Mollis, 2005, p. 1069兲. Wet et al. 共2004兲 depart from the observation that “there are still no tools available that can automatically extract exact true formants from speech reliably,” and compare automatically extracted formant-like features 共“robust formants” and HMM2兲 so as to compare them in vowel recognition tests to hand-labeled formants. Results have shown that the performance of automatically extracted formants was quite comparable to hand-labeled formants in a gender-dependent experiment, but was inferior in a gender-independent experiment. Furthermore, Mel-frequency cepstral coefficients 共MFCC兲 features were also included in the tests and have exhibited the same or superior performance in vowel recognition tests 共on the order of 91% correct recognition in gender-independent tests兲, especially under noisy acoustic conditions. The authors have therefore concluded that “forAníbal J. S. Ferreira: Static features in high-pitched vowel recognition
mant representation of speech has no compelling advantages over representations that do not involve error-prone labeling decisions such as MFCCs.” The results presented by Wet et al. 共2004兲 are not truly representative of speaker-independent tests since children utterances have deliberately been excluded from the test data with the argument that it “could not be guaranteed that the proposed formant extraction could handle children’s speech appropriately” 共Wet et al., 2004, p. 1883兲. However, the authors support that previous knowledge on the gender of the speaker has a positive impact on the recognition performance. Other recent papers on formant estimation do not address directly the problem of robust speaker-independent recognition of vowels but study other aspects such as the influence of noise 共Bruce et al., 2002; Chen and Loisou, 2004兲. E. Structure of the paper
The rest of the paper is structured as follows. In Sec. II the PSC concept is described as well as the signal processing environment used to estimate PSC-related features and to assess experimentally its perceptual relevance. In Sec. III, three different feature sets and respective estimation methods are described that are used to benchmark the performance of PSC features. In Sec. IV the database of natural vowel sounds used to train and test the different vowel identification schemes is characterized. In Sec. V the classification results characterizing the relative performance of the four different feature sets in vowel identification tests are presented, and discuss their significance in Sec. VI. Section VII summarizes and concludes the paper. II. THE PERCEPTUAL SPECTRAL CLUSTER CONCEPT AND FEATURES
The PSC concept has been inspired by Klatt’s 共1982兲 discussion regarding “prominent energy concentrations” in the magnitude spectrum of a vowel sound and a first experimental validation has been reported in Ferreira 共2005兲. The PSC concept has emerged by realizing that in order for automatic sound identification to reach human performance, even in a task as simple as isolated vowel identification in real-time, attempts must be pursued to better understand and to get closer to the “signal processing in the human auditory system” 共Rabiner and Juang, 1993, p. 132; Sroka and Braida, 2005, p. 421兲. In this spirit, the PSC concept is also influenced by Plomb’s 共2002兲 perspective that interpretation of a sound by the HAS is organized in stages, starting with raw features such as sound intensity 共and the resulting sensation of loudness兲, and progressing to more elaborate stages of perception corresponding to pitch and timbre for example, by incorporating more features 共or more details of the same features兲, until a complete psychoacoustic percept6 is formed. This perspective is suggested in Fig. 2. Ultimately, not only the recognition of a specific sound is achieved at the linguistic level 共such as the identity of a spoken vowel兲, but an interpretation is also established regarding the quality of the vowel and the identity of the speaker, by using additional features. These are related, for example, to the glottal pulse J. Acoust. Soc. Am., Vol. 122, No. 4, October 2007
FIG. 2. Conceptual approach to sound interpretation. As more elaborate features are captured from an acoustic stimulus, the more complete the psychoacoustic interpretation is of the acoustic event.
shape, or to the detailed and persistent spectral resonances that correspond to the acoustic signature of a specific individual speaker. As also argued in Plomb 共2002兲, “speakerspecific differences in pitch and timbre, as well as timing cues, provide the basis for separating voices into 关perceptual兴 streams.” The PSC concept is strongly rooted in the idea that the human recognition of a sustained voiced vowel results from both the identification of its pitch, and timbre. Timbre is commonly seen as the “color” of a sound and, in the case of a harmonic sound such as a vowel utterance, it is a function of the spectral power of its partials. Thus, for a voiced vowel sound, timbre analysis requires the identification of the underlying harmonic structure. The perception of a harmonic structure and its attributes plays a very important role in the auditory ability to recognize and segregate sounds. In fact, as argued by Plomb 共2002兲, “in listening to two or more simultaneous complex tones-human voices or musical voices-, the auditory system is continuously ‘testing’ which sinusoidal components are harmonics of the same fundamental.” As a result, partials that are harmonic of the same fundamental frequency 共F0兲 are fused or integrated on a single auditory object 共or acoustic percept兲. On one hand, this helps to segregate among harmonic structures that have a different pitch.7 On the other hand, the perceptual aggregation of harmonic partials also helps to differentiate among harmonic structures possessing a similar pitch, due to differences in timbre. This fact is invoked by the American Standards Association as a major aspect in defining timbre as a perceptual quality of a sound, although it is admitted that the intensity and temporal characteristics of the sound also have an influence.
Aníbal J. S. Ferreira: Static features in high-pitched vowel recognition
2393
FIG. 3. Signal processing environment used to test the PSC concept.
The PSC concept builds on this perceptual integration of partials pertaining to the same harmonic structure, and tries to identify clusters of harmonic partials and their attributes, which explain the ability of the HAS to differentiate among vowels. In other words, inasmuch as the different partials of a harmonic structure are fused in a perceptual sensation of pitch 共Moore, 1989兲, it is admitted that a second level of perceptual integration involving the harmonic partials within each PSC is carried out by the human auditory system, giving rise to the sensation of spectral color and meaning. This hypothesis has been tested extensively using the signal processing environment illustrated in Fig. 3. This environment is essentially a subset of processing tools pertaining to an audio coder 共Ferreira, 1996a兲, allowing analysis, modification, and synthesis of sounds in the frequency domain. The main processing blocks involve the following: 共1兲 Segmentation of the input audio signal in segments x共n兲 of length N, with 50% overlap, and windowing of each segment with a window corresponding to the square root of a shifted Hanning window 共Ferreira, 1998兲: h共n兲 = sin
冉 冊
1 n+ , 2 N
n = 0,1, . . . ,N − 1,
共1兲
共2兲 Time-to-frequency transformation by means of an odd DFT, defined as N−1
XODFT共k兲 =
兺 h共n兲x共n兲e−j共2/N兲共k+1/2兲n ,
n=0
共2兲 k = 0,1, . . . ,N − 1, 共3兲 Frequency-to-time transformation by means of an inverse odd-DFT transformation, 共4兲 Windowing of the reconstructed segment with the same window used for analysis, and signal reconstruction using overlap-and-add with 50% overlap. If there is no spectral modification, this analysis/synthesis environment is perfect reconstructing 共Vaidyanathan, 1993兲, i.e., y共n兲 = x共n ¬ n0兲, where n0 represents a delay. The processing environment illustrated in Fig. 3 also has the capability of identifying sinusoidal components pertaining to an existing harmonic structure 共Ferreira, 1996b兲, and modifying them with regard to frequency, magnitude, or phase 共Ferreira, 2001兲. This processing is implemented in the ODFT frequency domain. Although it delivers essentially the same information as the DFT, the ODFT is more convenient from the point of view of signal analysis and modification 共Ferreira, 1998兲. Using this signal processing environment with N = 1024 samples and 32 kHz sampling frequency, we could manipu2394
J. Acoust. Soc. Am., Vol. 122, No. 4, October 2007
late the characteristics of individual groups of partials pertaining to the harmonic structure of a voiced vowel, and assess what specific changes led to a loss of identity of the vowel, or led to a vowel conversion. Although some of the conclusions of these experiments are addressed in Sec. VI, for the purpose of defining the PSC concept and explaining what features have been extracted based on this concept, here an illustration is given, using one example of how the concept and identification of a PSC has emerged. Figure 4 represents the spectrogram of short audio segments extracted from the stationary region of voiced vowel sounds uttered by a young female. This signal is included in the database. Figure 4 also represents the short-time power spectral density 共PSD兲 of the individual vowel sounds. For each vowel sound, different harmonic partials have been manipulated so as to study their impact on vowel identity. Using many vowel sounds from different speakers and after extensive testing, it has been concluded that only two clusters of adjacent harmonic partials were necessary to preserve vowel identity, the remaining ones being either masked or not relevant in contributing to the vowel identity. As a result, the decision was made to name those clusters PSC1 and PSC2, PSC1 being on the left of PSC2. Figure 5 illustrates the two clusters of harmonic partials above the noise floor 共PSC1 and PSC2兲, which resulted from the natural vowel sounds illustrated in Fig. 4, as a result of the manipulation just described. These manipulations also included a magnitude smoothing with the purpose of avoiding small local peaks among adjacent partials. In addition, the pitch frequency is normalized to the average pitch of the speaker in order to focus the identification process on static cues. Repeating this manual procedure for each vowel sound in the database 共to be described in Sec. IV兲 has proved to be a tremendously time-consuming task. In order to avoid fragile judgments and results, a criterion has been adopted that the spectral modification emphasizing PSC clusters should not only preserve vowel identity but also a significant degree of speaker identity. The insight gained by performing these spectral modifications led to the design of an automatic PSC estimation algorithm described in Sec. II A.
A. Estimation of PSCs
A signal processing algorithm was developed to automatically detect PSCs, on a frame-by-frame basis, by identifying their lower and upper borders and average spectral power. The main processing steps8 of the algorithm can be structured into two major blocks 共PSC preprocessing and PSC merge兲 and are as follows: 共1兲 A new frequency domain is created that includes all harmonic partials in the magnitude spectrum of the voiced vowel 共i.e., the noise floor between two adjacent harmonic partials is ignored兲, 共2兲 A magnitude smoothing in the new frequency domain is implemented so as to avoid small local peaks, 共3兲 All local peaks are identified as potential PSC candidates, Aníbal J. S. Ferreira: Static features in high-pitched vowel recognition
FIG. 4. Spectrogram and short-time PSD representations pertaining to five vowels uttered by a 13 year old young female.
共4兲 Starting from the center of each PSC candidate, left and right borders are found by absorbing into the PSC neighboring partials whose magnitude is not below 8 dB9 of the average magnitude of the PSC 共this average magnitude is updated every time one more partial is absorbed into the PSC兲, 共5兲 The above PSC preprocessing does not merge different PSCs, but may result in PSCs with abutting borders cor-
responding to local minima; these PSCs are first identified and, if their absolute magnitude difference is below 8 dB, a PSC decimation is carried out by merging PSCs, 共6兲 Adjacent but nonabutting PSCs are identified and, if sufficiently close to each other, their magnitude difference is evaluated and eventually are merged if the magnitude criterion of the previous step is met.
FIG. 5. Spectrogram and short-time PSD representations of resynthesized vowel sounds resulting from manipulation on the harmonic partials of the original sounds illustrated in Fig. 4, in such as way as to preserve vowel identity. Two spectral clusters of harmonic partials were concluded to be sufficient for clear recognition upon listening.
J. Acoust. Soc. Am., Vol. 122, No. 4, October 2007
Aníbal J. S. Ferreira: Static features in high-pitched vowel recognition
2395
FIG. 6. Short-time PSD of a sound frame corresponding to the utterance of vowel /a/ by a female speaker 共thin solid line兲, spectral envelope derived from the magnitudes of the harmonic partials and after smoothing 共dotted line兲, spectral envelope model derived from linear prediction analysis with order 16 共smooth solid line兲, and identification of the borders 共triangles兲 and magnitude of the PSCs found 共thick solid line兲.
This algorithm is iterated for each frame until there are no more PSCs to merge. After execution of the algorithm, a mapping to the original frequency domain is performed of the boundaries and average magnitude of all PSCs found. This allows the verification of the correctness of the processing both in a graphical and auditory perspective. As one example, Fig. 6 depicts the result of the algorithm for one frame of the sound corresponding to vowel /a/ as uttered by a female speaker. Figure 6 shows the short-time PSD of the original signal, the smooth spectral envelope model based on the magnitudes of all harmonic partials, the spectral envelope model derived from a 16th-order linear prediction analysis, and the borders and average magnitude of all PSCs found. In order to test the perceptual impact of the information delivered by the algorithm, the processing environment illustrated in Fig. 3 is used in order to resynthesize the vowel signal after spectral modification. This modification preserves only harmonic partials within the borders of any selection of PSCs, and may either preserve the original magnitudes or enforce magnitude equalization by the average magnitude of each PSC. In the resynthesis, the original initial phases of the preserved harmonic partials may be used or replaced by a random phase value 共in which case, phase continuity is enforced in subsequent frames兲.
B. Extraction of PSC features
The algorithm described in Sec. II A has been fine-tuned and tested with most of the vowel recordings included in the database 共which is described in Sec. IV兲. The resynthesis and listening of the modified vowel spectra led us the following main conclusions: 2396
J. Acoust. Soc. Am., Vol. 122, No. 4, October 2007
共1兲 The two PSCs with highest average magnitude are sufficient for clear vowel identification. 共2兲 A modest degree of magnitude smoothing on the preserved harmonic partials does not significantly affect either vowel recognition or speaker identification. 共3兲 The replacement of the original initial phase of the preserved harmonic partials by a random phase value 共and ensuring subsequent proper phase continuity兲 appears to interfere with speaker identity. 共4兲 The PSC falling below about 2 kHz has the highest impact on vowel identity and, in particular, the suppression 共or strong attenuation兲 of a single harmonic partial may transform a vowel sound into another 共for example, an /a/ may be transformed into an /o/兲. 共5兲 Harmonic partials at the left border of the PSC falling below about 2 kHz do not contribute significantly to vowel identity, their impact is more related to quality of the vowel and “presence” of the vowel sound 共which is consistent with the well-known phenomenon of missing fundamental兲. 共6兲 The specific shape of the spectral envelope described by the magnitudes of the harmonic partials within the PSC falling below 2 kHz can be quite diverse, from convex, flat, until concave, and it impacts mainly on vowel quality and speaker identification rather than on vowel identification. 共7兲 The feature pertaining to the PSC falling above about 2 kHz and with highest impact on vowel identity is its average magnitude; as an example, if this magnitude is manipulated so as to be significantly attenuated, an /e/ sound is transformed into an /o/ sound, and an /i/ sound is transformed into an /u/ sound. 共8兲 Very realistic vowel transformations can be obtained by using the shape of the spectral envelope described by the magnitudes of the harmonic partials pertaining to one vowel, in order to modulate the magnitudes of the harmonic partials pertaining to a different vowel. These conclusions, with the preliminary results reported in Ferreira 共2005兲, and experiments with real data 共i.e., with audio sounds兲 suggested that after the automatic identification of the two most relevant PSCs, as described earlier, a feature vector including as few as five features should be able to provide good classification results. The chosen features are: 共1兲 共2兲 共3兲 共4兲 共5兲
Pitch frequency 共F0兲, Center of gravity of PSC1, designated as COG1, Center of gravity of PSC2, designated as COG2, Right border of PSC1, designated as PSCR, Decibel difference between the average magnitude of PSC1 and that of PSC2, designated as difdB.
If L and R are, respectively, the frequencies of the left and right borders of a PSC, with L and R integers and L 艋 R, the COG frequency is obtained as Aníbal J. S. Ferreira: Static features in high-pitched vowel recognition
R
兺 k兩XODFT共k兲兩2
COG =
k=L R
兺 兩XODFT共k兲兩
.
共3兲
2
k=L
It should be noted that the definition of “center of gravity” given here differs significantly from the definition given by Chistovich and Lublinskaja 共1979兲 and other authors, to the same concept, although there are some aspects in common. In fact, Chistovich and Lublinskaja 共1979兲 and other authors support that in the case of back vowels, whose first two formants 共F1 and F2兲 are typically very close to each other, the HAS does not perceive the two formants separately, but performs instead a spectral integration spanning a frequency range of about 3.5 bark 共or about 350 Hz at low frequencies兲. Thus, stimuli with formants closer than this limit are found to be perceptually equivalent to one peak stimulus, with the peak position determined by the center gravity of the original two peaks 共Lass, 1996, p. 489兲. To a large extent, this is consistent with our experimental findings 共this equivalence does not impact on vowel identity but impacts on signal quality兲, except that the bandwidth of each PSC is not constrained to be 3.5 barks 共as considered by Chistovich and Lublinskaja, 1979兲, but results instead from a magnitude criterion that starts from the center of gravity of each PSC candidate, and captures neighboring harmonic partials according to a magnitude threshold. As a result, a PSC may span a frequency range wider than 3.5 barks 共or even less than this; in fact, some PSCs have been found to be as narrow as a single harmonic partial兲. For each audio frame, a feature vector is therefore obtained as 关vPSC兴T = 关F0,COG1,PSCR,COG2,difdB兴.
共4兲
Figure 7 illustrates the main processing blocks involved in obtaining a PSC feature vector as described in this section. Figure 7 also illustrates the computation of alternative features that will be compared to PSC features in automatic vowel classification tests. The alternative features consist of the frequencies of the first four roots of the LP polynomial that is obtained using the Levinson-Durbin recursion algorithm. The autocorrelation coefficients are obtained using a smooth spectral envelope model 共based on the magnitude of the harmonic partials兲, and by computing an inverse oddDFT transform 共i.e., by taking advantage of the WienerKhintchine theorem10兲. Thus, these alternative features represent formant-like features and will be addressed in Sec. III. III. REFERENCE METHODS OF FEATURE EXTRACTION
In order to evaluate the relative performance of PSC features in classifying high pitched vowel sounds, three alternative techniques of feature extraction are used: plain LP analysis and polynomial root analysis, modified LP analysis and polynomial root analysis as described in Sec. II, and Mel-frequency cepstral coefficients 共MFCC兲 共Davis and Mermelstein, 1980兲. All techniques were configured to proJ. Acoust. Soc. Am., Vol. 122, No. 4, October 2007
FIG. 7. Signal processing algorithm used to estimate PSC features and modified linear prediction features.
cess 1024-sample long audio frames, and presume that the sampling frequency is 32 kHz. In the following each technique is briefly characterized. LPC: The plain LP and polynomial root analysis technique corresponds to the classic technique of formant estimation by finding the poles of the LP filter that models the vocal tract resonances. In our implementation, its main processing steps correspond to 共32 ms兲 Hamming windowing, autocorrelation computation, determination of the coefficients of the all-pole LP filter using the Levinson-Durbin recursion, polynomial root analysis delivering the poles of the LP filter, determination of the angular position of the first four poles 共excluding those over the real axis of the Z plane兲, and denormalization of the angular positions to the Hertz scale, which delivers coefficients F1, F2, F3, and F4. These coefficients correspond roughly to formants, although a strict
Aníbal J. S. Ferreira: Static features in high-pitched vowel recognition
2397
correspondence to the formant concept would require a significant amount of hand-labeling as explained in Sec. I C. Since in this paper an evaluation is desired of fully automatic feature extraction techniques that are amenable to real-time processing, the feature vector of the LP coefficients 共LPC兲 is formed using the above-mentioned F1–F4 values in addition to the pitch frequency, i.e., 关vLPC兴T = 关F0,F1,F2,F3,F4兴.
共5兲
LPC-WK: Another set of four formant-like coefficients are obtained using the algorithm depicted on the left-hand side of Fig. 7 and described in Sec. II B. To a large extent, this algorithm prevents “formants” from locking to the harmonic frequencies and therefore should not replicate the estimation errors of the plain LP technique, as explained in Sec. I. As this technique uses a smooth spectral envelope model and takes advantage of the Wiener-Khintchine theorem, it is conveniently designated as LPC-WK. Although the resulting F1, F2, F3, and F4 coefficient values are different from those of the previous technique, its feature vector is formed in a similar way 共also including F0兲: 关vLPC-WK兴T = 关F0,F1,F2,F3,F4兴.
共6兲
MFCC: MFCC coefficients 共Davis and Mermelstein, 1980兲 are used in almost every state-of-the-art speech recognition system, and therefore represent well established and widely accepted efficient features, despite the fact that their psychophysical interpretation is not obvious. In computing the MFCC coefficients, Slaney’s Auditory Toolbox11 is used after adjusting the MATLAB code for 32 kHz sampling rate processing and 1024-samples FFT analysis. The MFCC feature vector is formed using the 16 MFCC coefficients following the energy coefficient 共i.e., c0兲: 关vMFCC兴T = 关c1,c2, . . . ,c16兴.
共7兲
IV. TRAINING AND TESTING DATABASE
Our motivation in this research is to find static features whose performance in automatic identification of vowels uttered in isolation, approaches human performance, in a speaker-independent way. In addition, the duration of each vowel in the database should be as short as possible while maintaining robust recognition by a human listener 共after proper fading-in and fading-out of the time signal so that artifacts such as clicks are not audible兲. A short duration also has the advantage of making it easier to capture a short audio segment in a stationary region of the recorded vowel utterance, where only static features are significant. Although the shortest time needed for proper recognition of an isolated vowel by a human listener may vary from vowel to vowel, a rather conservative duration for all vowel segments in the database is adopted: 100 ms. In informal verification tests, in which the first 10 ms and the last 10 ms of the 100 ms duration of a vowel signal have been smoothed so as to avoid clicks, it has been confirmed that good identification based on listening was not affected, making it safe to presume 100% correct identification by a human listener. 2398
J. Acoust. Soc. Am., Vol. 122, No. 4, October 2007
FIG. 8. 共Color online兲 Age distribution of the speakers participating in the recordings.
Given that the focus is on vowel recognition of natural utterances at high pitch, for the recordings volunteer speakers 共mainly child and female speakers兲 have been recruited from a kindergarten school, an elementary school, and an university school. In the first two cases, the educators of the prospective volunteer child speakers have been informed about the purpose of the recordings and associated research, and obtained their written permission before the recording session. In total, 27 child speakers, 11 adult female speakers, and 6 adult male speakers participated in the recordings. Figure 8 shows the age distribution of the speakers and it can be concluded that the highest density corresponds to 5 and 9 year old speakers. Each speaker was asked to utter in sequence and in a sustained way, the most common tonic Portuguese vowels: /a/, /e/, /i/, /o/, /u/. Instructions 共by way of example and rehearsal兲 were given so that the duration of each vowel was 1 to 2 s. Particularly with child speakers, in order to make them feel more comfortable and produce more natural 共i.e., not stressed兲 sounds, at most three trials were done before the effective recording. The voice utterances were captured in a quiet room using a laptop 共Compaq-Presario 1500兲, an electret microphone with good frequency response between 50 and 8000 Hz, and an audio editor that was configured for 32 kHz sampling frequency. After the recordings, the vowel sounds were edited and the most stable 100-ms-long region was manually segmented, labeled, and entered into the database. The decision regarding stability was taken by manually selecting a region of the recorded vowel with stable spectrogram, time plot, and sound. A total of 220 共=44 speakers⫻ 5 vowels兲 labeled sounds are included in the database.12 This database was used for both training and testing of the four different feature sets and classification methods 共PSC, LPC, LPC-WK, and MFCC兲, as explained in Sec. V. A preliminary analysis on the pitch of all speakers was performed in order to verify the robustness of the pitch estimation algorithm. This algorithm is a frequency domain pitch estimator that is inspired by Goldstein’s 共1973兲 results. Aníbal J. S. Ferreira: Static features in high-pitched vowel recognition
FIG. 9. Statistical analysis 共mean± standard deviation兲 of the pitch of all speakers. For each speaker, the statistical analysis includes the five vowel sounds in the database.
It is also described in Hess 共1983, p. 425兲, and it takes into account the specificity of the odd-DFT and analysis window 共Ferreira and Sinha, 2005兲. Furthermore, it also takes into consideration 共and therefore is robust to兲 the fact that the harmonic structure of a voiced sound is likely to exhibit missing fundamental or discontinuities. The statistical results are depicted in Fig. 9 for all speakers arranged into four categories. For each speaker, the mean and standard deviation were computed using the pitch automatically estimated for all frames over all five vowel sounds. As each vowel sound in the database is 100 ms long, given that the sampling frequency is 32 kHz, and that the analysis is carried out on 1024-sample frames with 50% overlap; pitch and other features are collected for 5 frames in each vowel. This represents a total of 25 pitch values over all five vowels, for the same speaker. Results in Fig. 9 indicate that pitch ranges are consistent with the expected values for the different categories of speakers, and that some speakers were very “tuned” 共i.e., showed little pitch variance兲, while others exhibited a considerable pitch variance. A more detailed analysis of these cases has revealed that the variance is explained due to intervowel pitch differences and not due to intravowel pitch differences.
V. CLASSIFICATION RESULTS
Each feature vector is modeled as a multivariate Gaussian random variable with mean and covariance matrix C. The statistical behavior of each PSC feature has been observed in order to anticipate 共and better interpret兲 its individual discrimination capability. As an example, Fig. 10 ilJ. Acoust. Soc. Am., Vol. 122, No. 4, October 2007
lustrates the scattergrams of the PSC features for vowel /a/, as a result from the analysis of the complete database 共which corresponds to 44 speakers⫻ 5 frames/ vowel= 220 tokens兲. Each feature scattergram is represented as a function of the pitch frequency. It can be seen that features COG1 and COG2 exhibit a clear dependency on F0, which is denoted by the slope of the illustrated lines that best fit the data in the least-squares sense. This is consistent with a known similar effect regarding formants 共Maurer et al., 1992; Rabiner and Juang, 1993兲. In this regard, it is interesting to note that previous studies with synthesized vowels have revealed vowel identification by humans is less reliable when F0 is high, in which case the transfer function of the vocal tract is sparsely sampled in frequency13 共Diehl et al., 1996; Ryalls and Lieberman, 1982兲. The dependency of PSCR on F0 is not as well evident because of the peculiar representation of its scattergram. In fact, because the right border of each PSC corresponds to a harmonic partial, the scattergram plane is “sampled” according to lines following the rule nRF0, where F0 is the pitch frequency and nR represents the order of the partial on the right border of the PSC. The fact that lines are clearly visible is also evidence that the pitch estimation algorithm is accurate and robust. The difdB feature does not exhibit any relevant dependency on F0 for any vowel. Another perspective can be appreciated by looking at the Gaussian models pertaining to the same PSC feature for all five vowels. As an example, Fig. 11 represents those models for COG1 data. Despite some significant overlap, there are distinctive trends 共which were followed in sketching Fig. 1兲 that are consistent with spectral observations.
Aníbal J. S. Ferreira: Static features in high-pitched vowel recognition
2399
FIG. 10. Scattergrams of the selected four PSC features regarding vowel /a/, as a function of the pitch frequency. The lines in the COG1 and COG2 scattergrams represent the linear models that best fit the data in the leastsquares sense.
A. Classification criterion and test procedure
Our classification criterion is based on the Mahalanobis distance, defined as d2 = 共v − 兲TC−1共v − 兲.
共8兲
In this equation v represents the multivariate feature vector 共test vector兲, and and C represent, respectively, the mean and covariance matrix computed from the training data for a specific vowel. The Mahalanobis distance is very convenient because it takes into account the correlation between variables of the data vector, it automatically ensures appropriate scaling of each variable, and it is reasonably amenable to real-time implementation. Furthermore, by forcing C to be diagonal, it becomes very easy to evaluate the impact of
ignoring the correlation among variables of the feature vector, in which case the Mahalanobis distance reduces to the normalized Euclidean distance. The classification of a test vector results from the evaluation of the Mahalanobis distance to all vowel templates, and the identification is declared for the vowel which minimizes the distance. Classification results have been obtained using a K-fold cross-validation procedure 共Flexer, 2006兲. According to this procedure, the training data and test data are always mutually exclusive. In each run, about 90% of the data is used for training and the remaining 10% is used for testing. Accordingly, in each run of the classifier, the utterances of 40 speakers 共about 0.9⫻ 44兲 were used to build vowel templates, while the utterances of the remaining 4 speakers were used for vowel classification. This procedure was repeated 11 times so that the utterances of a given speaker were included in one test data set. Final classification results were obtained by evaluating the mean, confidence interval, and analysis of variance 共ANOVA兲 of the results of the 11 runs. B. Classification performance
FIG. 11. Gaussian PDF models concerning COG1 data for all five vowels. 2400
J. Acoust. Soc. Am., Vol. 122, No. 4, October 2007
The classification performance of PSC features has been evaluated on an individual basis, and also when all PSC features are used together. In the first case, the objective was to rank PSC features according to its discrimination capability, and in the second case the objective was to assess the impact of ignoring correlations between the different features 共by forcing a covariance matrix to be diagonal兲. The results are displayed in Fig. 12. Three main conclusions can be extracted from Fig. 12. First, the PSCR feature 共i.e., the right border of PSC1兲 exhibits the best individual discrimination capability, which may appear to be a surprising result. However, this is totally in line with observations derived from our Aníbal J. S. Ferreira: Static features in high-pitched vowel recognition
cross-validation procedure. In Table I, the results for each feature set are presented in two versions, a version that uses the full covariance matrix in the Mahalanobis distance, and another version constraining the covariance matrix to be diagonal. As expected, in the latter case, scores are worse than those obtained in the former case, the largest difference 共about 10%兲 being observed when LPC features are used, which indicates that the first four roots of the LP polynomial exhibit a substantial cross correlation. Results in Table I show that while the lowest performance is achieved with LPC features, the best performance is achieved with MFCC features. LPC-WK features and PSC features exhibit similar scores and a paired t-test has therefore been implemented in order to assess the significance of the difference between the means. It was concluded that taking the cross validation results when both methods use full covariance matrices, 兩t兩 = 兩0.1182兩 ⬍ t95%,Dof=10 = 2.23, which indicates that according to a two-tailed t-test at 95% confidence level and with 10 degrees of freedom 共Dof兲, the difference between the means 共88.7− 88.4兲 is not significant. Similarly, taking the cross-validation results when both methods use diagonal matrices, 兩t兩 = 兩0.4148兩 ⬍ t95%,Dof=10 = 2.23, which again indicates that the means do not differ significantly. Therefore, PSC and LPC-WK features exhibit a comparable performance and are effectively able to capture highly discriminative information. This helps to confirm that when pitch information is taken into consideration to smooth the vowel spectrum, prior to LP analysis and root extraction, a more stable spectral envelope is obtained that gives rise to better identification scores. An explanation is that smoothing avoids the “harmonic locking” problem. In general, these results show that to a statistically significant extent, the goal of finding features that are alternative to LP analysis and formant estimation, and that are able to capture discriminative perceptual cues, has been achieved. On the other hand, results also suggest that there are structural similarities between the two methods as will be addressed in Sec. VI. Results regarding MFCC features confirm that they are able to capture discriminative static cues more effectively than all other tested features. An argument could be made that the good performance is in part due to the fact that 16 MFCC coefficients are used, while for LPC and PSC features 5 coefficients are used. Although the dimensionality of the feature vector is an important performance parameter, the author believes that MFCCs have a clear advantage over LPbased spectral envelope modeling: Both spectral peaks and spectral valleys are equally well modeled using MFCCs, and not only spectral peaks as in the case of LP analysis. This
FIG. 12. Overall classification scores for individual features 共COG1, COG2, PSCR, and difdB兲 and for the joint feature vector. In this case, the impact of diagonalizing the covariance matrix is also assessed.
experimental tests that indicate that the right border of the first PSC has a dominant perceptual effect, frequently “overriding” other cues such as the magnitude difference between the first two PSCs 共i.e., the difdB feature兲. Second, the COG2 feature appears to have the lowest individual discrimination capability, which is also in line with evidence resulting from our experimental tests in resynthesizing spectrally modified vowel sounds. Essentially, we have concluded that as long as an appropriate magnitude was assigned to the second PSC, the correct 共perceptual兲 vowel impression was obtained, independent of the fact that COG2 was shifted to the left or to the right by a few hundred hertz. Lastly, the middle-rank position of difdB feature is consistent with the fact that it plays a significant discrimination role only in specific cases, such as in discriminating /o/ from /e/, and in discriminating /u/ from /i/. In case of vowel /a/ for example, the difdB feature appears to be perceptually overridden by the PSCR feature. The performance when all PSC features are used is 88.4% correct identification, and there is a penalty of around 6% if the covariance matrix is diagonalized. This indicates that the PSC features are not mutually independent. This result does not come as a surprise since it could be easily anticipated that there are clear correlations between PSC features; a notable example is the feature pair COG1-PSCR. Table I shows the average correct identification results for all tested feature sets and associated feature extraction procedures. The 95% confidence intervals of the true means are also indicated as a way to express the uncertainty of the
TABLE I. Average percent correct identification and associated 95% confidence interval 共CI兲. Results are presented for each vowel identification method using full or diagonal covariance matrices. LPC
Mean共%兲 95% CI
LPC-WK
PSC
MFCC
Full
Diag
Full
Diag
Full
Diag
Full
Diag
84.2 关80–88兴
73.8 关64–84兴
88.7 关83–94兴
83.7 关78–89兴
88.4 关83–94兴
82.2 关74–90兴
94.0 关89–99兴
90.9 关82–100兴
J. Acoust. Soc. Am., Vol. 122, No. 4, October 2007
Aníbal J. S. Ferreira: Static features in high-pitched vowel recognition
2401
FIG. 13. Boxplots denoting the identification performance of each feature set when full 共f兲 or diagonal 共d兲 covariance matrices are used in the Mahalanobis distance. The notched boxes represent the lower quartile, median and upper quartile values of the classification results. Whiskers extending from each box are representative of all the data and the plus sign represents outliers. The notches represent a robust estimate of the uncertainty about the medians.
fact may play an important role in the recognition performance when MFCC features are used, and suggests that valleys are perceptually relevant. Figure 13 depicts the identification performance of the different methods as evaluated by carrying an ANOVA test on the cross-validation results. Figure 13 confirms our conclusions regarding the relative performance of LPC features and MFCC features. It also suggests that the performance of LPC-WK and PSC features are comparable, although the median resulting from PSC features is ranked higher than the median for LPC-WK features, when full covariance matrices are used in the Mahalanobis classification, in both cases. VI. DISCUSSION
Several important conclusions can be extracted from the classification tests and experimental results. First, when the full covariance matrix is used in the Mahalanobis distance, the scores obtained for all tested feature sets compare favorably to the scores reported by other authors on vowel classification tests at high pitch frequencies. For example, using LP analysis and formant-based approaches, Palethorpe et al. 共1996兲 report about 60% correct identification, and Zahorian and Jagharghi 共1993兲 report about 72% correct identification, while the lowest scores in our tests are on the order of 84% correct identification. In static vowel recognition tests, Hillenbrand and Houde 共2003兲 report that the best percent correct recognition accuracy has been obtained as 85.4%, 79.7%, and 77.2% for men, woman and child speakers, respectively. However, it should be noted that these authors used tests for classification of 10, 11, or even 12 vowels, a considerably more challenging task than classification of 5 vowels. When the covariance matrix is diagonalized, the lowest performance is obtained for the plain LPC features 共i.e., the first four roots of the LP polynomial, in addition to pitch 2402
J. Acoust. Soc. Am., Vol. 122, No. 4, October 2007
frequency兲, on the order of 74% correct identification, which is reasonably in line with results from other authors. While there are no dramatic differences between the presented performance results and those from other authors, there are specific aspects that may account for certain differences. One aspect regards sampling frequency. The audio data considered in this paper is sampled at 32 kHz, while the highest sampling frequency other authors use is 20 kHz. A higher sampling frequency not only gives rise to a more extended spectral characterization, for the same pitch frequency, but also ensures a less perturbed spectral estimation due to aliasing effects. An additional aspect may be related to the fact that our testing conditions are significantly constrained, namely by limiting each utterance to a duration of exactly 100 ms corresponding to a stationary region of the natural speech recording, and also by focusing, as a consequence, on static cues rather than on a combination of static plus dynamic cues. A second important conclusion concerns the influence of the pitch information. In fact, results present clear evidence that LP based classification can be significantly improved by interpolating between the peaks of all the partials pertaining to the harmonic structure of a voiced vowel, as was considered in the LPC-WK feature set. The main advantage is that the poles modeling the resulting spectral envelope14 reflect better perceptual concentrations of signal energy, instead of being distracted by local spectral peaks 共i.e., individual partials of the harmonic structure兲. This fact makes clear that by explicitly including pitch information, LP-WK features and PSC features effectively share some structural aspects. Specifically, in the case of the back vowels /a/, /o/ and /u/, and presuming male speech to simplify the discussion, the F1 and F2 formant frequencies correspond approximately to the COG and right border of the first PSC 共i.e., they correspond approximately to features COG1 and PSCR兲 and, in the case of front vowels /e/ and /i/, F1 corresponds approximately to COG1, and F2 corresponds approximately to COG2. This relation is better illustrated using the spectral representations in Fig. 1. These conclusions also accommodate the suggestion that spectral valleys and spectral slopes on each border of each PSC have relevant perceptual information, which is a topic for further research. This hypothesis is in line with the research of Hillenbrand et al. 共2006兲, which has indicated that in evaluating speech intelligibility, the fine structure of the spectrum has an advantage over a smoothed spectrum preserving the broad peaks of the spectral envelope. An additional important conclusion is that results also provide clear evidence that MFCCs perform better than any other tested feature set in the vowel recognition tests at high pitch. The minimum performance advantage is on the order of 5% 共when a full covariance matrix is used in the Mahalanobis distance兲 and the maximum performance advantage is on the order of 17% when the covariance matrix is diagonalized. These results are very impressive in the face of the fact that MFCCs discard pitch information. It must be noted however that contrary to plain formant estimation based on LP analysis, MFCCs are not distracted by pitch harmonics since there are two stages of spectral smoothing in the computation of MFCC coefficients. One smoothing stage occurs in the Aníbal J. S. Ferreira: Static features in high-pitched vowel recognition
FFT analysis since 50% zero-padding is used. Another smoothing stage occurs in the Mel-scale frequency estimation since the magnitude of FFT frequency bins are accumulated in each Mel band according to a triangular smoothing function 共Davis and Mermelstein, 1980兲. Thus, this spectral smoothing avoiding 共distracting兲 local spectral detail 共such as harmonic peaks兲 is equivalent to the strategy followed in deriving the LPC-WK features, and is equivalent to the Hillenbrand et al. 共2006兲 approach in computing a harmonic envelope in order to build a spectral envelope synthesizer. The main difference between these alternative smoothing criteria lies in the underlying spectral resolution.15 The author believes this aspect plays a relevant role in contributing to the performance of MFCCs. As explained in Sec. V, another important aspect is the fact that MFCC coefficients model the smooth envelope of the Mel-scale spectrum using cepstral techniques which capture information reflecting both spectral peaks and spectral valleys. VII. SUMMARY AND CONCLUSION
In this paper the concept of perceptual spectral cluster has been proposed to model the perceptual processing of the human auditory system in extracting information from stationary voiced sounds, and specifically in identifying vowel sounds at high pitch. According to this concept, an hypothesis is formulated that the human identification of a voiced vowel builds on the preliminary identification of the pitch, harmonic structure, and timbre of the vowel sound. It is further considered that the two most prominent clusters of spectral partials contain sufficient information that is captured by the HAS and allow one to discriminate high pitched vowels, in a robust and reliable way. An algorithm has been proposed that allows the estimation of PSC boundaries in the magnitude spectrum of the vowel signal, and that allows the estimation of PSC 共static兲 features. Using an analysis/synthesis processing environment, we performed a large number of experimental tests assessing the impact on vowel identification by a human, as a result of a spectral manipulation reflecting the influence of PSC features. The four most sensitive PSC features found 共besides pitch frequency兲 have been selected and have been evaluated in automatic vowel identification tests using a classification procedure based on the Mahalanobis distance. In order to benchmark the test results, three alternative feature sets have been used and automatic recognition tests have been repeated using the same methodology and database. The feature sets consist of the angular values of the first four roots of the LP polynomial 共LPC兲, the angular values of the first four roots of the LP polynomial obtained after spectral smoothing using the magnitudes of the harmonic partials 共LPC-WK兲, and MFCC coefficients. The database contains the utterances of 5 Portuguese tonic vowels uttered by 44 speakers, 27 of whom are child speakers with a predominance of 5 and 9 year old speakers. The automatic identification tests have revealed that the best discriminating PSC features are center of gravity and right border of the first PSC. When compared to other feature sets in terms of automatic identification performance, the seJ. Acoust. Soc. Am., Vol. 122, No. 4, October 2007
lected PSC features compare favorably to LPC features, show a performance that is comparable to that of LPC-WK features, and exhibit a performance that is lower than that due to MFCC coefficients. While the PSC concept is inspired by the actual signal processing taking place on the HAS for stationary vowel sounds, the selected PSC static features provide only about 82%–84% correct vowel recognition in test conditions 共100 ms stationary sounds兲 where the human recognition accuracy, in practical terms, is near 100%. These results are, however, encouraging and recommend further research on alternative PSC features, or on a perceptually more appropriate utilization of the pitch information 关in normalizing vowel sounds for example, which is a hypothesis supported by several authors, e.g., de Cheveigné and Kawahara 共1999兲, p. 3506兴, in articulation with PSC features. Not only is this approach in line with Klatt’s 共1982兲 conclusion that “in phonetic distance judgment, a metric is needed that attends to the locations of prominent energy concentrations” but it may also prove to have substantial advantages over MFCC coefficients, namely by facilitating auditory object separation using accurate pitch estimation and harmonic analysis and segregation. In theory, this would would make it possible for PSC features to correctly recognize different simultaneous vowel sounds captured by a single microphone, which is not possible using MFCC features without pitch estimation. ACKNOWLEDGMENTS
The author would like to thank Dr. Lawrence Rabiner and Dr. Sorin Dusan for the many inspiring discussions, and for the diligent help making possible a productive 3-month sabbatical visit to the Center for Advanced Information Processing/Rutgers University in Piscataway, NJ. Special thanks are also addressed to the voluntary speakers and educators and students of Colégio Espinheira Rio and Colégio Nossa Senhora da Paz, in Porto, Portugal, for the support and participation in the recordings of vowel sounds. The author would like to thank the three anonymous reviewers for the comments helping to improve the quality of the paper. This work has been supported by the Portuguese Fundação para a Ciência e Tecnologia under Grant No. SFRH/BSAB/589/ 2006, and by SEEGNAL Research Lda., Portugal. 1
A description of the project and its realizations can be found at the Internet site 具http://www.inescporto.pt/cienciaviva/典 共last viewed on May 12th 2007兲. 2 Besides this main conclusion, the authors also give an important hint: some measure of gross spectral shape might be a more appropriate representation of vowels in the auditory system than spectral peaks. 3 The authors have also concluded that to a large extent, results support the theory of the acoustic-phonetic invariance of vowels. 4 Front vowels are characterized by the fact that the F1 formant is much lower than the F2 formant. 5 Back vowels are characterized by the fact that the first two formants 共F1, F2兲 are very close to each other. 6 This process is also accompanied by top-down perceptual mechanisms 共and not only bottom-up兲, but the focus in this paper is placed on the integration of multiple features in this process. 7 This aspect probably also plays a relevant role in the well-known “cocktail party effect” 共Moore, 1989兲. 8 The sound recordings were normalized in magnitude to 80% of the full dynamic range, prior to digital signal processing.
Aníbal J. S. Ferreira: Static features in high-pitched vowel recognition
2403
9
This value has been found experimentally so as to preserve vowel identity by a human listener, after resynthesis of the vowel with its spectrum modified in magnitude according to the described algorithm. 10 The Wiener-Khintchine theorem states that the autocorrelation and the spectral density form a Fourier pair. 11 This tool box can be found at the following Internet site: 具http:// cobweb.ecn.purdue.edu/⬃malcolm/interval/1998-010/典 共last viewed on May 12th 2007兲. 12 This database is available from the author upon request. 13 These studies also suggest that good identifiability by humans of vowels when F0 is high, confirms the “sufficient contrast hypothesis,” which states that female formant patterns are more dispersed in the vowel space and this provides a compensatory effect. 14 Conceptually, this spectral envelope is similar to the harmonic envelope suggested by Hillenbrand et al. 共2006兲. 15 As pointed out by de Cheveigné and Kawahara 共1999兲, a pertinent issue is to avoid that “smoothing replaces data that are incomplete but correct, with data that are complete but incorrect.” Bladon, R. W. 共1982兲. “Arguments against formants in the auditory representation of speech,” in The Representation of Speech in the Peripheral Auditory System, edited by R. Carlson and B. Granstrom 共Elsevier Biomedical, Amsterdam兲, pp. 95–102. Bruce, I. C., Karkhanis, N. V., Young, E. D., and Sachs, M. B. 共2002兲. “Robust formant tracking in noise,” in IEEE International Conference on Acoustics, Speech and Signal Processing, pp. I281–I284, Orlando, Florida. Chen, B., and Loisou, P. C. 共2004兲. “Formant frequency estimation in noise,” in IEEE International Conference on Acoustics, Speech and Signal Processing, pp. I581–I584, Montreal, Canada. Chistovich, L., and Lublinskaja, V. 共1979兲. “The center of gravity effect in vowel spectra and critical distance between the formants: Psychoacoustical study of perception of vowel-like stimuli,” Hear. Res. 1, 185–195. Davis, S. B., and Mermelstein, P. 共1980兲. “Comparison of parametric representations for monosyllabic word recognition in continuously spoken sentences,” IEEE Trans. Acoust., Speech, Signal Process. 28, 357–366. de Cheveigné, A., and Kawahara, H. 共1999兲. “Missing-data model of vowel identification,” J. Acoust. Soc. Am. 105, 3497–3508. Diehl, R. L., Lindblom, B., Hoemeke, K. A., and Fahey, R. P. 共1996兲. “On explaining certain male-female differences in the phonetic realization of vowel categories,” J. Phonetics 24, 187–208. Dusan, S., and Rabiner, L. 共2005兲. “On integrating insights from human speech perception into automatic speech recognition,” in the Ninth European Conference on Speech Communication and Technology 共Interspeech2005兲, Lisbon, Portugal, pp. 1233–1236. Fant, G. 共1970兲. Acoustic Theory of Speech Production 共Mouton, The Hague兲. Ferreira, A., and Sinha, D. 共2005兲. “Accurate and robust frequency estimation in the odft domain,” in 2005 IEEE Workshop on Applications of Signal Processing to Audio and Acoustics, New Paltz, NY, pp. 203–206. Ferreira, A. J. S. 共1996a兲. “Audio spectral coder,” 100th Convention of the Audio Engineering Society, Copenhagen, Denmark. Ferreira, A. J. S. 共1996b兲. “Perceptual coding of harmonic signals,” 100th Convention of the Audio Engineering Society, Copenhagen, Denmark. Ferreira, A. J. S. 共1998兲. “Spectral coding and post-processing of high quality audio,” Ph.D. thesis, Faculdade de Engenharia da Universidade do Porto-Portugal, Porto, Portugal, http://telecom.inescn.pt/doc/phd_en.html 共last viewed on May 12th 2007兲. Ferreira, A. J. S. 共2001兲. “Accurate estimation in the odft domain of the frequency, phase and magnitude of stationary sinusoids,” in 2001 IEEE Workshop on Applications of Signal Processing to Audio and Acoustics, New Paltz, NY, pp. 47–50.
2404
J. Acoust. Soc. Am., Vol. 122, No. 4, October 2007
Ferreira, A. J. S. 共2005兲. “New signal features for robust identification of isolated vowels,” in the Ninth European Conference on Speech Communication and Technology 共Interspeech-2005兲, Lisbon, Portugal, pp. 345– 348. Flexer, A. 共2006兲. “Statistical evaluation of music information retrieval experiments,” J. New Music Res. 35, 113–120. Goldstein, L. G. 共1973兲. “An optimum processor theory for the central formation of the pitch of complex tones,” J. Acoust. Soc. Am. 54共6兲, pp. 1496–1516. Hermansky, H. 共1990兲. “Perceptual linear predictive 共plp兲 analysis of speech,” J. Acoust. Soc. Am. 87, 1738–1752. Hermansky, H., Hanson, B., and Wakita, H. 共1985兲. “Low-dimensional representation of vowels based on all-pole modeling in the psychophysical domain,” Speech Commun. 4, 181–187. Hess, W. 共1983兲. Pitch Determination of Speech Signals—Algorithms and Devices 共Springer, Berlin兲. Hillenbrand, J. M., and Houde, R. A. 共2003兲. “A narrow band patternmatching model of vowel perception,” J. Acoust. Soc. Am. 113, 1044– 1055. Hillenbrand, J. M., Houde, R. A., and Gayvert, R. T. 共2006兲. “Speech perception based on spectral peaks versus spectral shape,” J. Acoust. Soc. Am. 119, 4041–4054. Honig, F., Stemmer, G., Hacker, C., and Brugnara, F. 共2005兲. “Revisiting perceptual linear prediction 共plp兲,” in the Ninth European Conference on Speech Communication and Technology 共Interspeech-2005兲, Lisbon, Portugal, pp. 2997–3000. Klatt, D. H. 共1982兲. “Prediction of perceived phonetic distance from criticalband spectra—a first step,” in IEEE International Conference on Acoustics, Speech and Signal Processing, Paris, France, pp. 1278–1281. Lass, N. J., ed. 共1996兲. Principles of Experimental Phonetics 共Mosby Year Book, St. Louis, MO兲. Maurer, D., Cook, N., Landis, T., and d’Heureuse, C. 共1992兲. “Are measured differences between the formants of men, women and children due to f0 differences?,” J. Int. Phonetic Assoc. 21, 66–79. Mollis, M. R. 共2005兲. “Evaluating models of vowel perception,” J. Acoust. Soc. Am. 118, 1062–1071. Moore, B. C. J. 共1989兲. An Introduction to the Psychology of Hearing 共Academic, New York兲. Palethorpe, S., Wales, R., Clark, J. E., and Senserrick, T. 共1996兲. “Vowel classification in children,” J. Acoust. Soc. Am. 100, 3843–3851. Plomb, R. 共2002兲. The Intelligent Ear—On the Nature of Sound Perception 共Erlbaum, Mahwah, NJ兲. Rabiner, L., and Juang, B.-H. 共1993兲. Fundamentals of Speech Recognition 共Prentice-Hall, Englewood Cliffs, NJ兲. Ryalls, J. H., and Lieberman, P. 共1982兲. “Fundamental frequency and vowel perception,” J. Acoust. Soc. Am. 72, 1631–1634. Sroka, J. J., and Braida, L. D. 共2005兲. “Human and machine consonant recognition,” Speech Commun. 45, 401–423. Thorpe, C., and Watson, C. 共2000兲. “Vowel identification in singing at high pitch,” in Proceedings of the Eighth Australian International Conference on Speech Science and Technology, Canberra, Australia, pp. 280–286. Vaidyanathan, P. P. 共1993兲. Multirate Systems and Filter Banks 共PrenticeHall, Englewood Cliffs, NJ兲. Wet, F., Weber, K., Boves, L., Cranen, B., Bengio, S., and Bourlard, H. 共2004兲. “Evaluation of formant-like features on an automatic vowel classification task,” J. Acoust. Soc. Am. 116, 1781–1791. Zahorian, S. A., and Jagharghi, A. J. 共1993兲. “Spectral-shape features versus formants as acoustic correlates for vowels,” J. Acoust. Soc. Am. 94, 1966– 1982. Zwicker, E. 共1961兲. “Subdivision of the audible frequency range into critical bands,” J. Acoust. Soc. Am. 33, 248–284.
Aníbal J. S. Ferreira: Static features in high-pitched vowel recognition