for Korean, and the combined âunigram & bigramâ indexing strategy is .... Chinese language we defined and removed a list of 90 most frequent unigrams, 49.
Published in Lecture Notes in Computer Science 4182, 362-373, 2006 which should be used for any reference to this work
1
Statistical and Comparative Evaluation of Various Indexing and Search Models Samir Abdou and Jacques Savoy Computer Science Department, University of Neuchatel, rue Emile Argand 11, 2009 Neuchatel, Switzerland {Samir.Abdou, Jacques.Savoy}@unine.ch Abstract. This paper first describes various strategies (character, bigram, automatic segmentation) used to index the Chinese (ZH), Japanese (JA) and Korean (KR) languages. Second, based on the NTCIR-5 testcollections, it evaluates various retrieval models, varying from classical vector-space models to more recent developments in probabilistic and language models. While no clear conclusion was reached for the Japanese language, the bigram-based indexing strategy seems to be the best choice for Korean, and the combined ”unigram & bigram” indexing strategy is best for traditional Chinese. On the other hand, Divergence from Randomness (DFR) probabilistic model usually results in the best mean average precision. Finally, upon an evaluation of the four different statistical tests, we find that their conclusions correlate, even more when comparing the non-parametric bootstrap with the t-test.
1
Introduction
In order to promote IR activities involving Asian languages and also to facilitate technological transfers into products, the latest NTCIR evaluation campaign [1] created test-collections for the traditional Chinese, Japanese and Korean languages. Given that English is an important language for Asia and that we also wanted to verify that the various approaches suggested might also work well with European languages, a fourth collection of newspaper articles written in English was used. Even with all participants working with the same newspapers corpora and queries, it is not always instructive to directly compare IR performance results achieved by two search systems. In fact, given that their performance is usually based on different indexing and search strategies involving a large number of underlying variables (size and type of stopword lists, stemming strategies, token segmentation, n-grams generation procedures, indexing restrictions or adaptations and term weighting approaches). Based on the NTCIR-5 test-collections [1], this paper empirically compares various indexing and search strategies involving East Asian languages. In order to obtain more solid conclusions, this paper also considers various IR schemes, and all comparisons are analyzed statistically. The rest of this paper is organized as follows: Section 2 describes the main features of the test-collections.
2
Section 3 contains an overview of the various search models, from vector-space approaches to recent developments in both probabilistic and language models. Section 4 portrays the different indexing strategies used to process East Asian languages, and Section 5 contains various evaluations and analyzes of the resultant retrieval performance. Finally, Section 6 compares decisions that might result from using other statistical tests and Section 7 presents the main findings of our investigation.
2
Overview of NTCIR-5 Test-Collections
The test-collections used in our experiments include various newspapers covering the years 2000-2001 [1]. The Chinese and Japanese corpora were larger in size (1,100 MB) but the Chinese collection contained a slightly larger number of documents (901,446) than did the Japanese (858,400). The Korean and English corpora were smaller, both in terms of size (438 MB for the English and 312 MB for the Korean) and number of newspaper articles (259,050 for the English and 220,374 for the Korean). When analyzing the number of pertinent documents per topic, only rigid assessments were considered, meaning that only ”highly relevant” and ”relevant” items were viewed as being relevant, under the assumption that only highly or relevant items would be useful for all topics. A comparison of the number of relevant documents per topic indicates that for the English collection the median number of relevant items per topic is 33, while for the Asian languages corpora it is around 25 (ZH: 26, JA: 24, KR: 25.5). The number of relevant articles is also greater for the English (3,073) corpus, when compared to the Japanese (2,112), Chinese (1,885) or Korean (1,829) corpora. The 50 available topics covered various subjects (e.g., ”Kim Dae-Jun, Kim Jong Il, Inter-Korea Summit,” or ”Harry Potter, circulation”), including both regional/national events (”Mori Cabinet, support percentage, Ehime-maru”) or topics having a more international coverage (”G8 Okinawa Summit”). The same set of queries was available for the four languages, namely Chinese, Japanese, Korean and English. According to the TREC model, the structure of each topic consisted of four logical sections: brief title (), one-sentence description (), narrative () specifying both the background context () and a relevance assessment criterion () for the topic. Finally a concept section () provides some related terms. In our experiments, we only use the title field of the topic description.
3
Search Models
In order to obtain a broader view of the relative merit of the various retrieval models, we examined six vector-space schemes and three probabilistic models. First we adopted the classical tf idf model, in which the weight (denoted wij ) attached to each indexing term tj in document Di was the product of its term occurrence frequency (or tfij ) and its inverse document frequency (or
3
idfj = ln(n/dfj ), where n indicates the number of documents in the corpus, and dfj the number of documents in which the term tj appears). To measure similarities between documents and requests, we computed the inner product after normalizing indexing weights (model denoted ”document=ntc, query=ntc” or ”ntc-ntc”). Other variants might also be created, especially in cases when the occurrence of a particular term in a document is considered as a rare event. Thus, the proper practice may be to give more importance to the first occurrence of a term, as compared to any successive occurrences. Therefore, the tf component might be computed as the ln(tf ) + 1 (denoted ”ltc”, ”lnc”, or ”ltn”) or as 0.5 + 0.5 · [tf / max tf in Di ] (”atn”). We might also consider that a term’s presence in a shorter document would be stronger evidence than its occurrence in a longer document. More complex IR models have been suggested to account for document length, including the ”Lnu” [2], or the ”dtu” IR models [3] (more details are given in the Appendix). In addition to vector-space approaches, we also considered probabilistic IR models, such as the Okapi probabilistic model (or BM25) [4]. As a second probabilistic approach, we implemented the PB2 taken from the Divergence from Randomness (DFR) framework [5], based on combining the two information measures formulated below: � � wij = Infij1 (tf ) · Infij2 (tf ) = −log2 P rob1ij (tf ) · (1 − P rob2ij (tf )) where wij indicates the indexing weight attached to term tj in document Di , P rob1ij (tf ) is the pure chance probability of finding tfij occurrences of the indexing unit tj in the document Di . On the other hand, P rob2ij (tf ) is the probability of encountering a new occurrence of tj in the document given that we have already found tfij occurrences of this indexing unit. Within this framework, the PB2 model is based on the following formulae: � � tf n P rob1ij (tf ) = eλj · λj ij / tfij ! with λj = tcj /n (1) � � tcj + 1 with (2) P rob2ij (tf ) = 1 − dfj · (tf nij + 1) tf nij = tfij · log2 [1 + ((c · mean dl)/li )] (3) where tcj indicates the number of occurrences of tj in the collection, mean dl the mean length of a document and li the length of document Di . Finally, we also considered an approach based on a language model (LM) [6], known as a non-parametric probabilistic model (the Okapi and PB2 are viewed as parametric models). Probability estimates would thus not be based on any known distribution (as in Equation 1) but rather be estimated directly, based on occurrence frequencies in document D or corpus C. Within this language model paradigm, various implementations and smoothing methods might also be considered, and in this study we adopted a model proposed by Hiemstra [6], as described in Equation 4, which combines an estimate based on document (P [tj | Di ]) and corpus (P [tj | C]).
4
�
P [Di| Q] = P [Di ] ·
[λj · P [tj | Di ] + (1 − λj ) · P [tj | C]] (4) with P [tj | Di ] = tfij /li , P [tj | C] = dfj /lc, lc = k dfk , and where λj is a smoothing factor (fixed at 0.3 for all indexing terms tj ) and lc an estimate of the corpus size. tj ∈Q
4
Indexing Strategies
In the previous section, we described how each indexing unit was weighted to reflect its relative importance in describing the semantic content of a document or a request. This section will explain how such indexing units are extracted from documents and topic formulations. For the English collection, we used words as indexing units and we based the indexing process on the SMART stopword list (571 terms) and stemmer. For European languages, it seems natural to consider words as indexing units, and this assumption has been generally confirmed by previous CLEF evaluation campaigns [7]. For documents written in the Chinese and Japanese languages, words are not clearly delimited. We therefore indexed East Asian languages using an overlapping bigram approach, an indexing scheme found to be effective for various Chinese collections [8], [9]. In this case, the ”ABCD EFG” sequence would generate the follow-ing bigrams ”AB,” ”BC,” ”CD,” ”EF,” and ”FG”. Our choice of an indexing tool also involves other factors. As an example for Korean, Lee et al. [10] found more than 80% of nouns were composed of one or two Hangul characters, while for Chinese Sproat [11] reported a similar finding. An analysis of the Japanese corpus reveals that the mean length of continuous Kanji characters to be 2.3, with more than 70% of continuous Kanji sequences being composed of one or two characters (for Hiragana: mean=2.1, for Katakana: mean=3.96). In order to stop bigram generation in our work, we generated overlapping bigrams for Asian characters only, using spaces and other punctuation marks (as collected for each language from its respective encoding). Moreover, in our experiments, we did not split any words written in ASCII characters, and the most frequent bigrams were removed before indexing. As an example, for the Chinese language we defined and removed a list of 90 most frequent unigrams, 49 most frequent bigrams and 91 most frequent words. For the Japanese language, we defined a stopword list of 30 words and another of 20 bigrams, and for Korean our stoplist was composed of 91 bigrams and 85 words. Finally, as suggested by Fujii & Croft [12], before generating bigrams for the Japanese documents we removed all Hiragana characters, given that these characters are mainly used to express grammatical words (e.g., doing, do, in, of), and the inflectional endings of verbs, adjectives and nouns. Such removal is not error-free because Hiragana could also be used to write Japanese nouns. For Asian languages, there are of course other indexing strategies that might be used. In this vein, various authors have suggested that words generated by a segmentation procedure could be used to index Chinese documents. Nie &
5
Ren [13] however indicated that retrieval performance based on word indexing does not really depend on an accurate word segmentation procedure and this was confirmed by Foo & Li [14]. They also stated that segmenting a Chinese sentence does affect retrieval performance and that recognizing a greater number of 2characters words usually contributes to retrieval enhancement. These authors did not however find a direct relationship between segmentation accuracy and retrieval effectiveness. Moreover, manual segmentation does not always result in better performance when compared to character-based segmentation. To analyze these questions, we also considered automatic segmentation tools, namely Mandarin Tools (MTool, www.mandarintools.com) for the traditional Chinese language and the Chasen (chasen.aist-nara.ac.jp) morphological analyzer for Japanese. For Korean, the presence of compound construction could harm retrieval performance. Thus, in order to automatically decompose them, we applied the Hangul Analyser Module (HAM, nlp.kookmin.ac.kr) tool. With this linguistic approach, Murata et al. [15] obtained effective retrieval results while Lee et al. [9] showed that n-gram indexing could result in similar and sometimes better retrieval effectiveness, compared to word-based indexing applied in conjunction with a decompounding scheme.
5
Evaluation of Various IR Models
To measure retrieval performance, we adopted mean average precision (MAP) as computed by TREC EVAL. To determine whether or not a search strategy might be better than another, we applied a statistical test. More precisely, we stated the null hypothesis (denoted H0 ) specifying that both retrieval schemes achieved similar performance levels (MAP), and this hypothesis would be rejected at the significance level fixed at α = 5% (two-tailed test). As a statistical test, we chose the non-parametric bootstrap test [16]. All evaluations in this paper were based on the title-only query formulation. The MAP achieved by the six vector-space schemes, two probabilistic approaches and the language model (LM) are shown in Table 1 for the English and Chinese collections. The best performance in any given column is shown in bold and this value served as baseline for our first set of statistical tests. In this case, we wanted to verify whether this highest performance was statistically better than other performances depicted in the same column. When performance differences were detected as significant, we placed an asterisk (*) next to a given search engine performance. In the English corpus for example, the PB2 model achieved the highest MAP (0.3728). The difference in performance between this model and the ”Lnu-ltc” approach (0.3562) was statistically significant while the difference between it and the Okapi model (0.3692) was not significant. For the Chinese corpus, the PB2 probabilistic model also resulted in the best performance, except for the unigram-based indexing scheme where the best performance was obtained by the language model LM (0.2965). With these various indexing schemes, the difference between either the PB2, the LM, the Okapi or the ”Lnu-ltc” models were not statistically significant. PB2 was the
6
Table 1. MAP for English and Chinese corpora (T queries)
English Model word PB2-nnn 0.3728 LM 0.3428* Okapi-npn 0.3692 Lnu-ltc 0.3562* dtu-dtn 0.3577 atn-ntc 0.3423* ltn-ntc 0.3275* ltc-ltc 0.2509* ntc-ntc 0.2345* Improvement (7 best mod.)
Mean average precision (MAP) Chinese unigram bigram (base) MTool 0.2774 0.3042 0.3246 0.2965 0.2594* 0.2800* 0.2879 0.2995 0.3231 0.2883 0.2999 0.3227 0.2743 0.2866 0.2894* 0.2329* 0.2527* 0.2578* 0.2348* 0.2886 0.2833* 0.1464 0.1933* 0.1772* 0.1162* 0.2130* 0.1645* -5.0% 0% +4.5%
uni+bigram 0.3433 0.2943* 0.3321 0.3356 0.3094* 0.2729* 0.3068* 0.2202* 0.2201* +10.2%
preferred model but by slightly changing the topic set, other models might perform better. Based on an analysis of the four different indexing schemes used with the Chinese corpus, the data in Table 1 indicates that the combined ”uni+bigram” indexing scheme tends to result in the best performance levels. As shown in the last row of this table, we computed mean improvements over the bigram indexing strategy, considering only the 7-best performing IR models (rows ending with the ”ltn-ntc” model). From this overall measure we can see for example that the character-based indexing strategy results in lower performance level than does the bigram scheme (-5.0%). Using the bigram indexing strategy as a baseline, we verified whether performance differences between the various indexing schemes were statistically significant, and then underlined those that were statistically significant. Table 1 illustrates that the differences between the bigram and wordbased indexing strategies (row labeled ”MTool”) are usually not significant. The differences between the bigram approach and the combined indexing strategy (last column) are usually significant and in favor of the combined approach. Table 2. MAP for Japanese corpus (T queries)
Model PB2-nnn LM Okapi-npn Lnu-ltc dtu-dtn atn-ntc ltn-ntc ltc-ltc ntc-ntc Improvement
unigram 0.2240 0.1369* 0.2208 0.2239 0.2126 0.1372* 0.1518* 0.0580* 0.0706* -22.0%
Mean average precision (MAP) bigram (base) Chasen uni+bigram 0.2816 0.3063 0.3026 0.1791* 0.1968* 0.1944* 0.2660* 0.2655* 0.2802 0.2579* 0.2743* 0.2736 0.2461* 0.2735* 0.2735 0.1799* 0.2109* 0.1901* 0.2651 0.2723 0.2726* 0.0992* 0.0945* 0.1154* 0.1292* 0.1227* 0.1295* 0% +7.4% +6.6%
7
Evaluations done on the Japanese corpus are given in Table 2. With this language, the best performing search model was always PB2, often showing significant improvement over others (indicated by ”*”). Comparing the differences between the four indexing strategies shows that both Chasen (automatic segmentation) and the combined indexing approaches (”uni+bigram”) tend to result in the best performance levels. Using the bigram indexing strategy as baseline, the differences between the word (Chasen) or the combined (”uni+bigram”) indexing strategies are however usually not significant. Moreover, performances that result from applying the bigram scheme are always better than with the unigram approach. Table 3. MAP for Korean corpus (T queries)
Model PB2-nnn LM Okapi-npn Lnu-ltc dtu-dtn atn-ntc ltn-ntc ltc-ltc ntc-ntc Improvement
Mean average precision (MAP) word bigram (base) HAM 0.2378 0.3729 0.3659 0.2120* 0.3310* 0.3135* 0.2245* 0.3630* 0.3549 0.2296 0.3973* 0.3560 0.2411 0.3673* 0.3339* 0.2242* 0.3270* 0.2983* 0.2370 0.3708 0.3383* 0.1606* 0.2260* 0.2299* 0.1548* 0.2506* 0.2324* -36.5% 0% -6.6%
Our evaluations on the Korean collection are reported in Table 3. In this case, the best performing search model varies according to the indexing strategy. The performance differences between the best performing models (”dtu-dtn”, ”Lnultc”, PB2) are usually not significant. Using the bigram scheme as baseline, the performance differences with the word-based indexing approach were always detected as significant and in favor of the bigram approach. Comparing bigrams with the automatic decompounding strategy (under the label ”HAM” in Table 3), the bigram indexing strategy tends to present a better performance, but the differences are usually not significant. General measurements such as MAP always hide irregularities found among queries. It is interesting to note for example that for some queries, retrieval performance was poor for all search models. For example, for Topic #4 entitled ”the US Secretary of Defense, William Sebastian Cohen, Beijing”, the first relevant item appears in rank 37 with the PB2 model (English corpus). When inspecting top-ranked articles for this query, we found that these articles more or less contained all words included in the topic description. Moreover, their length was relatively short and these two aspects were taken into account when ranking these documents high in the response list. From a semantic point of view, these short and non-pertinent articles do not specify the reason or purpose of the visit made by the US Secretary of Defense, with content being limited to facts such
8
as ”the US Secretary of Defense will arrive next week” or ”William Sebastian Cohen will leave China tomorrow”. Topic #45 ”population issue, hunger” was another difficult query. After stemming, the query is composed by the stem ”hung” present in 3,036 documents, the indexing term ”populat” (that occurs in 7,995 articles), and ”issu” (appearing in 44,209 documents). Given this document frequency information, it would seem natural to assign more importance to the stem ”hung”, compared to the two other indexing terms. The term ”hunger” however does not appear in any relevant document, resulting in poor retrieval performance for this query. The inclusion of the term ”food” (appearing in the descriptive part of the topic) resulted in some pertinent articles being found by the search system.
6
Statistical Variations
In the previous section, we based our statistical validation on the bootstrap approach [16] in order to determine whether or not the difference between two given retrieval schemes was really significant. The null hypothesis (denoted H0 ) stated that both IR systems produce the same performance level and the observed difference was simply due to random variations. To verify this assumption statistically, other statistical tests could be considered. The first might be the Sign test [17, , pp. 157–164], in which only the direction of the difference (denoted by a ”+” or ”-” sign) is taken into account. This nonparametric test does not take the amount of difference into account, but only the fact that a given system performs better than the other for any given query. For example, for a set of 50 queries, System A produced better MAP for 32 queries (or 32 ”+”), System B was better for 16 (or 16 ”-”), and for the two remaining requests both systems showed the same performance. If the null hypothesis were true, we would expect to obtain roughly the same number of ”+” or ”-” signs. In the current case involving 48 experiments (the two ties results are ignored), we had 32 ”+” and only 16 ”-” signs. Assuming that the null hypothesis is true, the probability of observing a ”+” is equal to the probability of observing a ”-” (= 0.5). Thus for 48 trials the probability of observing 16 or fewer occurrences of the same sign (”+” or ”-”, for a two-tailed test) is only 0.0293. This value is rather small (but not null) and, in this case, when the limit was fixed at α = 5%, we must reject the H0 and accept the alternative hypothesis that there were truly retrieval performance differences between System A and B. Instead of observing only the direction of the difference between two systems, we might also consider the magnitude of the difference, not directly but by sorting them from the smallest to the largest difference. Then we could apply the Wilcoxon signed ranking test [17, pp. 352-360]. Finally, we might apply the paired t-test, a parametric test assuming that the difference between two systems follows a normal distribution. Even if the distribution of the observations was not normally shaped but the empirical distribution found to be roughly symmetric, the t-test would still be useful, given that it is a relatively robust test, in the sense that the significance level indicated is not far from the true
9
level. However, previous studies have shown that IR data do not always follow a normal distribution [16]. Based on 264 comparative evaluations (most of them are shown in Section 5), we applied the four statistical tests to the resultant differences. Among them for all four tests, 143 comparisons were found to be significant and 88 nonsignificant. Thus, for 231 (143+88) comparisons out of 264 (or 87.5%), the four tests resulted in the same decision. These four statistical tests thus are clearly in agreement, even though they use different kinds of information (e.g., for the Sign test, only the difference direction). For the other 33 (264-231) comparisons, there was some disagreement and these cases can be subdivided into three categories. First, in 11 cases, three tests were detected to have a significant difference while the other one did not. Following inspection, we found that in 10 (out of 11) observations only the Sign test did not detect a significant difference by obtaining a p-value greater than 0.05 (see Example A in the second row of Table 4). Second, for 16 cases, two tests indicated a significant difference while the other two did not. After inspecting this sample, we found 8 observations for which both the t-test and the bootstrap detected a significant difference (see for example Case C in Table 4). In 7 other cases, both the Sign and Wilcoxon tests detected significant retrieval performance differences (see Case D in Table 4). Finally, in 6 only one test detected a significant difference while for the three others the performance difference could be due to random variations (see, for example, Case E in Table 4). Table 4. Description and p-value for some comparisons Comparison A. ZH unigram LM vs. ltn-ntc B. JA bigr. vs unigr. atn-ntc vs. atn-ntc C. ZH MTools PB2 vs. dtu-dtn D. JA uni+bigram PB2 vs. Okapi E. KR HAM PB2 vs. Okapi
MAP 0.2965 0.2348 0.1799 0.1372 0.3246 0.2894 0.3026 0.2802 0.3659 0.3549
Sign test 0.0595 (31+ vs. 17-) 0.0186 (32+ vs. 15-) 0.3916 (28+ vs. 21-) 0.0011 (35+ vs. 12-) 0.3916 (28+ vs. 21-)
Wilcoxon 0.0122
Bootstrap 0.0085
t-test 0.0084
0.0073
0.0430
0.0528
0.0574
0.0260
0.0299
0.0040
0.1555
0.1740
0.0297
0.1215
0.1354
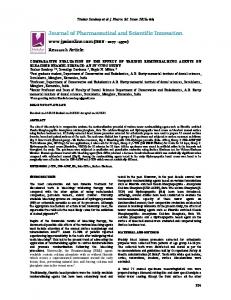
To provide a more general overview of the relationship between two tests, in Figure 1 we plotted the p-values for performance comparisons from the two tests. We also computed the Pearson correlation coefficient and drew a line representing the corresponding slope. The first plot in the top left corner of Figure 1 indicates a strong correlation (r=0.9996) between the bootstrap pvalues and those obtained by the t-test. Clearly, the bootstrap test agrees with the t-test results, without having to assume a Gaussian distribution. We also tested to find out whether or not the differences distribution follows a normal distribution. In 228 (out of 264) observations, the underlying distribution
10
of performance difference did not follow a Gaussian distribution (Shapiro-Wilk test, significance level α = 5% [18]). In both cases, the Pearson correlation coefficient between the bootstrap and t-test p-values is very high. P−value (corr coef= 0.9996 )
P−value (corr coef= 0.8246 )
0.0
0.2
0.4
0.6
0.8
0.8
●
0.4 0.0
1.0
● ●
● ● ●
● ●
●● ●● ● ● ●
● ● ● ● ● ●● ● ●● ● ● ● ● ● ● ● ●● ● ● ● ● ● ● ● ● ● ●● ●●● ● ● ● ● ● ●● ● ●●● ● ● ● ● ● ● ●● ● ● ● ●● ● ● ● ● ● ●● ● ● ● ● ●● ●● ● ●● ● ● ● ● ● ● ● ● ●● ● ● ● ● ● ● ● ● ● ● ●● ● ● ● ● ● ●
●
t−test
0.4 0.0
t−test
0.8
● ●● ● ● ●● ● ●● ● ● ● ●● ● ● ● ● ● ● ● ● ● ● ● ● ● ● ●● ● ● ● ● ● ● ● ● ● ● ● ● ● ● ● ●● ● ●● ● ●● ● ● ● ● ● ● ●● ● ● ● ● ● ●● ● ●● ● ● ● ● ● ● ● ● ● ● ● ● ● ● ●
0.0
0.2
0.4
●●
0.6
0.8
1.0
bootstrap test
Wilcoxon test
P−value (corr coef= 0.709 )
Random (corr coef= 0.0529 )
● ● ●
●
●
●
● ● ●
● ● ● ●● ● ● ● ● ● ●● ● ● ● ●● ● ● ● ● ● ●● ● ● ● ●●● ● ● ● ● ● ● ● ● ● ● ● ● ●
0.0
● ●
0.2
● ● ● ● ● ● ●
● ●● ● ●
0.4
● ●
● ● ● ● ●
● ● ● ● ● ● ● ● ● ● ● ● ● ●
0.6
Sign test
● ● ● ● ● ●
● ● ●
●
● ● ● ● ●
● ● ●
● ● ● ● ●
●
−1
●
●
●
● ●
●
−3
0.4 0.0
t−test
●
●
norm(0,1)
0.8
● ●
●
1 2 3
● ●●
●
0.8
1.0
●●
●
● ●● ● ● ● ● ● ● ●● ●● ● ●●● ● ● ●● ● ●●● ● ● ● ● ● ●● ●● ● ●●●● ● ● ● ● ● ● ●● ● ● ●● ● ● ●● ● ● ● ● ● ● ●● ● ● ● ● ● ● ● ●● ● ● ● ● ● ● ●● ● ● ● ● ●● ●● ● ● ● ● ● ● ● ● ● ● ● ● ●● ●● ● ● ● ●● ●● ● ●● ● ●● ●● ● ●●● ● ● ● ●● ● ●● ● ●● ● ●● ● ●●● ● ● ● ●● ● ● ● ● ● ● ●●● ● ● ● ● ● ●● ● ● ● ●● ●● ● ● ●●● ● ● ● ●●● ●● ● ●● ●● ●● ● ● ●●● ● ●● ● ●●●● ●● ● ● ● ● ● ● ● ● ● ● ● ● ● ● ● ● ● ● ● ● ● ● ●● ●● ● ●● ● ● ● ● ● ● ● ● ● ● ●
−3
−2
−1
0
1
2
●
●
3
norm(0,1)
Fig. 1. Three plots of two related tests (p-values) and a random example
The relationship between the t-test and the Wilcoxon test is not as strong (top right) but still relatively high (Pearson coefficient correlation of 0.8246). When comparing p-values obtained from the t-test and the Sign test, the correlation coefficient is lower (0.709) but statistically different from 0. Finally, we plotted the same number of points obtained by generating values randomly according to the normal distribution. In this case, the true correlation coefficient is a null value, even though the depicted value is not (0.0529). The latter picture is an example of no correlation between two variables.
7
Conclusion
The experiments conducted with the NTCIR-5 test-collections show that the PB2 probabilistic model derived within the Divergence from Randomness framework usually produces the best mean average precision, according to different
11
indexing strategies and languages. For the Chinese language (Table 1), the best indexing strategy seems to be a combined approach (unigram & bigram) but when compared with a word-based approach (obtained with an automatic segmentation system), the difference is not always statistically significant. For the Korean language, the simple bigram indexing strategy seems to be the best. When compared with the automatic decompounding strategy (HAM in Table 3), the performance difference is usually not-significant. For the Japanese language (Table 2), we may discard the unigram indexing approach, but we were not able to develop solid arguments in favor of a combined indexing approach (unigram + bigram), compared to a word-based or a simple bigram indexing scheme. Upon analyzing the decisions that resulted from our application of a nonparametric bootstrap test, the evidence obtained strongly correlated with the (parametric) t-test conclusions. Moreover, the conclusions drawn following an application of the Wilcoxon signed ranking test correlate positively with those of the t-test. From our data, it seems that the Sign test might provide different results than the three other tests, but this divergence is not really important. Acknowledgments. This research was supported in part by the Swiss NSF under Grant #200020-103420.
References 1. Kishida, K., Chen, K.-H., Lee, S., Kuriyama, K., Kando, N., Chen, H.-H., Myaeng, S.H.: Overview of CLIR Task at the Fifth NTCIR Workshop. In Proceedings of NTCIR-5. NII, Tokyo (2005) 1–38 2. Buckley, C., Singhal, A., Mitra, M., Salton, G.: New Retrieval Approaches using SMART. In Proceedings TREC-4. NIST, Gaithersburg (1996) 25–48 3. Singhal, A., Choi, J., Hindle, D., Lewis, D.D., Pereira, F.: AT&T at TREC-7. In Proceedings TREC-7. NIST, Gaithersburg (1999) 239–251 4. Robertson, S.E., Walker, S., Beaulieu, M.: Experimentation as a Way of Life: Okapi at TREC. Information Processing & Management 36, (2000) 95–108 5. Amati, G., van Rijsbergen, C.J.: Probabilistic Models of Information Retrieval Based on Measuring the Divergence from Randomness. ACM Transactions on Information Systems 20 (2002) 357–389 6. Hiemstra, D.: Using Language Models for Information Retrieval. CTIT Ph.D. Thesis (2000) 7. Peters, C., Clough, P.D., Gonzalo, J., Jones, G.J.F., Kluck, M., Magnini, B. (Eds.): Multilingual Information Access for Text, Speech and Images: Results of the Fifth CLEF Evaluation Campaign. Lecture Notes in Computer Science, Vol. 3491. Springer, Berlin (2005) 8. Kwok, K.L. Employing Multiple Representations for Chinese Information Retrieval. Journal of the American Society for Information Science 50 (1999) 709–723 9. Luk, R.W.P., Kwok, K.L.: A Comparison of Chinese Document Indexing Strategies and Retrieval Models, ACM Transactions on Asian Languages Information Processing 1 (2002), 225–268 10. Lee, J.J., Cho, H.Y., Park, H.R.: N-gram-based Indexing for Korean Text Retrieval. Information Processing & Management 35 (1999) 427–441
12
11. Sproat, R.: Morphology and Computation. The MIT Press, Cambridge (1992) 12. Fujii, H., Croft, W.B.: A Comparison of Indexing Techniques for Japanese Text Retrieval. In Proceedings ACM-SIGIR. The ACM Press, New York (1993) 237–246 13. Nie, J.Y., Ren, F. Chinese Information Retrieval: using Characters or Words? Information Processing & Management 35 (1999) 443–462 14. Foo, S., Li, H.: Chinese Word Segmentation and its Effect on Information Retrieval. Information Processing & Management 40 (2004) 161–190 15. Murata, M., Ma, Q., Isahara, H.: Applying Multiple Characteristics and Techniques to Obtain High Levels of Performance in Information Retrieval. In Proceedings of NTCIR-3. NII, Tokyo (2003) 16. Savoy, J.: Statistical Inference in Retrieval Effectiveness Evaluation. Information Processing & Management 33 (1997) 495–512 17. Conover, W.J.: Practical Nonparametric Statistics. 3rd edn. John Wiley & Sons, New York (1999) 18. Maindonald, J., Braun, J.: Data Analysis and Graphics Using R. Cambridge University Press, Cambridge (2003)
Appendix: Term Weighting Formulae In Table 5, n indicates the number of documents in the collection, t the number of indexing terms, dfj the number of documents in which the term tj appears, the document length of Di (the number of indexing terms) is denoted by nti . We assigned the value of 0.55 to the constant b, 0.1 to slope, while we fixed the constant k1 at 1.2 for the English, Korean and Japanese collection and 1.0 for the Chinese corpus. For the PB2 model, we assigned c = 3 for the English and Korean corpus, c = 6 for the Japanese and c = 1 for the Chinese collection. These values were chosen because they usually result in improved levels of retrieval performance. Finally, the value mean dl, slope or avdl were fixed according to the corresponding statistics (e.g., for bigram-based indexing, 321 for ZH, 133 for JA, and 233 for KR). Table 5. Various Weighting Schemes tfij · idfj t 2 k=1 (tfik · idfk )
ntc
wij = √
dtn ltc
wij = [ln(ln(tfij ) + 1) + 1] · idfj [ln(tfij )+1] · idfj wij = √ t 2
dtu
wij =
k=1
([ln(tfik )+1] · idfk )
· idfj (1−slope) · pivot + (slope · nti )
[ln(ln(tfij )+1)+1]
Lnu
wij =
Okapi wij =
� �
ln(tfij )+1 li +1 nti
ln
(1−slope) · pivot + (slope · nti ) (k1 +1) · tfij K + tfij
atn
wij = idfj ·
0.5 + 0.5 · tfij max tfi.
wij = [ln(tfij ) + 1] · idfj � � n−dfj npn wij = tfij · ln dfj ltn
lnc
wij = √
nnn wij = tfij
with K = k1 · (1 − b) + b ·
li avdl
ln(tfij )+1 t 2 k=1 (ln(tfik )+1)
�
�