Oct 5, 2007 - Summary. This paper presents our statistical based intrusion detection framework for computer networks. This framework uses the six sigma ...
IJCSNS International Journal of Computer Science and Network Security, VOL.7 No.10, October 2007
333
Statistical Based Intrusion Detection Framework using Six Sigma Technique Sathish Alampalayam P. Kumar, Anup Kumar, S.Srinivasan* Computer Engineering and Computer Science Department Computer Information Systems Department* University of Louisville, Louisville, KY 40292, USA statistical model for calculating thresholds of critical network parameters. There are several weaknesses in the Summary This paper presents our statistical based intrusion detection current IDA as outlined in section 2.2. To address the framework for computer networks. This framework uses the six intrusion detection related issues, we present an efficient sigma technique to identify the thresholds for the critical network framework that is adaptable, scalable and could predict the parameters. With the help of raw network data, the thresholds security and privacy related attacks at a node or at a identified are used to differentiate normal, uncertain and system level. The proposed model identifies threshold abnormal behavior due to network intrusion. This is then used for level to differentiate the normal, uncertain and abnormal efficient detection and response. We also present a methodology values for the significant network variables and performs of six sigma control analysis for intrusion detection in a network. an efficient vulnerability evaluation based on the values of Performance evaluation of our statistical based intrusion these variables detection approach with related intrusion detection approaches conducted using the benchmark DARPA data are very promising. This paper is organized into five sections. Section 2 gives Key words: the background, motivation, overview and limitations of Threshold, Intrusion Detection, Network Security, Attacks, Six the existing IDAs. It also presents the rationale for our Sigma Control approach. Section 3 presents our proposed statistical based intrusion detection model with its general architecture and methodology of using six sigma control 1. Introduction technique to identify the thresholds for significant network parameters. Section 4 explains the experimentation and In the last decade, there has been a revolution in the wired results for the identification of thresholds for the and wireless computer networking. The possibilities and significant network parameters. It also presents opportunities due to this revolution are limitless; performance evaluation results for the proposed approach unfortunately, so too are the risks and chances of security with the related models. Section 5 presents the conclusion. attacks due to malicious nodes. Intrusion is defined as an attack, a deliberate unauthorized attempt to access information, manipulate information, or render a system 2. Background and Motivation unreliable or unusable [3]. Attack prevention measures like Encryption and authentication can defend only the normal nodes in the network but not the malicious nodes 2.1 Existing Approaches or compromised mobile nodes, which most of the time carry private keys [19]. Thus, completely preventing Recently Intrusion detection has received considerable breaches of security seems unrealistic, especially in attention and the research work in Intrusion detection is Internet, cellular and mobile ad hoc network. We can, being performed with respect to the Internet as well as however, try to detect these attacks so that an action can wireless mobile networks [1, 15 – 18]. There are basically be taken as a countermeasure to prevent the completion of two types of existing threat detection strategies: anomaly the intended attack, or to prevent further damage when a detection and misuse detection [1]. Anomaly detection successful attack has happened. Several techniques for approach analyzes the user’s current session and compares detecting intrusions have been studied. An overview of the them to the profile representing the user’s normal behavior. existing Intrusion Detection Approach (IDA) techniques Since it catches sessions which are not normal, this model can be found in [1-5, 7]. This paper proposes an intrusion is referred to as an ‘anomaly’ detection model [11]. A detection framework for computer networks by identifying typical anomaly detection system takes in audit data for the thresholds for critical network parameters. In this analysis. The audit data is transformed to a format model we have designed and developed a practical statistically comparable to the profile of a user. The user’s
Manuscript received October 5, 2007 Manuscript revised October 20, 2007
334
IJCSNS International Journal of Computer Science and Network Security, VOL.7 No.10, October 2007
profile is generated dynamically by the system (usually using a baseline rule laid by the system administrator) initially and subsequently updated based on the user’s usage. Thresholds are normally always associated to all the profiles [11]. If any comparison between the audit data and the user’s profile results in deviation from a set threshold, an alarm of intrusion is declared. This type of detection system is well suited to detect unknown or previously not encountered attacks [1]. Anomaly detection bases its idea on statistical behavior modeling and anomaly detectors look for behavior that deviates from normal system use. Hence this type of detection is also known as Statistical Based Intrusion Detection Approach (SBID) [11]. Our methodology is based on this approach. Misuse detection approach bases its detection upon a comparison of parameters of the user’s session and the user’s commands to a rule base of techniques used by attackers to penetrate a system. Known attack methods are what this model looks for in a user’s behavior. Since this model looks for patterns known to cause security problems, it is called a ‘misuse’ detection model [1]. A typical misuse detection system takes in audit data for analysis and compares the data to large databases of attack signatures. The attack signatures are normally specified as rules with respect to timing information and are also referred to as known attack patterns. If any comparison between the audit data and the known attack patterns described resulted in a match, an alarm of intrusion is sounded [1]. This type of detection systems is useful in networks with highly dynamic behavioral patterns but like a virus detection system, it is only as good as the database of attack signatures that it uses to compare with [11]. This type of detection is also known as Rule Based Intrusion Detection approach (RBID), since it bases its idea on precedence and rules, and misuse detectors look for behavior that matches a known attack scenario [11]. IDA can also be classified into network-based and hostbased schemes[1]. In either case, these products look for specific patterns that usually indicate malicious or suspicious intent. An IDA is network-based when it looks for these patterns in network traffic collected from network nodes and links. It is host-based when it looks for patterns in the host system log files. Network-based approach (NIDA) listens to the network, and capture and examine individual packets flowing through a network [5]. That is, they use raw network packets as the data source. They typically utilize a network adapter running in promiscuous mode to monitor and analyze all traffic in real-time as it travels across the network. They are able to look at the payload within a packet, to see which particular host application is being accessed, and to raise alerts when attacker tries to exploit a bug in such code. NIDA are typically host-independent but can also be a software package installed on dedicated workstation [5]. Our model
is based on NIDA, since it captures and examines the network traffic for intrusion detection rather than system information. Host-based approach (HIDA) is concerned with what is happening on each individual host. They are able to detect actions such as repeated failed access attempts or changes to critical system files, and normally operate by accessing log files or monitoring real-time system usage [1]. Several SBID based anomaly detection systems have been developed. Some of the example systems include MIDAS, Haystack, IDES, NSM, DIDS and Bro [1]. MIDAS is an expert system based SBID that was developed in National Security Agency's(NSA's) National Computer Security Center (NCSC). It is a heuristic intrusion detection system. IDES is an IDA that combines SBID with RBID to detect a wider range of intrusion attempts [1]. It is a statistical based real time expert system. Haystack is an anomaly detection based on per user profile, and user group profile. Haystack IDS is developed for the Air Force Cryptologic Support Center [18]. Network Security Monitor (NSM) is the first network intrusion detection system based on the monitoring of network traffic. NSM was deployed at major government installations where network traffic analysis provided massive amounts of information. DIDS is a hybrid intrusion detection which is a combination of Haystack IDS and NSM [1]. It is an expert system based distributed IDS. Bro is an open-source, Unix-based Network Intrusion Detection System that passively monitors network traffic and looks for suspicious activity. Bro uses a specialized policy language that allows a site to tailor Bro's operation, both as site policies evolve and as new attacks are discovered [18].
2.2 Limitations of existing SBID approaches Existing SBID approaches suffer from one or more of the following limitations: • Traditionally, IDA are developed using expert knowledge of the system and attack methods. Due to the complexity of modern network system and sophistication of attackers, expert knowledge engineering is often very limited and unreliable [11]. • Some IDA schemes are very sensitive to the data representation. For instance, these schemes may fail to generalize an unseen data if the representation contains irrelevant information. In some instance, it has been observed that training of IDA requires a noise-free data [7]. • An IDA should also be able to distinguish an attack from an internal system fault [4]. • Insider could try slowly to modify its behavior to establish a new behavior pattern and then try to
IJCSNS International Journal of Computer Science and Network Security, VOL.7 No.10, October 2007 perform the attack [11]. •
SBID should determine appropriate threshold for detection. If the threshold is set too low, anomalous activities that are not intrusive are flagged as intrusive resulting in high false positive rate. If the threshold is set too high, anomalous activities that are intrusive are not flagged as intrusive resulting in high false negative rate [4].
Thus, exisitng SBID approaches have practical problems in intrusion detection. The proposed SBID security model addresses these limitations. Our model continuously monitors the online network data and detects the attacks effectively. Our model provides a framework for intrusion detection based on statistics and machine learning concepts. Our model performs the variable selection based on datamining [4], threshold identification based on six sigma methodology and the intrusion detection based on fuzzy multivariate analysis [10]. Thus it has the ability to detect new attacks and control the attacks effectively.
2.3 Rationale for the Proposed SBID security Model To explain the rationale for the proposed SBID security model, let us consider the following attack scenario: Flooding the host by other nodes resulting in DoS attack. In this kind of attack, the agents on the malicious nodes flood the host with requests which can cause resource depletion in the host. This leads to DoS, and affects the request from agents on genuine nodes. Some of the critical network parameters that are affected by this kind of DoS attack are: Packet drop rate: Due to DoS attacks, host nodes are generally not in a position to serve genuine agent nodes. This results in packet drop and hence a significant increase in the measurement of packet drop rate for nodes within the distributed system. Collison Rate: DoS attacks are characterized by the flooding of packets by the intruder or malicious nodes. Hence, a significant increase in the collison rate of the MAC layer of the links of malicous nodes may indicate a DoS attack.
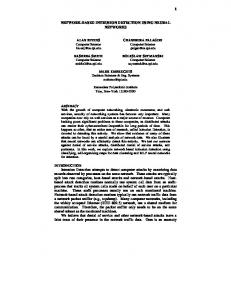
Normal and Vulnerable Network Data
Identification of Critical Parameters Framework
335
Energy consumption: DoS attacks are characterized by the flooding of packets by the intruder or malicious nodes. Hence, a significant increase in the consumption of the energy by malicious nodes in distributed system may indicate a DoS attack. Based on the above scenario, our philosophy is that, by identifying critical network parameters and their threshold values, we could measure the relative change of these parameter values, and detect an attack accurately, without compromising on the network efficiency. This enables the proposed model for on-line real time detection. By ‘real time’ we mean that threat detection is done at the same rate that the network information is captured. By ‘online detection’, we mean that the network information is captured and threat is detected when the nodes are connected to the network. Once an attack is detected, proper level of response measures could be applied, thereby malicious nodes could be isolated from accessing the system or network [10]. The challenge here is in the identification of the threshold values of the critical network parameters to detect these attacks correctly and efficiently. It can be noted that there are similar approaches that monitor the significant attack sensitive parameters to detect attack. However our approach differs in the following ways: In our model, thresholds for the significant attack sensitive network parameters are identified through the six sigma methodology with the help of training dataset. The detection of the attack is based on a measure known as Threat Index that quantifies the vulnerability of the node or network by combining these network parameters through fuzzy multivariate analysis [10]. Once an intrusion is detected, response actions can be taken to protect the network [20].
3. SBID Security Model Architecture 3.1 Proposed SBID Security Model The following Figure 1 shows the architecture of our proposed SBID security model. Its basic framework is described as follows:
Identification of threshold values for parameters Framework
Intrusion Detection Framework
Figure 1. Architecture of proposed SBID security model
Countermeasure Framework
IJCSNS International Journal of Computer Science and Network Security, VOL.7 No.10, October 2007
336 •
•
•
•
Identification of critical network parameters Framework - This framework identifies the critical network parameters that are affected by security attack. Identification of threshold values for critical network parameters Framework - This framework identifies the threshold values for the critical network parameters using six sigma technique. These thresholds are used to differentiate normal, vulnerable and abnormal network state. Intrusion Detection Framework - This framework detects the attack based on the significant parameters and their threshold values using audit trail and sends an alarm to the response and protection framework, if it finds an abnormal behavior. Countermeasures Framework - This framework takes an action as a countermeasure to prevent the completion of the intended attack when an intrusion attempt has been detected, or to prevent further damage when a successful attack has been detected.
In this paper and in the following simulation experiments we focus on the identification of the threshold values for the critical netwok parameters. Our work on the identification of the critical network parameters on which this paper depends on can be seen in [4]. These threshold values obtained in the threshold identification framework forms the basis for the intrusion detection, intruder identification and response. Thus, our goal in the following model simulation and experiments is to identify thresholds for significant network parameters and to evaluate the performance of the threshold based SBID model compared to the related models using the DARPA benchmark dataset .
3.3 Six Sigma identification
methodology for threshold value
Six-sigma is a popular concept among the enterprises. It is being widely used for controlling the processes by the identification of the thresholds of the significant metrics, which are measured with help of the data collected from the process [12-14]. Six-sigma is a data driven approach used to measure quality and is a methodology for eliminating defects [12]. In theory, a six sigma would be approximately two failures per billion attempts. In practice, due to a drift of plus or minus 1.5, six sigma status means less than 3.4 failures per million. This is an extremely low rate of failure. Thus it is more than simply a consideration of standard deviations. Six sigma attempts to reduce these defects to a level below 3.4 failures per million [8]. It has been demonstrated that six sigma
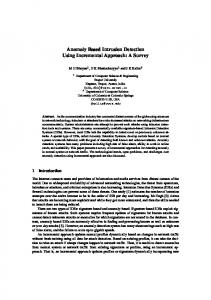
methodologies, integrated with rigorous statistics, can be flexible, powerful and successful without being either overly simplistic or inordinately cumbersome [14]. Hence to achieve extremely low failure rates, six sigma concept is used in our SBID framework to identify the thresholds of the significant network parameters. Here, failure refers to the defect in intrusion detection. This section explains the theoretical foundation of six sigma control technique for threshold value identification. Six-sigma concept is used to calculate the Upper Control Limit (UCL) and Lower Control Limit (LCL) values in order to differentiate the normal, uncertain and vulnerable state of the significant attack sensitive network parameters. We use the subscript ‘us’ to represent ‘uncertain state’ and ‘vs’ to represent ‘vulnerable state.’ These thresholds are used in the fuzzy membership functions of the detection framework for calculating Threat Index (TI). This six-sigma methodology to identify network parameter threshold is applied after the significant parameters are identified with the help of classification trees methodology in the model. The equations that are used to calculate upper and lower control limit values to differentiate normal state, uncertain state and vulnerable state for significant attack sensitive parameters are given below. Theoretical control limits of UCL and LCL for uncertain state are represented as: UCLus =
3σ
μ+
LCLus = μ −
(1)
N
3σ
(2)
N
In equations 1 and 2, UCLus represents a 3 x sigma upwards deviation from the mean value of a variable. LCLus represents a downwards 3 x sigma deviation from the mean value of a variable. For normally distributed output, 99.7% should fall between UCLus and LCLus. This three Sigma quality standard of 99.73% translates to 2,700 PPM failures. Theoretical control limits of UCL and LCL for vulnerable state are represented as: UCLvs =
μ+
LCLvs = μ −
6σ
(3)
N 6σ
(4)
N
In equations 3 and 4, UCLvs represents a 6 x sigma upwards deviation from the mean value of a variable and
IJCSNS International Journal of Computer Science and Network Security, VOL.7 No.10, October 2007 LCLvs represents a downwards 6 x sigma deviation from the mean value of a variable. For normally distributed output, 99.97% should fall between UCLvs and LCLvs. This six Sigma quality standard of 99.97% translates to 3.4 PPM failures and it represents a very conservative upper bound. In equations 1 through 4, µ represents the
UCLvs
337
mean of the N data items, (σ)2 represents the variance which is the average of the square of the distance between each point in a total population (N) and the mean (µ), and σ represents the standard deviation, which is the square root of the variance.
Key
VS
UCLus
US
µ
NS
LCLus LCLvs
Figure 2 Relationship of UCL and LCL with VS, US and NS
When the lower control levels are negative and if those negative values do not make sense for a particular parameter (For example, packet drop and queue length can never be practically negative), only UCLus and UCLvs are taken into consideration to determine threshold for the normal, uncertain and vulnerable state. Here values greater than UCLvs are considered to be under vulnerable state. The values smaller than UCLus are considered to be normal state. Values in between UCLvs and UCLus are considered to be uncertain state. If the lower control levels are not negative or if the negative values are relevant for a particular parameter, both LCLus and LCLvs are taken in to consideration in addition to UCLus and UCLvs for determining thresholds. Here values greater than UCLvs or smaller than LCLvs are considered to be vulnerable state. The values between LCLus and UCLus are considered to be normal state. Values between UCLvs and UCLus or between LCLvs and LCLus are considered to be uncertain state. The relationship between LCL and UCL computed using six-sigma methodology with VS, US and NS is illustrated in the Figure 2. To illustrate the above threshold methodology, let us consider a network variable, packet drop rate, with following set of values: {11, 1, , 2, 22, 1, 1, 2, 15, 16, 1}. The mean (µ) for the above sample is 7.2 and standard deviation is 8.025. The threshold values are identified by computing LCLus, LCLvs, UCLus and UCLvs. As per equations 1 through 4, UCLus, LCLus, UCLvs and LCLvs for the above sample of values are: 14.81, -0.41, 22.426 and 8.026 respectively. As discussed above, since LCLus and LCLvs are negative and negative values do not make sense
for packet drop variable, they are not considered for practical purposes and only UCLus and UCLvs are taken into consideration for setting their threshold. Thus, in the above sample the data point 4 (whose value is 22), data point 8 (whose value is 15) and data point 9 (whose value is 16) is above UCLus (uncertain threshold level) and less than UCLvs (vulnerable threshold level). All other datapoints are less than uncertain levels (UCLus). Thus, at four instances in the above sample the packet drop rate parameter is in uncertain state and at all other instances this parameter is in normal state.
4. Simulation and Experimentations 4.1 Experimentation Setup The baseline input data we used in our simulation experiment is obtained from the DARPA intrusion detection evaluation program [9]. This datafile has the information pertaining to various intrusions simulated in a military network environment. We used a total of 12000 data instances each of which is a 41 dimensional vector. Out of 12000 data instances, 6000 of them are used for training and the rest for testing purposes. Each dimension represents either a qualitative or quantitative variable. Each variable represents an extracted feature from raw network like number of wrong fragments, number of source bytes sent, number of destination bytes received, etc., Overall the data file represents 24 simulated attack types that fall in DoS, probing and unauthorized access
338
IJCSNS International Journal of Computer Science and Network Security, VOL.7 No.10, October 2007
intrusion categories. The experimentation for the log analysis, threshold identification and SBID framework is carried out using the statistical package MiniTab 14.0 [6] and SQL stored procedures.
4.2 Experimentation for Threshold identification for Significant Network Parameters The goal of the experimentation is to find the threshold values for the critical network parameters to detect the intrusion attacks. Thresholds are identified by means of the UCLus, UCLvs, LCLus, and LCLvs values calculated
using the formulas discussed in the section 3. As explained earlier, though LCLus and LCLvs are discussed for the theoretical purposes, these lower control levels are not considered if these LCL values are negative and if it does not make sense for the network parameters considered. Table 1 gives the thresholds obtained for the various significant parameters in the benchmark DARPA dataset [9]. It gives the network parameter name, normal level, uncertain level and vulnerable level for each parameter obtained in the experiment.
Table 1: Normal, Vulnerable and Abnormal Level values for signinficant network parameters Network Parameter
Normal Level
Uncertain Level
Duration Source_Bytes Destination_Bytes Logged_in Root_Shell Num_File_Creations Num_Access_Files Is_Guest_Login Count Srv_count serror_rate Srv_serror_rate Rerror_rate Srv_rerror_rate Same_srv_rate Diff_srv_rate Srv_diff_host_rate
< 0.70934 < 281.8995 < 4751.333 < 0.987273 < 0.002645 < 0.002582 < 0.002015 < 0.007681 < 9.789434 < 12.26683 < 0.00148 < 0.001477 < 0.003227 < 0.003227 < 1.000404 < 0.002377 < 0.111774
0.70934 to 1.069744 281.8995 to 380.8049 4751.333 to 5178.18 0.987273 to 0.994882 0.002645 to 0.004322 0.002582 to 0.00451 0.002015 to 0.003384 0.007681 to 0.011166 9.789434 to 10.25672 12.26683 to 12.83741 0.00148 to 0.002157 0.001477 to 0.002143 0.003227 to 0.005163 0.003227 to 0.005163 1.000404 to 1.001347 0.002377 to 0.003892 0.111775 to 0.123178
In Table 1, the parameter duration represents the length in number of seconds of the connection. Parameter Source_Bytes represents number of data bytes from source to destination. Destination_Bytes represents the number of data bytes from destination to source. Logged_in indicates 1 if successfully logged in and 0 if not successfully logged in. Root_Shell indicates 1 if root shell is obtained and 0 if the root shell is not obtained. Num_File_Creations represents number of file creation operations. Num_Access_Files represents number of operations on access control files. Is_Guest_Login indicates 1 if the login is a “guest” login and 0 if it is not. Count represents number of connections to the same host as the current connection in the past two seconds. srv_count represents number of connections to the same service as the current connection in the past two seconds [9]. serror_rate represents percentage of connections that have “SYN”
Vulnerable Level > 1.069744 > 380.8049 > 5178.18 > 0.994882 > 0.004322 > 0.00451 > 0.003384 >0.011166 > 10.25672 > 12.83741 > 0.002157 > 0.002143 > 0.005163 > 0.005163 > 1.001347 > 0.003892 > 0.123178
errors for the same host connections. Parameter srv_serror_rate represents percentage of connections that have “SYN” errors for the same service connections. rerror_rate represents percentage of connections that have “REJ” errors for the same host connections. srv_rerror_rate represents percentage of connections that have “REJ” errors for the same service connections. Parameter same_srv_rate represents percentage of connections to the same service. diff_srv_rate represents percentage of connections to different services. Parameter srv_diff_host_rate represents percentage of connections to different hosts for the same service connection. Here the “same host” network parameter examines only the connections in the past two seconds that have the same destination host as the current connection. The “same service” network parameters examine only the destination host connections in the past two seconds that provide same
IJCSNS International Journal of Computer Science and Network Security, VOL.7 No.10, October 2007
339
The following metrics are chosen for comparing the performance of SBID approach with PCA, CART and random projection techniques.
service for the current connection. The "same host" and "same service" network parameters are for time-based traffic that is measured continuously [9]. ‘SYN’ error represents the error due to TCP SYN flood attack. A TCP SYN flood sends erroneous TCP requests to the target system, which cannot complete the connection request. ‘REJ’ error indicates that the packets have not been received correctly by the destination node.
Prediction success rate: It is defined as the percentage of whole data that is correctly predicted. This is chosen since accuracy is one of the most important charactersitics of an IDA. A high prediction success rate is desirable for a good IDA. This metric is also known as detection rate. False Positive rate: It is defined as the percentage of normal data instances that have been falsely classified to be vulnerable or intrusive. This parameter represents sensitivity to the noisy training data. A good IDA should adapt better even to the unseen data, even if the data representation has some irrelevant information. Total Processing Time: It is defined as the total time the system takes to analyze a variable and detect the intrusion. This is an important metric since effective intrusion detection should occur in real time and response should be taken before significant damage occurs to the network. Training Time: It is defined as the total time the system takes to train from the input data. This is an important metric since a good intrusion detection should be scalable and hence must handle high dimensional situation, with a large amount of data.
4.3 Performance Evaluation Experimentation This section evaluates the performance of SBID intrusion detection technique with similar models like regression trees, random projection and principal component analysis (PCA). PCA technique is chosen for the comparison because it is the most popular dimensional reduction technique and is the best in the mean square sense. Random projection is chosen since experiments have been conducted to demonstrate that it performs the intrusion detection better than PCA [7]. Classification And Regression Trees (CART) is chosen for their efficient data mining in intrusion detection application [4]. These methods are also evaluated for their performances in reduced dimensions compared to the original dimension. Here, the dimensions or metrics are selected based on the variable importance table generated in the critical parameters identification framework [4]. The higher the variable importance percentage, the more critical is the significant parameter. So at reduced dimensions the variables with higher variable importance percentages are considered.
4.3.2 Experimental Results The accuracy feature of the IDA is shown in Figure 3. It shows the results of SBID in various reduced dimensions compared with the results of random projection, CART and PCA for the prediction success rate metric.
4.3.1 Metrics for Performance Evaluation
Prediction Success Rate (%)
Comprision of Prediction Success Rate 100 98 96 94 92 90 88 86
SBID Random Projection PCA CART
1
5
10
15
20
25
30
35
40
Dim ension of Input Dataset
Figure 3. Comparison of prediction success rate original dimension compared to the other approaches that are considered. Thus, when most significant parameters In Figures 3 through 6, the dimension refers to each are identified and statistical threshold is applied the SBID variable in the input DARPA dataset [9]. For prediction performs way better over the related approcahes. For SBID success rate metric, SBID approach has better prediction approach, at the lowest reduced dimension d=2, the success rate in the reduced dimension compared to the
IJCSNS International Journal of Computer Science and Network Security, VOL.7 No.10, October 2007
340
prediction success rate is at about 99% and reduces to about 94% at d=10. The results for the false positive rate metric is shown in Figure 4. It shows the results for SBID approach in various reduced dimensions compared with the results for random projection, CART and PCA approaches for the false positive rate metric. In the lowest reduced dimension, d=2, the false positive rate for CART is at 7.54%, which is lower compared to the false positive rate at its higher dimension as well as the 14.48% of random projection method, 9% of SBID and 10.2% of PCA model. For false positive rate metric, SBID approach has better false positive rate in the reduced dimension compared to the original dimension and also compared to the other approaches. Thus, when most significant parameters are identified and statistical threshold is applied, the SBID performs way better over the related approcahes.
Figure 5 shows the results for the total procesing time metric (real time detection feature). The results indicate that SBID approach has shorter processing time compared to CART, PCA and random projection approaches at all the dimensions. Thus it is more suitable for on-line real time detection of resource constraint networks. Figure 6 shows the training time of SBID approach compared to other models in different reduced dimensions. It shows the results of SBID model in various dimensions compared with results of random projection, CART and PCA for training time metric. The results indicate that the SBID model requires only shorter training time compared to CART, PCA and random projection. This indicates that the SBID approach is scalable and hence would handle high dimensional data better compared to CART, PCA, and random projection.
False Positive Rate (%)
Comparision of False Positive Rate 16 14 12 10 8 6 4 2 0
SBID Random Projection PCA CART
1
5
10
15
20
25
30
35
40
Dimension of Input Dataset
Figure 4. Comparison of false positive rate
Comparision of Processing Time
Processing Time (s)
50 40
SBID
30
Random Projection
20
PCA CART
10 0 1
5
10
15
20
25
30
35
40
Dim ension of Input Dataset
Figure 5. Comparison of total processing time
IJCSNS International Journal of Computer Science and Network Security, VOL.7 No.10, October 2007
341
Comparision of Training Time
Training Time (s)
8 SBID
6
Random Projection
4
PCA
2
CART
0 1
5
10
15
20
25
30
35
40
Dim ension of Input Dataset
Figure 6. Comparison of training time 5. Conclusion: In this paper we have proposed an SBID model that calculates the thresholds of critical network parameters using six sigma control technique. We presented the methodology of six sigma control analysis for SBID threshold identification. Performance evaluation of the SBID approach with related models conducted on the data collected from the benchmark DARPA dataset demonstrate that the proposed six sigma based SBID model performs better by atleast 25% and 20% for the false positive rate and prediction success rate metrics respectively. Experimental results thus indicate that the proposed SBID model, based on six sigma techniques, can be used to evaluate vulnerability and detect intrusion out of raw network data efficiently.
References [1] S. Axelsson, “Intrusion Detection Systems: A Taxonomy and Survey,” Dept. of Computer Engineering, Chalmers University of Technology, Sweden, Technical Report 99-15, Mar. 2000 [2] W. Lee and S. Stolfo, “A framework for constructing features and models for intrusion detection systems,” ACM Transactions on Information and System Security, vol. 3. no. 4, pp. 227-261, November 2000. [3] Aurobindo Sundaram, “An introduction to intrusion detection,” Crossroads: The ACM Student Magazine, vol. 2, no. 4, pp. 3-7, April 1996. [4] S. P. Alampalayam and A. Kumar, “Predictive security model using data mining,” in Proceedings of IEEE GlobeCom Conference, 2004, pp. 2208-2212. [5] P. Dokas, L. Ertoz, V. Kumar, A. Lazarevic, J. Srivastava, and P. Tan, “Data mining for network intrusion detection,” in Proceedings of NSF Workshop on Next Generation Data Mining, 2002, pp. 25- 36.
[6]
MiniTab [online] available: http://www.minitab.com/products/minitab/14/ accessed on Mar 2005. [7] H. Deng, Q. Zeng, and D. P. Agrawal, "Network intrusion detection system using random projection technique,” in Proceedings of the International Conference on Security and Management, 2003, pp. 10-16. [8] F. W. Breyfogle, Implementing Six Sigma: Smarter Solutions Using Statistical Methods. NY: John Wiley and Sons, 2003. [9] Hettich, S. and Bay, S. D. (1999). The UCI KDD Archive[http://kdd.ics.uci.edu]. Irvine, CA. [10] S. P. Alampalayam and A. Kumar, “An adaptive and predictive security model for mobile ad hoc networks,” Kluwer Personal Communications Journal, Security Special Issue for Next Generation Wireless Networks, vol. 29, pp. 263-281, June 2004. [11] M. Gerken, "Statistical-Based Intrusion Detection"; accessed on Aug 2007, [URL] http://www.sei.cmu.edu/str/descriptions/sbid.html. [12] M. S. Raisinghani, H.Ette, R.Pierce, G.Cannon, and P.Daripaly, “Six Sigma: concepts, tools, and applications”, Journal of Industrial Management & Data Systems, 2005, Vol. 105, No. 4, pp. 491-505. [13] D.W. Cooper, J.V. Babcock, F. DiPietro, “Application of Six Sigma Statistical Quality Control to Monitoring the Deposition of Contaminating Particles”, Journal of IEST, Vol. 35 No. 5, 1992, pp. 27-32. [14] Johannes Freiesleben, “Communicating six sigma's benefits to top management”, Journal of Measuring Business Excellence, 2006, Vol. 10, No. 2, pp. 19-27. [15] S. P. Alampalayam, A. Kumar, and S. Srinivasan, “Mobile ad hoc networks security – a taxonomy,” in Proceedings of ICACT Conference, 2005, pp. 839-844.
342
IJCSNS International Journal of Computer Science and Network Security, VOL.7 No.10, October 2007
[16] P. Brutch and C. Ko, “Challenges in intrusion detection for wireless ad hoc networks,” in Proceedings of Symposium on Applications and the Internet Workshop, 2003, pp. 368-373. [17] A Survey on Intrusion Detection in Mobile Ad Hoc Networks T. Anantvalee, J. Wu, Wireless/Mobile Network Security-Chapter 7, 2006 [18] P. Kabiri and A.Ghorbani, “Research on Intrusion Detection and Response: A Survey”, International Journal of Network Security, Vol 1. No 2, Sep 2005. [19] Y. Zhang, W. Lee, and Y. Huang, “Intrusion detection techniques for mobile wireless networks,” Wireless Networks, vol. 9 no. 5, pp. 545-556, September 2003. [20] S. P. Alampalayam, A. Kumar, J. Graham, and S.Srinivasan, “Intruder Identification and Response Framework for Mobile Ad hoc Networks,” in Procceeding of International Conference
on Computers And Their Applications, March 2007.