Statistical Block-Based DWT Features For Digital Mammograms Classification Berraho Sanae* , El Margae Samira
Ait Kerroum Mounir , Fakhri Youssef
LARIT, Faculty of Sciences, University Ibn Tofail Kenitra, Morocco Email:
[email protected]
LARIT, Faculty of Sciences, University Ibn Tofail Kenitra, Morocco
Abstract—Breast cancer is one of the most dangerous types of cancer among women all over the world. If breast cancer is detected in early stage, chances of survival are very high. Mammography is broadly recognized as the most effective imaging modality for early detection of breast abnormalities. Several research works have tried to develop Computer Aided detection/Diagnosis systems (CAD) in order to help radiologists to reduce the variability in the analysis and improve the precision in mammograms interpretation. This paper presents an efficient classification of mammograms using feature extraction. In this approach we propose to use comprehensive statistical Block-Based features, derived from all sub-bands of Discrete Wavelet decomposition. The classification of these features is performed using the Support Vector Machine (SVM). The evaluation of the proposed method is applied on Digital Database For Screening Mammography (DDSM). The system classifies normal from abnormal cases with high accuracy rate (96%). Comparative experiments have been conducted to evaluate our proposed method .
Keywords: Mammograms classification, Discret Wavelet Transform, Statistical Features, Support Vector Machine. I. I NTRODUCTION Breast cancer is a leading cause of death among all cancer diseases for middle-aged and older women. It has been proved that an early detection of the disease can help strongly to enhance the expectancy of survival [1]. X-ray mammography is the clinical gold standard for this early detection [2]. However, mammographic images are complex, textured, and there is a considerable variation across the screening population, leading to difficulties in detection and diagnosis. There is a clear need for methods of automatic detection of suspicious tissue in mammograms. Currently, automated analysis of digital mammograms is an active research field: Many Computer Aided Diagnosis (CAD) Systems have been proposed to help radiologists for mammogram analysis, and potentially reduce the number of diagnostic errors [3]. Most computer-aided detection and diagnosis algorithms in mammographic image analysis consist of few typical steps: pre-processing, segmentation, feature extraction, and classification [4][5]. Feature extraction is an important factor that directly affects the classification result in mammograms analysis. In this context several image processing techniques have been employed to process mammograms for feature extraction
and regions of interest (ROIs) classification. Apart from several others, the most popular mammograms analysis algorithms, are based on global features such as Principal Component Analysis (PCA)[6], Linear Discriminant Analysis (LDA)[7], Independent Component Analysis (ICA)[8], Zernike Moments[9], Discrete Cosine Transform (DCT) [10] and Discret wavlet transform [11]. Of multi-resolution approaches, the DWT remains the most used due to the its relative simplicity while simultaneously allowing signal analysis at different time and frequency scales, and its ability to provide an efficient representation for images [12]. In [13], two techniques are proposed based on statistical and LBP features using support vector machine (SVM) and the k-nearest neighbor (KNN) classifiers. The evaluation of the system is applied on Digital Database for Screening Mammography (DDSM). In [14], a new methodology to automatically extract features from mammograms for classification is presented. The approach consists of combining the discrete wavelet transform (DWT) and the Radon transform (RT). First, the DWT is employed to obtain the mammogram’s high-high (HH) sub-band image. Next, the RT is applied to the latter with four different orientations to obtain four RT signals whose energies and entropies are computed. Then, these statistics are fed to a support vector machine (SVM) with polynomial kernel to distinguish between normal mammograms and those showing malign microcalcifications tumours. In this work, we aim to improve the performance of the current mammogram classification methods to differenciate between normal and abnormal cases by describing the concept of an aproach representing mammograms with statistical features such as mean , entropy and standard deviation dirived from all sub-bands of DWT decomposition. The classification of these features is performed using the Support Vector Machine (SVM) [15]. The decision to use these features and Support Vector Machines was taken for many reasons: the DWT is powerful at providing sparse and efficient image representations, it performs a multiresolution analysis allowing representation in both time and frequency domains [12]. It has been observed that with added features, the classifier performance might degrade if the features space is very high [17].
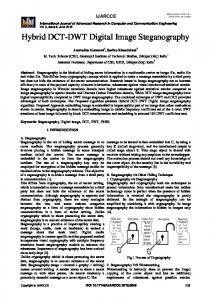
This phenomenon is referred to as the curse of dimensionality. Among the classifiers available in the literature, SVM comes off since it deals with sets of high dimensionality non-linear data with much accuracy and computational efficiency. The proposed method achieves high accuracy. This is proved trough the experiment results on DDSM database. In our experiments, the effectiveness of our proposed method has been successfully demonstrated by making comparisons with other feature extraction methods. In addition, experimental results show that the choice of SVM’s Kernel could result in better classification accuracy. The remaining of this paper is organized as follows: Section II summarizes some of the important properties of DWT and Statistical features as means of feature extraction. In section III a brief description of Mammographic images classification based SVM is given. The proposed methodology is presented in section IV. In section V we present the database of mammographic images. In Section VI, the experimental results achieved by the proposed approach and discussion are presented, While section VII contains the conclusions and perspectives of this study. II. F EATURE EXTRACTION METHODS Feature extraction is considered as the most effective step in mammographic images classification. The purpose of this step is to reduce the original data by measuring certain properties, or features, that distinguish one input pattern from another. In this section we present a description of DWT and some selected statistical features calculated from all sub-bands of DWT decomposition. A. Discret Wavelet Transform (DWT) The two-dimensional discrete wavelet transform (2D-DWT) [18] decomposes an image in terms of spectral/spatial frequency components that describe the image texture. It does so by decomposing the image into sub-bands according to an iterative and recursive process. Fig. (1) illustrates the case of a 2D-DWT image decomposition. The image is first represented by the LH1, HL1 and HH1 sub-bands that encode the image details and the LL1 sub-band which provides an approximation of it. The process can be repeated for more levels of decomposition if a finer granularity is sought. The obtained coefficients values for the approximation and detail sub-band images are useful features for texture categorization [19] [20]. To obtain the set of features that characterize a given texture image, the 2D-DWT wavelet transform is used to find its spectral components. This allows transforming each texture image into a local spatial/frequency representation by convolving the image with a bank of filters. Then, the image features are extracted from the obtained 2D-DWT representation. The computation of the 2D-DWT proceeds from that of the 1DDWT, the discrete version of the one-dimensional continuous wavelet transform. The one-dimensional continuous wavelet transform of a function f is defined by:
Fig. 1. One level 2D-DWT decomposition of an image
f (x) =
X
ci,j , ψi,j (x)
(1)
i,j
Z
+∞
ci,j =
∗ f (x)ψi,j
(2)
−∞
where ψi,j () stands for the wavelet functions and ci,j are the corresponding coefficients for f . A mother wavelet ψ() is used to generate the wavelet basis functions by using translation and dilation operations: ψi,j (x) = 2−i/2 ψ(2−i x − j)
(3)
where j and i are the translation and dilation parameters, respectively. The one-dimensional wavelet decomposition can be extended to two-dimensional objects by separating the row and column decompositions [21]. For instance, the 2D-DWT is achieved by alternating row and column filtering in each level with iteration from the LL (low-pass/low-pass) subband as shown in Fig. (1). At each step, two sub-images are created with half the number of pixels of the row or column that was processed. In the end, a M × N image is decomposed into 4 sub-images, each with M/2 × N/2 resolution. Let H be a low-pass filter and G a high-pass filter, a wavelet decomposition of an Image is represented in Fig. (2). B. Statistical Features In general, any image processing and analysis applications would require a particular feature for classification. Mainly statistical features are of more significant in pattern recognition area [22]. To reduce the computational complexity, only some of these features were ued. We have selected three features: mean, standard deviation and entropy (Table 1). They are chosen since they are widely used in pattern recognition [23]. This features are calculated from the four obtained DWT subbands. III. SVM FOR M AMMOGRAMS C LASSIFICATION SVM are a kind of machine learning methods based on mathematical foundations of statistical learning theory, which was proposed first by Vapnik in 1992 [24]. It is a supervised learning technique that can be used for classification and regression. SVMs have a firm statistical foundation and are guaranteed to converge to a global minimum during training. The goal of SVM is to produce a model which predicts target
Fig. 2. Wavelet decompsition of an image
Radial basis function (RBF):
TABLE I D ESCRIPTION OF THE USED S TATISTICAL F EATURES
Feature
Expression
Average intensity value
Mean
µ=
Standard Deviation
δ=
PL−1
(zi − m)2 p(zi )
Dispertion of values
Entropy
e=
PL−1
p(zi )log2 p(zi )
Measure of randomness
i=0
i=0
zi p(zi )
z is a random variable indicating intensity. p is the probability density of the ith pixel in the histogram. L is the total number of intensity levels.
value of data instances in the testing set which are given the attributes [25]. Given a training set of instance-label pairs {xi , yi }, i = 1, ..., l where xi ∈ R and y ∈ {−1, 1}l , the support vector machines require the solution of the following optimization problem: l
X 1 ξi min(w,b,ξ) wT w + C 2 i=1
(4)
yi (wT φ(xi ) + b) ≥ 1 − ξi , ξi ≥ 0
(5)
Subject to :
Here training vectors xi are mapped into a higher (maybe infinite) dimensional space by the function φ. Then SVM finds a linear separating hyper plane with the maximal margin in this higher dimensional space. C > 0 is the penalty parameter of the error term. We can define, K(xi , xj ) = φ(xi )T φ(xj ) called the kernel function. Though new kernels are being proposed by researchers, the most common four basic kernels are: Linear: K(xi , xj ) = xTi xj (6) Polynomial: K(xi , xj ) = (γxTi xj + r)d , γ > 0
(8)
K(xi , xj ) = tanh(γxTi xj + r)
(9)
Sigmoid:
Meaning
PL−1 i=0
K(xi , xj ) = exp(−γ||xi − xj ||2 ), γ > 0
(7)
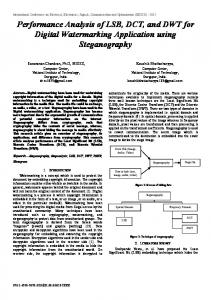
Here, γ,r, and d are kernel parameters. The SVM, in essence, is a binary classification algorithm, that is it can deal only with two class problems. Some approaches have been proposed to construct multi-class SVM, such as ”all-together” methods, ”one-against-all” and ”oneagainst-one”. Also SVM are known to have a good generalization and overcome the curse of dimension in both computation and generalization [26]. The later characteristic is highly beneficial to perform mammograms classification. IV. P ROPOSED M ETHOD The proposed method aims to classify normal from abnormal cases in mammographic images, Fig.(3) presents the diagram illustrating the proposed algorithm: 1) A cropping process is done manually given the center of abnormality, the ROIs are selected with size (128×128) pixels. 2) The DWT is applied to a ROI to obtain its four subbands. 3) Each sub-band image is divided to (N × N ) blocks. 4) Three statistical features (mean, standard deviation, entropy) are calculated from blocks. 5) The resulting features set is used as input data to SVM classifier. V. M AMMOGRAMS DATA S ET The experiments carried out in this work used the Digital Database for Screening Mammography (DDSM) [27], which is publicly available for research. The DDSM contains more than 2500 cases of mammograms from several medical institutions in the USA. This data set is selected because of the various cases it includes. It is also widely used in similar research works. In DDSM, mammogram images are digitized by different scanners with different resolutions. In
Fig. 3. Diagram of the proposed Method
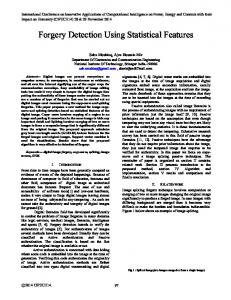
this research, for data consistency purposes, all images are collected from the same type of scanner and resolution. We chose the scanner type Howtek 960 because a large number of cases are digitized by this type in DDSM [27]. From this data set one hundred digital mammograms were taken. They consisted of fifty normal and fifty abnormal images. VI. E XPERIMENTAL RESULTS AND DISCUSSION A. Experiment Setup In the experimental level, the main problem covered is to distinguish between normal and abnormal mammographic images. Extraction of Regions of interest is an essential step in a complete CAD system, however it is not in the scope of this work. This is the reason why we performed on manual cropping of ROIs. Most of similar research works use ROIs of (128 × 128) pixels [28][29] which matched with the most abnormalies size. Given coordinates of the center of abnormality, 100 regions were extracted with size (128 × 128) pixels. An example of cropping is given in Fig. (4). Fig. (5) shows some examples of ROIs.
into a single features vector. Different values of N {8, 16, 32, 64, 128} are considered to see the effect of different number of blocks on the classification rate. In this work, two types of output classes are defined in the classification: normal and abnormal. The SVM classifier is used to classify the features vector. Using the prepared dataset, a model of experiment is performed. The data proportion applied is as stated below: 1) Training - 50% (50 image for training) 2) Testing - 50% (50 image for testing) Some experiments also have been conducted to measure the performance of support vector machines (SVM), especially SVM with RBF, linear and polynomial kernels. In addition, To test the effectiveness of Statistical Block-Based DWT as a mean of feature extraction, the performance of this method is compared against other comonly used methods in terms of classification accuracy. Classification accuracy for any diagnostic system can be defined as the number of images classified correctly with respect to the total number of images tested as given in equation (10). Classification Accuracy =
No.of images classified correctly Total no. of test images (10)
B. Results and Discussions
Fig. 4. (a) Original image (3601 × 6404), (b) Cropped image (128 × 128)
In this work we apply the wavelet DB1 with level 1 on the selected ROIs. Then, three main features which are mean, standard deviation and entropy are computed for LL1, HL1, LH1 and HH1 resulting sub-bands. This is done by dividing a sub-band image into several blocks basis of N by N pixels. The obtained features from the blocks are then concatenated
SVM classification approach is applied to our selected data with different kernel functions: RBF, linear and polynomial. In general, RBF kernel is a reasonable first choice when we want to implement SVM. RBF kernel non-linearly maps the feature vectors into a higher dimensional space and therefore, unlike the linear kernel, it can handle the case when the relation between class labels and attributes is nonlinear [30]. First we checked the performance of SVM with RBF kernel on the selected ROIs with different block sizes. This kernel have its own parameters which need to be optimized in order to improve the performance rate of the classifier [31]. The result(Table II) reveals that performing classification on the Statistical Block-Based DWT input vector with SVM using
Fig. 5. Sample of the used ROI’s:(a-c)Normal ROIs (d-f)Abnormal ROIs.
RBF kernel gives the best classification rate (74%) at 8 × 8 blocks. TABLE II P ERFORMANCE OF SVM WITH RBF KERNEL USING S TATISTICAL B LOCK -BASED DWT FEATURES SET
TABLE IV P ERFORMANCE OF SVM WITH P OLYNOMIAL KERNEL USING S TATISTICAL B LOCK -BASED DWT FEATURES SET Kernel
Block Size 8×8 16 × 16 32 × 32 64 × 64 128 × 128
Polynomial Kernel
RBF
Block Size 8×8 16 × 16 32 × 32 64 × 64 128 × 128
Accuracy 74% 82% 62% 60% 60%
We now examine the performance of SVM with linear kernel. Unlike the rest of the kernels, this kernel has only one tunable parameter (c) [30]. Similar to the previous case, we also compared the performance of SVM as we used different block sizes: The best classification rate (96%) is obtained at 8 × 8 blocks. Results are shown in table III.
TABLE III P ERFORMANCE OF SVM WITH L INEAR KERNEL USING S TATISTICAL B LOCK -BASED DWT FEATURES SET Kernel
Linear
Block Size 8×8 16 × 16 32 × 32 64 × 64 128 × 128
Accuracy 96% 92% 76% 66% 64%
in parameter selection process. Moreover, it also have less numerical difficulties than polynomial kernel. For comparison purposes, two commonly used feature extraction methods were implemented and evaluated using SVM with linear kernel on 8 × 8 blocks: • DWT: (Section 2) In order to check the effect of computing statistical features from the resulting DWT decomposition sub-bands, we perform only a DWT ROIs decomposition . • LBP : The Local Binary Pattern is a non-parametric operator which summarizes the local spacial structure of an image. It was first introduced by Ojala et al. [32] who showed the high discriminative power of this operator for texture classification. At a given pixel position (xc , yc ), LBP is defined as an ordered set of binary comparisons of pixel intensities between the center pixel and its eight surrounding pixels.
ACCURACY
Table IV gives the performance of SVM with polynomial kernel on the selected ROIs from DDSM database. This kernel depends on its degree parameter which affects the classification performance with its variations along with other associated parameters. In our case the optimal degree of polynomial kernel is quadratic (2). The best classification rate (96%) is obtained at 8 × 8 blocks. Results from tables II,III,IV support the idea that in our case, SVM classifier gives better accuracy using linear and polynomial kernels at 8 × 8 blocks. If the number of features is large, one may not need to map data to a higher dimensional space [30]. That is, the nonlinear mapping does not improve the performance. Using the linear kernel is good enough, and one only searches for the parameter C. For these reasons we prefer linear kernel because its parameters are fewer than those of polynomial kernel, and therefore have less complexity
Accuracy 96% 90% 72% 60% 64%
OF
LBP
Approch Accuracy
AND
TABLE V DWT FEATURES AGAINST PROPOSED
LBP-SVM 72%
DWT-SVM 94%
METHOD
proposed 96%
Table V presents a comparaison between the proposed method, DWT and LBP approaches. In the first method (DWT) we apply the wavelet Daubechies (DB1) with level 1 on the selected ROIs. This result reveals that the block based statistical extracted features in our preposed method lead to an accuracy improvement by 2%. In the second method, for each ROI the LBP features are extracted to create the features vector to be passed to the SVM classifier. The classification rate achieves (72 %). Our experiment results suggest that the accuracy of the proposed system with Statistical block based DWT features set (96 %) is better compared to DWT (94%) and LBP features
sets (72%). VII. C ONCLUSION In this paper we have presented a method for digital mammograms classification. We have discussed the Statistical Block-Based DWT features with support vector machines (SVM). The evaluation of the system is carried out on some selected images from the DDSM dataset. The experimental results indicate that the use of the proposed method in mammograms classification (normal/abnormal) is promising, since it achieves accuracy rates of over 96%. It gives a better performance as compared to some other methods (DWT and LBP). A good choice of Kernel function is very important for effective SVM based classification, experiments prouve that, in our case, SVM with linear kernel would result in better performance if compared to RBF and polynomial kernels. Future works consist on testing the performance of the proposed method for more than two classes including the classification of abnormal mammograms into benign and malignant class. VIII. ACKNOWLEDGEMENT We wish to thank all those listed in this work, and any other reviewer whose name has been inadvertently omitted, for giving their time and expertise to review papers submitted for publication in SITA’14 proceedings. Every effort has been made to ensure the accuracy of the list, we apologize for any errors and omissions. R EFERENCES [1] C. Venanzi, A. Bergamaschi, F. Bruni, D. Dreossi, R. Longo, A. Olivo, S. Pani, E. Castelli, A digital detector for breast computed tomography at the SYRMEP beam line, Nuclear Instruments and Methods in Physics Research Section A: Accelerators, Spectrometers, Detectors and Associated Equipment 548 (2005) 264–268. [2] R.B. Dubey, M. Hanmandlu, S.K. Gupta, A comparison of two methods for the segmentation of masses in the digital mammograms, Computerized Medical Imaging and Graphics 34 (3) (2010) 185-191. [3] S. Lahmiri and M. Boukadoum, “DWT and RT based approach for feature extraction and classification of mammograms with SVM,” in 2011 IEEE Biomedical Circuits and Systems Conference (BioCAS), 2011, pp. 412–415. [4] Q. Abbas , M. E . Celebi, I.F. Garcia : ”Breast mass segmentation using region-based and edge-based methods in a 4-stage multiscale system”, Biomedical Signal Processing and Control, Volume 8, Issue 2, March 2013, Pages 204-214, ISSN 1746-8094, [5] H.D. Chenga ,J. Shan ,W. Ju , Y. Guo, L. Zhang ”Automated breast cancer detection and classification using ultrasound images: A survey” Pattern Recognition, Volume 43, Issue 1, January 2010, Pages 299-317, ISSN 0031-3203 [6] Zhaohui Luo; Xiaoming Wu; Shengwen Guo; Binggang Ye, ”Diagnosis of Breast Cancer Tumor Based on PCA and Fuzzy Support Vector Machine Classifier,” Natural Computation, 2008. ICNC ’08. Fourth International Conference on , vol.4, no., pp.363,367, 18-20 Oct. 2008 [7] Yu-Shun Cho; Chiun-Li Chin; Kun-Ching Wang, ”Based on Fuzzy Linear Discriminant Analysis for Breast Cancer Mammography Analysis,” Technologies and Applications of Artificial Intelligence (TAAI), 2011 International Conference on , vol., no., pp.57,61, 11-13 Nov. 2011 [8] Chao-Yong Wang; Chun-Guo Wu; Yan-Chun Liang; Xin-Chen Guo, ”Diagnosis of Breast Cancer Tumor Based on ICA and LS-SVM,” Machine Learning and Cybernetics, 2006 International Conference on , vol., no., pp.2565,2570, 13-16 Aug. 2006
[9] Laroussi, M.G.; Ben Ayed, N.G.; Masmoudi, A.D.; Masmoudi, D.S., ”Diagnosis of masses in mammographic images based on Zernike moments and local binary attributes,” Computer and Information Technology (WCCIT), 2013 World Congress on , vol., no., pp.1,6, 22-24 June 2013 [10] Farag, A.; Mashali, S., ”DCT based features for the detection of microcalcifications in digital mammograms,” Circuits and Systems, 2003 IEEE 46th Midwest Symposium on , vol.1, no., pp.352,355 Vol. 1, 30-30 Dec. 2003 [11] Mohamed Fathima, M.; Manimegalai, D.; Thaiyalnayaki, S., ”Automatic detection of tumor subtype in mammograms based On GLCM and DWT features using SVM,” Information Communication and Embedded Systems (ICICES), 2013 International Conference on , vol., no., pp.809,813, 21-22 Feb. 2013 [12] C.B.R. Ferreira, D.L. Borges, Analyses of mammogram classification using a wavelet transform decomposition, Pattern Recognition Lett. 24 (2003) 973–982 [13] Berbar, M.A.; Reyad, Y.A.; Hussain, M., ”Breast Mass Classification using Statistical and Local Binary Pattern Features,” Information Visualisation (IV), 2012 16th International Conference on , vol., no., pp.486,490, 11-13 July 2012 [14] Lahmiri, S.; Boukadoum, M., ”DWT and RT-based approach for feature extraction and classification of mammograms with SVM,” Biomedical Circuits and Systems Conference (BioCAS), 2011 IEEE , vol., no., pp.412,415, 10-12 Nov. 2011 [15] Burges, J. C. 1998. A tutorial on support vector machines for pattern recognition,Data Mining and Knowledge Discovery2(2): 121–167. [16] Xu Xianchuan and Zhang Qi, “Medical Image Retrieval Using Local Binary Patterns with Image Euclidean Distance,” in International Conference on Information Engineering and Computer Science, 2009. ICIECS 2009, 2009, pp. 1–4. [17] A.K.Jain,R.P.W.Duin,andJ.C.Mao,“Statistical pattern recognition: A review,”IEEE Trans. Pattern Anal. Machine Intell., vol. 22, no. 1, pp. 4–37, Jan. 2000, 10.1109/34.824819 [18] I. Buciu and A. Gacsadi,“Gabor Wavelet Based Features for Medical Image Analysis and Classification,” IEEE 2nd International Symposium on Applied Sciences in Biomedical and Communication Technologies (ISABEL), November 24-27, Bratislava, Slovak Republic, pp. 1-4, 2009. [19] Sengur Abdulkadir and Turkoglu Ibrahim, and M. Cevdet Ince., ”Wavelet Packet Neural Networks for Texture Classification”, Expert Systems with Applications, Vol. 32, pp.527-533, 2007. [20] Wang Z-Z and Yong J-H., ”Texture Analysis and Classification with Linear Regression Model Based on Wavelet Transform”, IEEE Transactions on Image Processing, Vol.17, pp.1421-,14302008. [21] Sakka E., Prentza A., Lamprinos I.E. and Koutsouris D., “Microcalcification Detection using Multiresolution Analysis Based on Wavelet Transform”, IEEE International Special Topic Conference on Information Technology in Biomedicine, Ioannina, Epirus, Greece, October 26-28, 2006 [22] H. S. Sheshadri and A. Kandaswamy, “Experimental investigation on breast tissue classification based on statistical feature extraction of mammograms,” Computerized Medical Imaging and Graphics, vol. 31, no. 1, pp. 46–48, Jan. 2007 [23] Sheshadri H.S and Kandaswamy A., ”Detection of breast cancer by mammogram image segmentation”, Journal of Cancer Research and Therapeutics, Vol.1, pp :232-234, 2005. [24] V. Vapnik, Statistical Learning Theory. Wiley, New York, NY, 1988. [25] C. Cortes and V. Vapnik, ”Support-Vector Network”, Machine Learning, vol. 20, pp. 273-297, 1995. [26] N. Cristianini and J. Shawe-Taylor, ”An Introduction to Support Vector Machines and Other Kernel-based Learning Methods,” Cambridge University Press, Cambridge, England, 2000. [27] Heath, M., Bowyer, K., Kopans, D., Moore, R., Kegelmeyer, P.J.: The Digital Database for Screening Mammography. In: Int. Work. on Dig. Mammography, pp.212–218 (2000). [28] Automated Detection Method for Clustered Microcalcification in Mammogram Image Based on Statistical Textural Features Hiroshi Okumura Kohei Arai Indra Nugraha Abdullah. International Journal of Advanced Computer Science and Applications IJACSA (2012). [29] Meselhy Eltoukhy, M., Faye, I., and Belhaouari Samir, B. (2012). A statistical based feature extraction method for breast cancer diagnosis in digital mammogram using multiresolution representation. Computers in biology and medicine, 42(1), 123-128.
[30] C.W. Hsu, C.C. Chang, C.J. Lin, A practical guide to support vector classification, Department of Computer Science, National Taiwan University, Taipei 106, Taiwan, March 2008. [31] M. Hussain, S. K. Wajid, A. Elzaart, and M. Berbar, ”A Comparison of SVM Kernel Functions for Breast Cancer Detection,” in Eighth International Conference on Computer Graphics, Imaging and Visualization (CGIV), 2011, pp. 145-15 [32] Ojala, T., Pietikainen, M. and Maenpaa, T. 2002. Multiresolution grayscale and rotation invariant texture classification with local binary patterns,IEEE Transactions on Pattern Analysis and Machine Intelligence24(7): 971–987