Argonne National Laboratory Technical Report ANL/MCS-P1281-0805, August 2005
Statistical Data Reduction for Efficient Application Performance Monitoring Lingyun Yang1
Jennifer M. Schopf2
Ian Foster1,2
1
2
Department of Computer Science, University of Chicago, Chicago, IL 60637 Mathematics and Computer Science Division, Argonne National Laboratory, Argonne, IL 60439
[email protected] [jms, foster]@mcs.anl.gov
Abstract There is a growing need for systems that can monitor and analyze application performance data automatically in order to deliver reliable and sustained performance to applications. However, the continuously growing complexity of high-performance computer systems and applications makes the process of performance monitoring and analysis difficult. We introduce here a statistical data reduction method that can be used to guide the selection of system metrics that are both necessary and sufficient to describe observed application behavior, thus reducing the instrumentation perturbation and data volume managed by a monitoring system. In order to evaluate our strategy, we applied it to two Grid applications. A comparative study shows that our strategy produces better results than other techniques. It can reduce the number of system metrics that need to be managed by about 80% percent, while still capturing enough information for prediction of application performance.
1 Introduction Recent experience in deploying Grid middleware demonstrates the challenges one faces in delivering robust services in distributed and shared environments [6,13]. Applications often must deliver reliable performance despite the use of distributed and shared resources. In order to deliver dependable and sustained performance to applications given current state-of-the-art technology, there is a need for systems that can detect anomalies or bottlenecks automatically, and then adapt their behavior dynamically to address such problems in an online manner. The first step towards this kind of fault tolerant and adaptive computing is to monitor the performance of system components such that we can diagnose the reason if an anomaly happens. However, as highperformance computer systems and applications continue to increase in complexity, performance monitoring and analysis grows more difficult. Runtime performance problems seen by applications result from interactions among both physical components (e.g., CPUs) and logical components (e.g., I/O buffers). The performance implications of each isolated component may be relatively well understood, but it is often far from clear how this web of time-varying relationships determines overall application performance. To understand relationships among performance components and to address performance problems, developers must use instrumentation systems that capture information on a large number of these timevarying system metrics. Unfortunately, this instrumentation can influence the performance of target systems and produce tremendous volumes of data [11]. Among these system metrics, some can be predicted from others and are thus redundant. Other metrics are unrelated to application performance. To help combat these consequences of performance instrumentation, we need mechanisms to provide support for selecting only necessary metrics and measurement points. Such mechanisms will also simplify data analysis. In this paper, we introduce how to use the a statistical data reduction strategy based on stepwise regression to aid in the selection of system metrics that are necessary and sufficient to capture the relevant information of observed application behavior. One goal of this strategy is to reduce perturbation and data volume while retaining interesting characteristics of performance data. This statistical technique, when
1
Argonne National Laboratory Technical Report ANL/MCS-P1281-0805, August 2005
used for performance analysis, attempts to reduce the number of system metrics that a monitoring system must manage, which, in turn, can dramatically reduce data volume and instrumentation perturbation. We proceed in two steps. First, we identify and eliminate redundant system metrics. Second, we select the system metrics that are related to application performance, and eliminate (unnecessary) metrics. We evaluate the effectiveness of our data reduction strategies for two parallel applications, Cactus and Sweep3D, running on shared resources. Our experimental results show that our strategy selects system metrics that are both necessary and sufficient to predict application behavior, and also greatly reduces the number of system metrics collected. The rest of this paper is organized as follows. Section 2 describes the problem. Section 3 introduces our data reduction strategy. Section 4 presents our experimental results. Section 5 introduces related work. In Section 6, we summarize and briefly discuss future work.
2 Problem Statement Previous studies [5,10] show that variability in resource characteristics can have a major influence on application performance. Even small variations in resource capability can dramatically change observed application performance. To formalize this notion and provide a basis for analysis, we consider a distributed system with p resources, each characterized by a set of system metrics. For example, a resource CPU might have three system metrics defined: percentage of CPU utilization at the user level, percentage of CPU utilization at the system level, and percentage of time that the CPU was idle. The characteristics of the system including p resources can be described by the set of all system metrics: m11, m12,… m1n1; M= m21, m22,… m2n2; … p p m 1, m 2,… mpnp ; where ni is the number of metrics for the ith resource and, mij is the jth metric for the ith resource. We also introduce the notion of a performance metric, a quantitative description of some aspect of application performance. For example, one useful performance metric for an application that calculates the product of two matrices might be the number of multiplications finished during a unit time. Another might be elapsed time during program execution. Depending on the system metrics available on a particular system and the performance metrics of interest to the user, we may find that there is a correlation between some function of some subset of the system metrics and a particular performance metric. If such a function and subset exist and can be identified, then we can use those particular system metrics as a predictor for the performance metric. Given this introductory material, we can now state our problem as follows: given a system, a set of system metrics, and an application described by a performance metric, identify a minimal set of system metrics that can be used to predict the performance metric with a desirable level of accuracy. In solving this problem, we can exploit the fact that some system metrics may capture the same or similar information. For example, the value of the metric used memory is equal to the total memory size minus the value of the metric unused memory, and vice versa, while the two system metrics number of messages sent from one socket and the number of bytes sent from the same socket will capture similar information if messages have similar sizes. Definition 1: Two system metrics m1, m2 are dependent on each other if and only if the value of the two system metrics are correlated with each other at a level greater than a specified threshold. Otherwise, m1 and m2 are independent. For example, the value of used memory and the value of unused memory of the same machine are dependent on each other. Only one is necessary; the other is redundant and can be eliminated from the set of potential predictors without losing useful information.
2
Argonne National Laboratory Technical Report ANL/MCS-P1281-0805, August 2005
Thus, to judge if two variables are dependent, we need both (a) a method of quantifying the degree of correlation between two variables and (b) a value for the threshold correlation value. We discuss our method of calculating the degree of correlation between two system metrics and the selection of the threshold parameter in Section 3.l and Section 4, respectively. We also want to take into account the fact that not all system metrics will be related with a particular performance metric. For example, in the case of a program that calculates the sum of several integers, CPU utilization is likely to be strongly related with execution speed, while the number of opened files is not. Such unrelated system metrics can also be eliminated from the set of potential predictors without losing useful information. To describe the relationship between system metrics and performance metric, we give the following definition: Definition 2: A performance metric y is predictable by system metrics m1,m2,…mn if and only if the value of y can be predicted by a model of variable m1,m2…mn , expressed by y=F(x1,x2,…xn). We then call y the response variable and each system metric mi (i=1..n) is called a predictor of y. Given the above definitions, our problem can be formalized as follow: given an application characterized by a performance metric y and a system characterized by a set of metrics M, our goal is to find a subset of system metrics S= (x1,x2,….xn), S⊆M, such that (a) every pair of system metrics in S, xi and xj, i=1..n, j=1..n , i≠j, are independent and (b) every system metric xi, i=1..n, is a predictor of the performance metric y of the application running on this system, using a given model. The goal of criterion (a) is to remove redundant system metrics. The goal of criterion (b) is to find all metrics that predict application performance and remove those that do not.
3 Statistical Data Reduction Recall that the general goal of our strategy is to reduce the number of system metrics to be monitored while still capturing enough information to predict a specified performance metric with a desired level of accuracy. We proceed in two steps: (1) eliminate dependent system metrics (Section 3.1) and (2) identify and further eliminate irrelevant system metrics (Section 3.2). The result of our strategy is a subset of system metrics that are both necessary for predicting the performance metric and independent of each other. In Section 3.3 we discuss the criteria used to evaluate the data reduction strategy.
3.1 Redundant System Metrics Reduction Dependent system metrics, as defined by Definition 1, are system metrics that are strongly correlated each other. A pair of dependent metrics convey essentially the same information, thus only one is necessary; the other is redundant and can be eliminated. We use the Pearson Product-Moment Correlation Coefficient (r), or correlation coefficient for short, to obtain a quantitative estimation of the degree of correlation between two system metrics. The correlation coefficient provides a measure of the degree of linear relationship between two variables [18]. A high correlation coefficient value indicates that the two variables can be calculated from each other by some linear model. The correlation coefficient may take any value between plus and minus one. The sign of the correlation coefficient (+ , -) defines the direction of the relationship, either positive or negative. The absolute value of the correlation coefficient represents the strength of the relationship. To identify system metrics that are dependent on each other, we first construct a correlation matrix by computing the correlation coefficient between every pair of system metrics. Then, we apply a clustering algorithm to this matrix to identify clusters of system metrics such that every metric in a cluster has a correlation coefficient with absolute value above a threshold value to at least one other metric in the cluster. We conclude that the system metrics in one cluster capture essentially the same information and eliminate all but one of those metrics. Two questions then arise: what data do we use to construct this correlation matrix, and how much data do we need to determine whether an observed correlation is significant?
3
Argonne National Laboratory Technical Report ANL/MCS-P1281-0805, August 2005
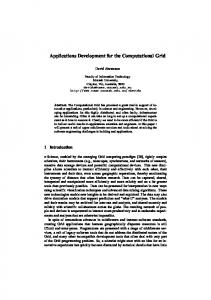
1 0. 8 0. 6 0. 4 0. 2 0 - 0. 2 1 - 0. 4 - 0. 6 - 0. 8 -1
3
5
7
9 11 13 15 17 19
Percentage
Correlation Coefficient
The answer to the first question is that we use data measured during some “typical” execution of our application and system. Here we see a potential weakness of our approach: while we capture effectively, as we show below, correlations between system and performance metrics that occur during “normal execution,” a correlation that occurs only during some “unusual” circumstance may not be detected if our sample data includes few or no occurrences of that circumstance. We recognize this weakness, but note that it does not prevent our technique being useful in many cases. The answer to the second question is that we use statistical tests to determine whether an observed correlation is significant, with the goal of avoiding eliminating uncorrelated metrics only by chance. To show why this is important, Figure 1 (a) shows 20 sample correlation coefficients between the number of transfers issued per second and the number of memory pages cached per second for data collected during the execution of one of our test applications, Cactus [2,3], a compute-intensive numerical simulation. We ran Cactus 20 times on six machines and collected 20 sets of sample data on one of the six machines. We then computed one sample correlation coefficient on each set of sample data. Figure 1(b) shows the histogram of the 20 sample coefficient coefficients. Because these two system metrics describe the performance of two independent components in the system, we would not expect them to be strongly correlated. However, as shown in Figure 1, while in most cases (16 cases or 80% of the time) the absolute value of the sample correlation coefficients between these two metrics is small (