(1994). Recently, however, Wyche et al. (2015) applied. Principal Component Analysis (PCA) to CIR-ToF-MS and cToF-AMS data from their chamber studies.
STATISTICAL DIMENSION REDUCTION TECHNIQUES APPLIED TO MULTIVARIATE CAR EXHAUST EMISSION DATA S. ISOKÄÄNTÄ1, E. KARI1, A. BUCHHOLZ1, A. VIRTANEN1 and S. MIKKONEN1 1
Department of Applied Physics, University of Eastern Finland, Finland
Keywords: dimension reduction, pmf, efa, pca, multivariate time series
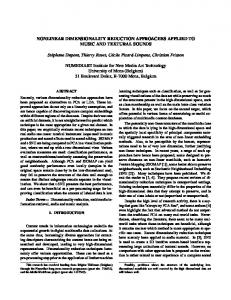
Online measurements with mass spectrometers produce complex and large datasets. Statistical dimension reduction techniques are able to compress the information from complex composition data into a few latent factors, which can be interpreted further according to their properties. Currently the most exploited method in the analysis of AMS data is Positive Matrix Factorization (PMF) developed by Paatero and Tapper (1994). Recently, however, Wyche et al. (2015) applied Principal Component Analysis (PCA) to CIR-ToF-MS and cToF-AMS data from their chamber studies. In this work, the statistical analysis was applied for the measurements where the effect of the exhaust from a modern gasoline car on the photochemistry of αpinene was studied in environmental chamber under atmospherically relevant conditions. The dimension reduction techniques were used to compress the information from the data measured with the PTR-ToFMS (volatile organic compounds, VOCs) and with the ToF-CIMS (semi volatile organic compounds, SVOCs), because both instruments produced complex datasets during the measurement campaign. Different variations of PMF, PCA and Exploratory Factor Analysis (EFA) were applied to the PTR-ToF-MS data. Factor time series presented in Fig. 1 are from the photo-oxidation experiments conducted with the car emission (without added α-pinene). For EFA and PCA, the factors in concentration units were calculated by multiplying the original data with the loading values (i.e. the contribution of a variable to a factor) acquired from the EFA/PCA factorization. For both EFA and PCA, oblique rotations were used. PMF differs conceptually from EFA and PCA as the errors for the data values must be known to proceed with PMF. The error matrix for PMF was calculated in two different ways. Constant errors were derived from the standard deviation of each ion trace in the measurement data, i.e. the error value for a specific ion does not change with time. Data dependent errors were calculated by first smoothing the time series of every variable with local regression and the error was determined as the difference between the smoothed time series and the original time series. Error calculated by this way varied between the time points. The benefit of EFA and PCA compared to PMF is that these methods are generally better in find very small changes in the time series of the variables. This is because EFA/PCA use arbitrary units instead of the data units. This can be seen from Fig. 1, where EFA/PCA
Figure 1: The factor time series from different methods. Index refers to time point. The shaded area indicates the period when UV-lights (centered at 340 nm) were on. factors have generally more variation as the factors from PMF. Large differences in the order of magnitude between the variables may also cause problems for PMF whereas in EFA/PCA the values are scaled and only the relative changes are considered. The factors were identified based on the results acquired from EFA as it created the most interpretable factors. The grouping of variables to distinct factors was also most explicit in EFA. The blue factor includes SOA precursors of the car exhaust, red factor includes most of the products formed during the photo-oxidation of the car exhaust and the green factor includes VOCs that mostly originated from the car exhaust but were not SOA precursors. It should be noted that the changes in the green factor are not visible in Fig. 1 when the concentration units are used, as the changes are very small. Paatero, P. and Tapper, S. (1994). Environmetrics, 5, 111-126 Wyche et al. (2015). Atmos. Chem. Phys., 15, 8077– 8100
58