Statistical Issues on Multiple Choice Tests in Engineering Assessment
P. Costa1, P. Oliveira2, and M.E. Ferrão3 1
Lab. of Applied and Computational Statistics, Department of Mathematics, University of Beira Interior, Covilhã, Portugal (
[email protected]) 2 School of Engineering, University of Minho, Guimarães, Portugal (
[email protected]) 3 Department of Mathematics, University of Beira Interior, Covilhã, Portugal (
[email protected])
Abstract This work studies the psychometric properties of the multiple choice tests used to assess skills in Statistics in the Integrated Masters Degree in Engineering and Industrial Management of the University of Minho. The results show the importance of measuring the quality of the instruments to a fair assessment of the students. Moreover, in the Bologna Process context, multiple choice tests in combination with other learning assessment methods are an alternative for the practical implementation of a continuous assessment. The Classical Test Theory approach and Item Response Models were applied to the data obtained in the tests administered to students enrolled in the academic years 2006/2007 and 2007/2008. The statistics considered are: item discrimination and difficulty, reliability (internal consistency), information function and standard error of measurement. With the aim of improving the items that compose the instrument, we present the poor items and analyse them in terms of specific objectives of learning.
Keywords: assessment, multiple choice tests, classical test theory, item response model, measurement error, information function.
1. INTRODUCTION The Bologna Declaration, signed by 32 EU member and non-member countries, goes considerably further in its demands to ‘create a European space for Education’ [3]. It sets a considerable challenge to higher education institutions in order to, by the year 2010, adopt a common framework of comparable degrees, and a compatible credit system. Therefore, there will be an increase in the mobility of students, teachers/lecturers, promoting a European dimension in quality assurance and an increase within the international competitiveness of the European system of higher education. In Portugal, considering the context of the amendments, Higher Education Institutions are faced with new challenges, namely the emergence of a new concept [7] about the student’s role within the organization of each subject area, as well as the adoption of more effective teaching methodologies, either within the context of an evaluation or accreditation. As a result, several institutions have changed or reorganized their curricula, under the framework of Bologna declaration [20] as well as the teaching and/learning process [19]. Multiple choice tests (MCQ – multiple choice questionnaires) allow the application of continuous assessment and are used to show what students have learnt. This type of tests have been used more effectively as a method of formative assessment, providing students with information about their progress throughout the subject course, establishing a motivating factor for learning, and, therefore, influencing the learning processes itself. There are four main advantages related to the increasing use of MCQ assessment: quick coverage of curricula; promptly available results; removal of marking error; and the banking of items for future use. Some drawbacks usually listed are: the higher reliability associated to open-ended (traditional written) tests; the difficulty of writing good
1
items and developing approaches which test at higher cognitive levels; true/false or similar are impossible in some disciplines; MCQ must be monitored statistically and there is an arguable need for security with respect to the item bank. The use of MCQ has increased in the universities. Steif and Dantzler [17] quantified the learning of concepts in Statics using MCQ. The purpose of this project was to identify the main concepts and the typical mistakes made by students in Statics. A psychometric analysis was carried out on the results achieved by students in five universities; this tool proved to be valid and trustworthy (Cronbach alpha coefficient of 0.89) in the measurement of conceptual learning in Statics. The results allowed the identification of the contexts in which the students had more difficulties. Steif and Hansen [18] analysed the results of multiple choice tests that had been used to measure learning in Statics. The results achieved pertain to students within ten classes of seven American universities during the academic year 2004/2005. A comparison of the grades obtained in the different programs is carried out. The results confirm the validity and reliability of the test used (Cronbach alpha coefficient of 0.82). In Portugal, the development and application of statistical methods to multiple choice questions tests that measure academic aptitude have had a significant role in terms of improving the learning measurement methods. Ferrão [9] presented the results of a research project intituled Mathematics and Statistics for the Development of Professional Skills sponsored by the Portuguese Science and Technology Foundation and fully implemented in the academic year 2007/2008. The analysis of the quality assessment of the applied instruments was based on the Classical Test Theory (CTT) approach. The results gave support to the adoption of this type of instruments from the point of view of formative assessment. The author has shown that there is a strong correlation (0.85) between the students’ scores in open answer tests and multiple choice tests. In addition, a questionnaire was applied to students about their opinion on multiple choice tests and the evidences show that the students support the adoption of this type of tests as an assessment method and its more frequent use, not just in Statistics, but also in other subjects. In this study, the results and the students’ opinion are encouraging for the extension of this experience to other subjects/degrees in the future. Costa, Oliveira and Ferrão [5] have studied the psychometric properties of the three multiple choice tests used to measure skills in Statistics in the scope of the Integrated Master’s Degree in Engineering and Industrial Management of the University of Minho. These multiple choice tests are used in the teaching-learning process of Probability and Statistics and the items were constructed considering the following specific objectives of learning: descriptive statistics, probabilities, random variables and vectors, probability distributions, functions of random variables and estimation. The authors used the approach based on the CTT and compared data collected in the academic years 2006/2007 and 2007/2008, assuming each set of students as independent samples of the same population. The authors pointed out the limitations of this approach in the case of its purpose is to compared scores over time. Specifically the impossibility of guaranteeing the confidentiality of tests and the difficulty in producing parallel tests. In this way, Ferrão, Costa and Oliveira [10] proposed a methodological approach based on two parameter logistic Item Response Model (IRM) in order to get a common metric for future use that assures the comparability of student scores over time. The data referred to the same multiple choice test assessing descriptive statistics (concepts and applications) used in Costa, Oliveira and Ferrão [5]. Results include: (a) estimates for item parameters that represent item difficulty and item discrimination; (b) a common metric for comparability in time and respective measurement error; (c) the contribution of each item to the total information of the test and the identification of potential poor items; (d) the identification of common statistical misconceptions. Thus, based on previous work [5, 10], we intend to analyze the poor items concerning their content validity. The paper structure is as follows: in the second section we describe the methodology component of the paper, in particular the statistical analysis of the items. In the third section, based on the item analysis results obtained considering both approaches, CTT and IRM, we identify the poor items in terms of specific objectives of learning and possible suggestions towards their improvement are presented. In the last section we discussed the results.
2
2. METHODOLOGY OF ANALYSIS In a study of quality of assessment based on testing, there are two main approaches: the Classical Test Theory CTT [16] and the Item Response Models - IRM [14]. Regarding CTT, the reliability of scores is quantified through the estimator of internal consistency, in particular by Kuder-Richardson correlation coefficient (KR20) and standard error of measurement [11]. The analysis of the items is done using the following statistics: (i) discrimination index, (ii) difficulty index and (iii) point biserial correlation.
X represents the competencies/skills gained by the student after the 0 teaching/learning process. The observable variable, X , is usually obtained after a test has been given and from
It is assumed that the variable
which the student’s score is also obtained. If tests were instruments with absolute precision, the obtained value, X , regardless of the test used, would be equal to the true value, X . In a hypothetical situation where the student’s competencies/skills gain is tested T times, model (1) represents the relationship between the true value of the variable and the corresponding observed value, 0
X to = X + ε t (t = 1,..., T ) (1) where ε represents the measurement error. It is assumed that the error is non-systematic and homoscedastic. Moreover, it is assumed that the error is noncorrelated with the true value. The reliability of the measurement process is an indicator of the measurement error and the reliability coefficient is used for its quantification [12]. An estimator for the reliability is given by the Kuder-Richardson correlation KR20 [15, 8], which is really an estimator of the internal consistency of the test. Equations (2) and (3) define the coefficient KR20 and the measurement error (SEM, standard error of measurement), respectively: K ⎡ ⎤ ∑ pi (1 − pi ) ⎥ ⎢ K i =1 KR 20 = ⎢1 − ⎥ K −1 ⎢ s2 ⎥ ⎢⎣ ⎥⎦
(2) SEM = s 1 − KR 20
(3) where K is the number of items in the test, p i is the proportion of correct answers to item i and s 2 is the variance in the classification of the student, X 0 . The characteristics of the items, such as the ability to discriminate and difficulty, can be quantified through the respective discrimination index and difficulty index. Additionally, the point biserial correlation quantifies the association between the item and the total score. The discrimination index [11] measures the capacity of the item to distinguish the high performance students (e.g. 27% of the examinees with higher classifications) from those who have fewer skills (low performance students, e.g. 27% of the examinees with lower grades). This index is obtained from the difference between the proportion of correct answers in the item, for the examinees that had a classification superior to the percentile 73 and the proportion of correct answers in the item, for the examinees who had a classification inferior to the percentile 27. The values for this parameter vary from -1 to 1. Items with discrimination indexes above 0.4 are considered very discriminative. The ones whose values are in the interval [0.3; 0.4] are considered discriminative and the ones with values inferior to 0.3 are considered less discriminative. The difficulty index is given by the proportion of correct answers in the item (p). Therefore, high values in this index indicate that the questions are easy. The difficulty index can be characterized in the following five categories: very difficult ([0;0.25[), difficult ([0.25;0.45[), intermediate ([0.45;0.55[), easy ([0.55;0.75[) and very easy ([0.75;1]).
3
The point biserial correlation coefficient is obtained by calculating the Bravais-Pearson coefficient [13] through: rpbi =
M1 − M 0 s
pq ,
(4) where M 1 - average classification of the examinees who answer correctly; M 0 - average classification of the examinees who answered incorrectly; q = 1− p . The parameters involved in the analysis, using IRM are: discrimination parameter estimates, difficulty parameter estimates, as well as, test information function and corresponding standard error of measurement. The two-parameter logistic model includes parameters to represent the item's difficulty and power of discrimination [2, 14, 4, 6] that are also known as structural parameters [1]. The model is specified as follows: Pi (θ j ) =
e
Dα i (θ j − β i )
1+ e
Dα i (θ j − β i )
(i = 1,..., K) (j = 1,..., M)
(5) where: Pi (θ j ) represents the probability that the student j with ability θ j give the correct answer to the item i ; the parameters θ j are known as incidental parameters;
α i is the discrimination parameter for item i ; β i is the difficulty parameter for item i ; D is a scaling factor introduced so that the logistic function will coincide as closely as possible with the normal cumulative distribution; K is the number of items on the test; M is the number of students who took the test. The procedure used to obtain the latent factor estimates, item discrimination parameter estimates and item difficulty parameter estimates is Marginal Maximum Likelihood [1]. The estimation is carried out in the computer software Bilog-MG [21].
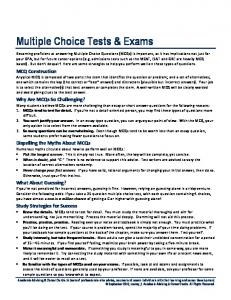
3. DATA AND RESULTS The data correspond to those used in Costa, Oliveira and Ferrão [5] and Ferrão, Costa and Oliveira [10]. They refer to a multiple choice test to assess skills in Statistics I of students attending the Master in Engineering and Industrial Management of Minho University during the academic years 2006/2007 and 2007/2008. The test, which assesses competencies/skills in Descriptive Statistics, was applied to 158 students and is composed of 20 items. The results obtained by Costa, Oliveira and Ferrão [5] show that, in general, the test is mainly composed of discriminative and very discriminative items and that there are items of all difficulty levels. The point biserial correlation coefficient values corroborate the results obtained. It was verified that the items 1, 10 and 16 are the worst/poor and items 4 and 15 are the best. The internal consistency of the test (KR20=0.72, SEM=2.089) reflect the quality of the instrument. The analysis of the results obtained by the IRM presented in Ferrão, Costa and Oliveira [10] illustrates that in general, there is concordance between the analysis obtained by CTT and IRM. Thus, the analysis of the items considering both approaches indicates that items 1, 10 and 16 are the worst/poor and 4 and 15 are the best/good items of the test. Considering the analysis based on IRM, we present, in figures 1 and 2, the Item Characteristic Curve (ICC) and Item Information Curve of the items 10 and 15, to show the differences between poor and good items.
4
Item characteristic curve
Item information curve
1.0
1.0
0.9 0.8
Information
Probability
0.8 0.6 0.4
0.7 0.6 0.5 0.4 0.3
0.2
0.2
b
0.1
0 -3
-2
-1
0
1
2
-3
3
-2
-1
0
1
2
3
2
3
Scale Score
Ability
Figure 1: Item characteristic curve and item information curve of the item 10
Item characteristic curve
Item information curve
1.0
1.0
0.9 0.8
Information
Probability
0.8 0.6 0.4
0.7 0.6 0.5 0.4 0.3
0.2
0.2
b
0.1
0 -3
-2
-1
0
1
2
3
-3
Ability
-2
-1
0
1
Scale Score
Figure 2: Item characteristic curve and item information curve of the item 15
The ICC of item 10 is almost flat. According to Ferrão, Costa and Oliveira [10] this means that the item is equally easy for any level of student ability and it does not discriminate amongst students. The information function illustrates that this item contributes almost nothing to the test information function. Bellow we will give more details about this item. The ICC of item 15 is “S” shaped with a good power of differentiation between different levels of ability. It is an item of medium difficulty and the slope of the ICC shows that the item presents a good discrimination among students with ability around 1. In addition, the information function shows a strong contribution of item 15 for the information function of the test. With the purpose of improving the items of the previously referred instrument, we show the specific objectives of learning and we discussed the considered hypothesis to explain the worst items of the test. Item 1 has as its main specific objectives of learning: measurement scales; graphs (bar and box plot) and descriptive statistics (central tendency and dispersion). This item presents 12% of correct answers and the correct answers are observed both in high performance students and low performance students. The item should be revised for the following: the stimulus is presented negatively and the aim of learning associated to the item is very broad, meaning it includes many concepts and definitions of the content of Descriptive Statistic. Item 10 refers to the specific objective of learning measurement scales, it was answered correctly by 62% of students and it is verified that the correct answers are obtained both in the high performance students and in low performance students, in spite of being a relatively easy item when compared to others. The analysis of item
5
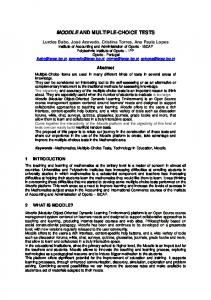
parameters estimates [10] indicates that the item is less discriminative and easy level of difficulty. The confusion between quantitative measurement scales seems to be the problem. The underlying content to the item 16 is quantiles. In this item 25% of students answered correctly and the right answers are verified both in high performance students and low performance students. In this item the term “approximately” is presented in the stimulus, which, together with the first answer option can lead the student into answering this option “by approximation”. It is also verified that 3 out of 5 options are approximate values in accordance with inferior and superior limits of the variable. The test information function (figure 3) illustrates that the data obtained by the administration of this instrument contributes with a larger amount of information regarding the latent trait of students with level of ability between -2 and 1. According to Ferrão, Costa and Oliveira [10], the measurement error shows that for the extremes of the scale there is an insufficient precision of the scale. Particularly for outstanding students the measurement or assessment of statistics learning is quite unreliable. This situation recommends the increase of the number of difficult items in the test.
1.26 1.01
3
0.76 2 0.51 1
Standard Error
Information
4
0.25 0 3
-
-2
-1
0
1
2
3
Scale Score
Figure 3: Test information function and measurement error
4. CONCLUSION In the present study we analysed items from an instrument which assesses skills in Descriptive Statistics. The data referred to 158 students attending the Master in Engineering and Industrial Management of Minho University who participated in this study during the academic years of 2006/207 and 2007/2008. The analysis was based on the results obtained in Costa, Oliveira and Ferrão [5] and Ferrão, Costa and Oliveira [10] by using CTT and IRM approaches, respectively. In this sense, we describe the worst items (1, 10 and 16) of a multiple choice instrument in terms of specific objectives of learning, its statistical properties and the possible explanation for these items to present these characteristics. The analysis of the items which compose multiple choice tests allow its differentiation, making possible the application of quality tests. Using the analysis based on IRM, it is possible to create item banks and thus the items/tests used to evaluate learning outcomes will have the conditions for data modelling with the aim of building up a metric which allows the comparison of student results during consecutive years. Thus the analysis made in this paper contributes to the improvement of the items which compose the item bank.
6
References [1] F. B. Baker and S. Kim, “Item Response Theory – Parameter Estimation Techniques”, 2nd ed. New York: Marcel Dekker Inc. (2004). [2] A. Birnbaum, “Some latent trait models and their use in inferring an examinee's ability”, in F. Lord and M. Novick (Eds.), “Statistical Theories of Mental Test Scores”, Reading, Mass.: Addison-Wesley (1968). [3] Bologna Declaration, “The European Higher Education Area”, Joint Declaration of the European Ministers of Education, Bologna, 19 June (1999). [4] P. Costa and M. E. Ferrão, “Modelo de Resposta ao Item na Estimação da Qualidade da Infra-estrutura das Escolas”, Actas do XII Congresso Anual da SPE, 195-206 (2005). [5] P. Costa, P. Oliveira and M. E. Ferrão, “Statistical Issues on Multiple Choice Tests in Engineering Assessment: A Classical Test Theory Approach”. Unpublished (2008a). [6] P. Costa, P. Oliveira and M. E. Ferrão, “Equalização de escalas com o modelo de resposta ao item de dois parâmetros”, in Estatística – da Teoria à Pratica, Actas do XV Congresso Anual da Sociedade Portuguesa de Estatística, (M. Hill et al.), 155-166. Edições SPE (2008b). [7] Decreto-Lei nº 42/2005. D.R. I Série-A 37 1494-1499. Imprensa Nacional Casa da Moeda, Lisboa, Portugal (2005-02-22). [8] G. Dunn, “Design and Analysis of Reliability Studies: the statistical evaluation of measurement errors”, Edward Arnold, London (1989). [9] M. E. Ferrão, “E-assessment within the Bologna paradigm: evidence from Portugal”, Assessment and Evaluation in Higher Education. In press (2008). [10] M. E. Ferrão, P. Costa and P. N. Oliveira, “Item Response Model Applied to Developing a Common Metric: statistics assessment in Engineering”. Unpublished (2009). [11] J. P. Guilford and B. Fruchter, “Fundamental statistics in psychology and education”, 6th ed, McGraw-Hill, New York (1978). [12] D. J. Hand, “Measurement, Theory and Practice”, London, Arnold (2004). [13] L. D´Hainaut, “Conceitos e Métodos da Estatística – Volume II: Duas ou três variáveis segundo duas ou três dimensões”, Lisboa: Fundação Calouste Gulbenkian (1992). [14] R. K. Hambleton, H. Swaminathan and H. J. Rogers, “Fundamentals of Item Response Theory”, North Caroline: Sage Publications (1991). [15] G. F. Kuder e M. W. Richardson, “The theory of the estimation of test reliability”, Psychometrika, 2, 151160 (1937). [16] F. M. Lord and M. R. Novick, “Statistical Theories of Mental Test Scores”, Reading, MA: Addison-Wesley (1968). [17] P. Steif and J. Dantzler , “A Statics Concept Inventory: Development and Psychometric Analysis”, Journal of Engineering Education, 33, 363-371 (2005). [18] P. Steif and M. A. Hansen, “Comparisons between performances in a Statics Concept Inventory and Course Examinations”, International Journal of Engineering Education, 22, 1070-1076 (2006), [19] P. Petocz and A. Reid, “Learning and Assessment in Statistics”, International Statistical Institute, IASE Satellite (2007). [20] J. Teixeira, J. Silva and P. Flores, “Development of mechanical engineering curricula at the University of Minho”, European Journal of Engineering Education, 32, 539-549 (2007). [21] M. Toit, “Irt from SSI: Bilog-mg, Multilog, Parscale, Testfact”, Chicago: Scientific Software International (2003).
7