Farrington et al. A Statistical Algorithm for the Early Detection of Outbreaks of Infectious Disease. Journal of the Royal Statistical Society Series A. 1996; 159: ...
Statistical methods for the prospective detection of outbreaks within the hospital setting: differences in algorithm performance using data available at the national and local levels R. Freeman1, A. Charlett2, L. Moore3, G. Davis1, T. Galletly3, N. Andrews2, N. Verlander2, A. Holmes1,3, M. Catchpole2 1The
National Centre for Infection Prevention and Management, Imperial College London, UK; 2Public Health England, London, UK; 3Imperial College Healthcare NHS Trust, London, UK
INTRODUCTION & PURPOSE
RESULTS
• In England, infectious disease surveillance consists of mandatory, enhanced and voluntary surveillance systems, which are co-ordinated by Public Health England (PHE) at the national level • Automated laboratory surveillance for infectious diseases has been undertaken by PHE since the early 1990s • There are many instances of outbreaks within hospitals documented in the media and several studies have shown that outbreaks in hospitals have been missed using intelligence-based outbreak identification • An automated and systematic approach for outbreak detection at the hospital level is required
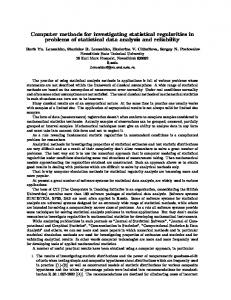
National Level Data • Using an UL of 95% and the earliest specimen date variable resulted in 87 exceedances generated by the Farrington algorithm, compared to 83 alerts created when using the algorithm described by Noufaily Examples of the different outputs can be seen in Figures 1 and 2 • As would be expected, many more exceedances were detected when using an upper limit (UL) of 95% as opposed to 99.5% (83 vs. 15, using the Noufaily algorithm) Earliest Specimen Date - 95% upper limit
Earliest Specimen Date - 95% upper limit 30
Exceedance chart: ESCHERICHIA COLI
30
METHODS
Exceedance chart: ESCHERICHIA COLI
20
25
Figure 1: Exceedance chart output using the Farrington algorithm – total exceedances detected = 8
20 12 ,w k3 9
20 12 ,w k2 6
20 12 ,w k1 3
20 11 ,w k5 2
k3 9 w 20 11
20 11 ,w k2 6
20 11 ,w k1 3
20 10 ,w k5 2
20 12 ,w k3 9
20 12 ,w k2 6
20 12 ,w k1 3
20 11 ,w k5 2
k3 9 w 20 11
20 11 ,w k2 6
20 11 ,w k1 3
5
10
15
Frequency
20 15 10
20 10 ,w k5 2
Table 1: Organisms used in outbreak detection
5
Organism name A. baumannii C. difficile E. aerogenes E. cloacae E. coli E. faecalis S. pyogenes E. faecium (invasive) K. pneumoniae P. aeruginosa S. aureus S. maltophilia
Frequency
• Evaluation of data available from a national microbiological surveillance system found variation in how laboratories report to the system • Data on various organisms (Table 1) from one hospital trust exhibiting consistent and timely reporting behaviours was subject to a range of methods for outbreak detection • Previously described algorithms1,2 for outbreak detection were compared • Thresholds representing when observed reports are considered to be in exceedance of the expected number of cases were also compared (95% vs. 99.5%). • CUSUM3 and VLAD charts were employed to assess the existence of small shifts in the observed number of cases.
25
National Level Data
Figure 2: Exceedance chart output using the Noufaily algorithm – total exceedances detected = 2
Local Level Data
Local Level Data
• Results from the application of methods to the national level data helped to inform selection of methods and criteria to be applied to local level data • The algorithm described by Noufaily et al.2 was run on three years worth of microbiology data, with an upper limit threshold set at 95% • At the local level, antimicrobial susceptibility results could be used to identify cases of multidrugresistant organisms (MDRO), as defined in Table 2
• There were many more exceedances observed when the outbreak detection model was applied to data on MDRO compared to the number of exceedances identified using all organism data (67 flags versus 26 flags) • Residual CUSUM plots and VLAD charts provided an insight of trends over time, as can be seen in Figure 3
Organism A. baumannii Enterobacter spp. E. coli Klebsiella spp. P. aeruginosa Enterococcus spp. S. aureus
Ami Ctx Cfp
Antimicrobial name Ctz Ctr Gen Tob Neo Imi Mer
CONCLUSIONS
Ert Azt Van Tei Fox Flu
Ami, amikacin; Ctx, cefotaxime; Cfp, cefpodoxime; Ctz, ceftazidime; Ctr, ceftriaxone ; Gen, gentamicin; Tob, tobramycin; Neo, neomycin; Imi, imipenem; Mer, meropenem; Ert, ertapenem; Azt, aztreonam; Van, vancomycin; Tei, teicoplanin; Fox, cefoxitin; Flu, flucloxacillin
Table 2: Antimicrobial susceptibilities used to define MDRO
Figure 3: VLAD chart for cases of multidrug/ carbapenem-resistant isolates of A. baumannii
• Due to the smaller numbers observed at the trust level, an upper limit of 95% should be used in outbreak detection methods to prioritise sensitivity over specificity • Although the detection of observed counts above a statistically significant level is often fundamental to outbreak detection algorithms, it is also essential to recognise the importance of outbreak definitions which involve space and time parameters • With the emergence of carbapenem-resistant bacteria in the hospital setting, recognising a breakdown in infection control measures is essential in the efficient management patients with MDRO, and thus the prevention of outbreak situations
ACKNOWLEDGEMENTS
REFERENCES
We wish to thank the UKCRC for funding this work.
1. Farrington et al. A Statistical Algorithm for the Early Detection of Outbreaks of Infectious Disease. Journal of the Royal Statistical Society Series A. 1996; 159: 547-63 2. Noufaily et al. An improved algorithm for outbreak detection in multiple surveillance systems. Statistics in Medicine. 2012. DOI: 10.1002/sim.5595 3. Montgomery, DC. (2005). Introduction to Statistical Quality Control: 5th Edition. USA: John Wiley & Sons