http://jer.sciedupress.com
Journal of Epidemiological Research
2015, Vol. 1, No. 1
ORIGINAL ARTICLES
Statistical modeling and verification for the synthesis of median survival time in multilevel meta-analysis of survival data Jiajie Zang1, 2 , Jinfang Xu2 , Chun Xiang2 , Shurong Zou1 , Jia He
∗2
1
Department of Nutrition Hygiene, Institute of Health Related Risk Factor Identification and Control, Shanghai Municipal Center for Disease Control and Prevention, Shanghai, China 2 Department of Health Statistics, Second Military Medical University, Shanghai, China
Received: June 5, 2015 DOI: 10.5430/jer.v1n1p25
Accepted: July 9, 2015 Online Published: July 22, 2015 URL: http://dx.doi.org/10.5430/jer.v1n1p25
A BSTRACT Objective: Past meta-analyses of survival data have been over simplistic because of restricting to proportional hazard model, lack of intuitive results, and potential omitting information. These had the potential to recommend sub-optimal policies. Here we develop multilevel methods for combining median survival times (MSTs) for meta-analysis of survival data. Methods: We used simulated data to test and verify the synthesis model we developed. We generated the study-level data to fit multilevel model and individual patient data to calculate gold standard. We then used the Bland-Altman method and the relative change from the gold standard to evaluate the fit of the models. Examples were presented in a meta-analysis to illustrate the feasibility of the models. Results: We generated eight sets of simulated datasets of different number of studies and sample size. We established the multi-level fixed and random effect models to pool the MSTs. The test of the fitness of the model showed that the means of difference (d) for all simulated datasets between the calculated values and the gold standards are no more than -0.230 and -0.329 days and the largest 95% CIs of d are -3.823 ∼ 3.364 and -3.936 ∼ 3.278 days respectively. At least 91.9% and 92.3% of the difference between the estimated values and the gold standards are small. The real examples of a meta-analysis were provided with combined MSTs along with pooled HR. Conclusions: The multilevel models of synthesizing MSTs in survival data AD meta-analysis were verified with good fitting effects and provide more intuitive information.
Key Words: Median survival time, Pooled, Survival data, Multilevel model
meta-analyses are increasing,[3] but practitioners may face the practical problem of obtaining IPD from only a portion of In evidence-based medical research, individual patient data the studies[4] due to economic, resource, or time constraints. (IPD) meta-analyses, which involve central collection, check- When IPD may not be available, and only aggregated data ing, and reanalysis of updated IPD, have been described (AD), such as a treatment effect estimate and its standard as the benchmark of systematic review.[1, 2] Although IPD
1. I NTRODUCTION
∗ Correspondence: Jia He; Email:
[email protected]; Address: Department of Health Statistics, Second Military Medical University, Shanghai, China.
Published by Sciedu Press
25
http://jer.sciedupress.com
Journal of Epidemiological Research
error, can be obtained from some studies.[5] These AD are mainly extracted from the published literature. The most commonly used method in meta-analysis is the synthesis of AD obtained from study publications or study authors. For time-to-event outcomes such AD often include the hazard ratio (HR) and its variance, which are calculated to present the overall instantaneous risk of an event in an experimental intervention compared with a control.[6] Metaanalysis produces a weighted average of the AD across studies to give an overall measure of treatment effect in the fixed effect model.[7] It is also combined in a random effect metaanalysis that accounts for between-study heterogeneity in treatment effect.[8] The median survival times (MSTs) and the combined HR and its 95% confidence interval (CI) are available from the IPD meta-analysis of time-to-event data,[3, 9] which could become a thorough survival analysis by assembling every individual patient from each trial. However, AD meta-analyses usually only calculate the combined HR and its 95% CI without pooled MSTs. In these circumstances AD meta-analysis in evidence-based medical research still dominates in the meta-analysis of survival data. There are some problems when conducting AD meta-analysis. Firstly, the synthesis of AD should be under the hypothesis of proportional hazards regression models for original data. However, not all the survival analysis can meet such a hypothesis, which may introduce bias for the pooled results.[10] Secondly, the combined HRs only conveys the relative hazard risk of the event between the experiment and the control groups. Researchers or individuals must evaluate the efficacy of treatment from an intuitive index. Clinicians often are more concerned about the direct effect of a treatment rather than the relative hazard risk. Thirdly, the survival curves and MSTs might be different in each group when the same HRs and 95% CIs are combined from the different meta-analysis of AD. Due to the drawbacks of pooled HRs in survival data meta-analysis, MSTs can provide more direct information of the effect of a treatment. However, an effective method of combining MSTs for each group, which could be gathered from an IPD meta-analysis of survival data, has not yet been developed for AD meta-analysis.
2015, Vol. 1, No. 1
methods to combine MSTs for meta-analyses of survival data, which may be more readily available in publications and a more direct index in survival analysis.
2. S OURCE OF DATA 2.1 Simulated data We simulated the individual patient time-to-event (survival) data following exponential distribution.[12] The simulated variables included patient number, group, survival time, and survival outcome. We manipulated the raw data in two ways. On the one hand, we calculated study-level AD from the simulated patient data. We used a proportional hazard regression model (Cox model) for constant hazards to analyze HRs and their 95% CIs of experimental effects. We used a linear interpolation method to estimate the MSTs. These AD represent the data extracted from published literature when conducting a real meta-analysis. We used the summarized data to fit the model for the synthesis of MSTs. On the other hand, we combined the raw data to construct the IPD dataset. We gathered and estimated the simulated data from each study included in a meta-analysis to obtain the IPD HR, its 95% CI, and the MST. We considered the IPD MSTs of each group to be the gold standard and compared them with the MSTs computed from the model we developed in this study. The detailed information was shown in our previous study.[13, 14] We named the eight simulated datasets of meta-analyses we generated M20S750, M20S500, M10S500, M10S300, M10S200, M5S400, M5S300, and M5S200. M refers to meta-analysis; the following number refers to the number of studies included in the meta-analysis; S refers to study; and the following number refers to the number of individual patients included in the study. Each dataset includes 15,000, 10,000, 5,000, 3,000, 2,000, 1,500, or 1,000 individual patients, and each meta-analysis includes 20, 10, or 5 studies. We derived the IPD and trial-level AD statistics from the simulated data. We calculated the MSTs from the IPD datasets as the gold standard and used the trial-level MSTs to fit the model constructed later. We conducted the simulations 500 times to obtain the gold standard and to compute MSTs from the models. Table 1 shows the simulation datasets.
Multilevel meta-analysis has been used to adjust for nonequivalent study results in meta-analytic research and to gain substantive information for evaluating treatment efficacy.[11] It also used to statistically adjust for nonequivalent or nonrandomized groups in observational research and adjust covariates or the study.
2.2 Example data: Meta-analysis of survival data We conducted the real meta-analysis, including the synthesis of MSTs, using multilevel data extracted from literature about the efficacy of small-molecule epidermal growth factor receptor, tyrosine kinase inhibitor (EGFR TKIs) on nonsmall-cell lung cancer (NSCLC) patients in different treatThe purpose of this study is to develop alternative multilevel ment programs. We collected those studies from the general databases Pubmed and Embase and from the trial registration 26
ISSN 2377-9306
E-ISSN 2377-9330
http://jer.sciedupress.com
Journal of Epidemiological Research
websites. We used the Parmar method to pool the HRs and their 95% CIs[9] and to combine the MST and the median progression time.
2015, Vol. 1, No. 1
2.3 Model evaluation Using the Bland-Altman method and the relative changes of the model value from the gold standard, we compared the consistency between the MSTs derived from our model and the gold standard values of IPD meta-analyses.
Table 1. Details of the simulated datasets Dataset
Number of studies in each meta-analysis
Number of patients in each study
Number of patients Experimental Control group group
Total number of patients in each meta-analysis
M20S750
20
750
500
250
15,000
M20S500
20
500
250
250
10,000
M10S500
10
500
250
250
5,000
M10S300
10
300
100
200
3,000
M10S200
10
200
100
100
2,000
M5S400
5
400
200
200
2,000
M5S300
5
300
150
150
1,500
M5S200
5
200
100
100
1,000
3. M ULTILEVEL MST
MODEL META - ANALYSIS OF
3.1 Normalization of the effect size We transferred the MST data into a logarithm to construct the model of the meta-analysis. In this study the MSTs are combined from the individual studies. In a meta-analysis the effect sizes are assumed to be approximately normally distributed.[6] For this study we transformed the MSTs of both the experimental and the control groups to the logarithm MSTs (log M ST ) to approach a normal distribution due to its exponential distribution.[15] The effect size of the MSTs of the experimental and the control groups are defined as Y1 and Y2 , respectively. It holds that
yij = β0 +µ0j +eij ; µ0j ∼ N (0, σµ2 ); eij ∼ N (0, σe2 ) (2) Where j = 1, 2, · · · , k refers to the level 2 unit, and where i = 1, 2, · · · , nj refers to the level 1 unit. β0 is the average effect of interest, µ0j is the random effect of the treatment for the jth study, and eij is the random residual of the treatment for subject i in study j. When using the AD from the literature, the model can be written as y·j = β0 + µ·j + e·j
(3)
Pnj where y·j = i=1 yij /nj , β0 is the average effect of interest, u = N (0, σu2 ) represents the between-study het·j Y1 = log(M edian1 ), Y2 = log(M edian2 ) (1) erogeneity, e·j = N (0, σe2 /nj ) is the within-trial sampling P where M edian1 and M edian2 denote the MST of the ex- error. V ar(µ·j ) = σu2 = τ 2 , V ar(e·j ) = var( eij /nj ) = σe2 /nj (to constrain σe2 = 1). perimental group and the control group, respectively. 3.2 Fitting the multilevel model meta-analysis of MST
We formulated a general class of meta-analysis models to MST synthesis by considering a simple two-level structure. It is assumed that we have a collection of studies, each concerned with the comparison of two treatment groups. The basic models we developed are “variance component” models with the variance heterogeneity cases incorporated.[16] For the ith subject in the jth study who received the treatment, we can write a basic underlying model for outcome yij of IPD as Published by Sciedu Press
3.3 Study weight when fitting the models 3.3.1 Study weight for model 1 We deemed the log M ST as a continuous measurement of each treatment group. We used SAS statistical software to fit the multilevel model of the MST. In SAS the model is available in a PROC MIXED model for continuous outcome measures, which fits the structure we selected to the data with restricted maximum likelihood (REML) (Leyland and Groenewegen, 2003). We set up one kind of weight for √ the experimental group as ni1 and for the control group √ as ni2 because they are commonly used and defined the 27
http://jer.sciedupress.com
Journal of Epidemiological Research
2015, Vol. 1, No. 1
the gold standard. One hundred percent of the d value is within 5% of the gold standard value for the dataset M20S750 3.3.2 Study weight for model 2 when using multilevel models 1 and 2, which means the variaWe set up another kind of weight for the experimental group tion between the calculated value and the gold standard value q )−log(HRL) 2 as SE1 = n1n+n × log(HRU3.92 and for the con- is no more than 5% of the gold standard. Table 3 presents 2 q log(HRU )−log(HRL) n1 trol group as SE2 = be- the details. n1 +n2 × 3.92 multilevel model weighted in this method as model 1.
cause the variance of log M ST results not only from the Table 2. Results of the Bland-Altman method comparing sample size of the study but also from the study’s precision. the agreement between values derived from the multilevel n1 n2 model and the gold standard from IPD n1 +n2 and n1 +n2 are the weight components of the sample )−log(HRL) size in each group of a study, and log(HRU3.92 represents the study precision of a survival analysis. We used these two weighted methods to statistically fit the multilevel models of MSTs and defined the multilevel model weighted in this method as model 2 (HRU, hazard ratio upper confidence interval; HRL, hazard ratio lower confidence interval).
4. M ODEL EVALUATION RESULTS 4.1 Bland-Altman method Using the Bland-Altman method, we compared the calculated MSTs derived from the model with the gold standard MSTs from the IPD datasets. For the multilevel model 1 of the M20S750 dataset, the mean of difference (d) between the calculated value and the gold standard is -0.052, and the 95% CI of (d) is from -1.087 to 0.984. This indicates that 95% of the derived value from our model is no more than 0.984 or less than -1.087 of the gold standard value. In other words, there is good agreement between our model method and the gold standard method (the IPD results). For the multilevel model 2, the mean of (d) between the calculated value and the gold standard is -0.105, and the 95% CI of (d) is from -1.154 to 0.944. This indicates good agreement between the calculated value using a random effect model and the gold standard method.
Model 1 Dataset
Model 2
Md
95% CI of
Md
95% CI of
M5S200
-0.230
-3.823~3.364
-0.329
-3.936~3.278
M5S300
-0.083
-3.311~3.145
-0.187
-3.424~3.050
M5S400
-0.144
-2.433~2.146
-0.194
-2.479~2.090
M10S200
-0.178
-2.698~2.342
-0.313
-2.845~2.220
M10S300
-0.097
-2.907~2.713
-0.152
-2.977~2.674
M10S500
-0.073
-2.649~2.503
-0.133
-2.710~2.444
M20S500
-0.084
-1.181~1.013
-0.140
-1.245~0.965
M20S750
-0.052
-1.087~0.984
-0.105
-1.154~0.944
Note. Multilevel model 1 weighted by
d
ni1 and ni 2 for experimental and control groups,
respectively. Multilevel model 1 weighted by
SEi 2
d
SEi1
n2 log(HRU ) log(HRL) n1 n2 3.92
and
n1 log( HRU ) log( HRL) for experimental and control groups, respectively. n1 n2 3.92
Md: mean of the difference between calculated median survival times and gold standard
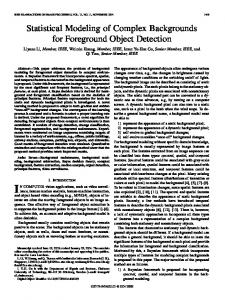
4.3 Example of a meta-analysis For our actual meta-analysis of survival data we retrieved data from trials that compared the most frequently used smallmolecule EGFR TKIs for maintenance treatment of patients with NSCLC with control groups. The effects of two maintenance treatment we compared were continuous maintenance and switch maintenance. We gathered data on overall survival (OS), progression-free survival (PFS), the MST, and the median progression time from the trials and summarized Table 2 shows the Bland-Altman results in measurement them. We identified nine trials[17–26] that included 6,655 agreements for the other datasets. All of the results indicate patients. good agreement between estimated values with both fixed and random effect models and the gold standard values for When we conducted the meta-analysis in the traditional way, the results showed that continuous maintenance with smallthe IPD datasets. molecule EGFR TKIs failed to improve OS (HR 1.05; 95% 4.2 Relative change method CI 0.98-1.14; p = .186) or PFS (HR 0.88; 95% CI 0.74-1.05; We also calculated the relative changes (pd ) of the model p = .165). In addition we combined the MSTs using the method we developed and described above and found 10.24 value from the gold standard (g) for each dataset. months for the experimental group and 10.55 months for the pd = d/g × 100% (4) control group. We found the median progression time to be 5.44 months for the experimental group and 5.37 months for d represents the difference between the calculated value and the control group (see Figure 1).
28
ISSN 2377-9306
E-ISSN 2377-9330
http://jer.sciedupress.com
Journal of Epidemiological Research
2015, Vol. 1, No. 1
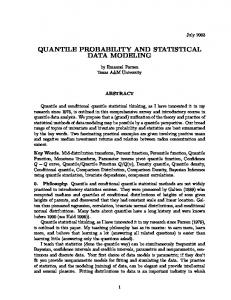
Figure 1. Combined MSTs and HRs of OS (A) and PFS (B) of continuous maintenance therapy and placebo/observation In contrast, switch maintenance with small-molecule EGFR TKIs significantly improved OS (HR 0.87; 95% CI 0.800.95; p = .001) and PFS (HR 0.75; 95% CI 0.69-0.81; p < .001) when we combined the HRs and their variances. Ad-
ditionally, the MST was 12.86 months for the experimental group and 11.44 months for the control group and the median progression time 3.53 months for the experimental group and 2.67 months for the control group (see Figure 2).
Figure 2. Combined MSTs and HRs of OS(A) and PFS(B) of switch maintenance
5. D ISCUSSION
AD meta-analysis of survival data. The results show convincTo address the limitations of traditional AD meta-analyses ing outcomes of good agreement between the results from of survival data, this study used simulated data to develop both models and real world examples. statistical multilevel models for the synthesis of MSTs in an Published by Sciedu Press
29
http://jer.sciedupress.com
Journal of Epidemiological Research
Table 3. Relative changes of the multilevel model value from the gold standard value for each dataset Dataset
M5S200
M5S300
M5S400
M10S200
M10S300
M10S500
M20S500
M20S750
Relative changes
Model 1 (%)
Model 2 (%)
< 5%
94.4
94.4
5%~10%
5.5
5.5
10%~15%
0.1
0.1
≥ 15%
0.0
0.0
< 5%
96.4
96.4
5%~10%
3.6
3.6
10%~15%
0.0
0.0
≥ 15%
0.0
0.0
< 5%
98.8
98.9
5%~10%
1.2
1.1
10%~15%
0.0
0.0
≥ 15%
0.0
0.0
< 5%
98.6
98.4
5%~10%
1.4
1.6
10%~15%
0.0
0.0 0.0
≥ 15%
0.0
< 5%
91.9
92.3
5%~10%
8.1
7.7
10%~15%
0.0
0.0
≥ 15%
0.0
0.0
< 5%
98.8
98.7
5%~10%
1.2
1.3
10%~15%
0.0
0.0
≥ 15%
0.0
0.0
< 5%
100.0
100.0
5%~10%
0.0
0.0
10~15%
0.0
0.0
≥ 15%
0.0
0.0
< 5%
100.0
100.0
5%~10%
0.0
0.0
10%~15%
0.0
0.0
≥ 15% Note. Multilevel model 1 weighted by
0.0
ni1
respectively. Multilevel model 1 weighted by
SEi 2
and
SEi1
ni 2
A previous study evaluated retrospectively the performance of meta-analyses using MST ratios, survival rates, and HRs by comparing them with meta-analyses using IPD. The results showed that the combined HRs are mostly consistent with the IPD results. The results also showed that MST ratios and survival rates are not reasonable surrogate measures for meta-analyses of survival outcomes.[8] However, the study mainly focused on comparison of the experimental and control groups. Our study mainly focused on the synthesis of MSTs in each group, which differs from the previous research. The effect sizes are log M ST s in each group in our study; the effect size is log M SR between groups in the previous study. To our knowledge no other research has developed a method for synthesis of the MSTs for each group in an AD meta-analysis of survival data.
0.0
and
n1 log( HRU ) log( HRL) for experimental and control groups, respectively. n1 n2 3.92
For time-to-event data the common distributions of survival time are exponential distribution, weibull distribution, lognormal distribution, and so on. In this study we simulated the survival time of the exponential distribution, which is considered one of the most common and basic distributions of human diseases.[27] We transferred the MSTs into a logarithm to construct the model of our meta-analysis.[15, 28] The variation among studies is assumed to be the sampling error 30
in a fixed effect model and the deviation of true effect in a random effect model.[15, 28] For the weights of the multilevel models in our synthesis of MSTs we used the square root n in each group and the standard error of log HR, which is reasonable to represent the precision of effect size.[29] Multilevel models provide a general framework for metaanalysis. This study incorporated MSTs from both multilevel model and meta-analysis perspectives. Since the analysis is based on a maximum likelihood estimation model, it can be expected to yield more efficient estimates than traditional meta-analyses.
for experimental and control groups,
n2 log(HRU) log(HRL) n1 n2 3.92
2015, Vol. 1, No. 1
In the actual meta-analysis we pooled the HRs and their variances first. Then we calculated the combined median times to provide additional information for the pooled HRs. The effect of switch maintenance with small-molecule EGFR TKIs was smaller on OS than on PFS if we based the metaanalysis only on combined HRs (HR 0.87 for OS vs. 0.75 for PFS). However, the combined median times revealed a larger difference between the two groups in MST (12.86 vs. 11.44 months, difference of 1.42 months) than in median progression time (3.53 vs. 2.67 months, difference of 0.86 months). Our results indicate that the pooled HRs and their variances were not sufficient when conducting a meta-analysis of survival data. The median times need to be combined to provide additional information. The strength of our study is that we first constructed statistical models for the synthesis of MSTs in an AD meta-analysis of survival data with multilevel models. We also tested the fitting effect using reasonable methods.[30, 31] A second strength is that we applied these models in a meta-analysis of survival data to test the feasibility of the models. The limitation of the study is that we considered no covariates in these models, and the results might be varied because ISSN 2377-9306
E-ISSN 2377-9330
http://jer.sciedupress.com
Journal of Epidemiological Research
2015, Vol. 1, No. 1
of the moderators. Readers should interpret the results calcu- of survival data can provide more direct evidence. lated from the model carefully. ACKNOWLEDGEMENTS In conclusion, the multilevel statistical models for the syn- This study was supported by the research grants of Shanghai thesis of MSTs were developed for the past meta-analysis of Municipal Bureau of Health (No.20134053), Shanghai Yangsurvival data, which we verified to have enough fitting effect. fan Talents Plan Grant (No. 15YF1411100) and the Health Combined MSTs along with pooled HRs in the meta-analysis Fields Specific Research Grant (201202012).
R EFERENCES [1] Pignon JP, Hill C. Meta-analyses of randomised clinical trials in oncology. Lancet Oncol. 2001; 2: 475-82. http://dx.doi.org/1 0.1016/S1470-2045(01)00453-3 [2] Stewart LA, Parmar MK. Meta-analysis of the literature or of individual patient data: is there a difference? Lancet. 1993; 341: 418-22. http://dx.doi.org/10.1016/0140-6736(93)93004-K [3] Simmonds MC, Higgins JP, Stewart LA, et al. Meta-analysis of individual patient data from randomized trials: a review of methods used in practice. Clin Trials. 2005; 2: 209-17. PMid:16279144. http://dx.doi.org/10.1191/1740774505cn087oa [4] Riley RD, Simmonds MC, Look MP. Evidence synthesis combining individual patient data and aggregate data: a systematic review identified current practice and possible methods. J Clin Epidemiol. 2007; 60: 431-9. PMid:17419953. [5] Simmonds MC. Statistical methodology of individual patient data. Ph.D. Thesis, University of Cambridge; 2005. [6] Michiels S, Piedbois P, Burdett S, et al. Meta-analysis when only the median survival times are known: a comparison with individual patient data results. Int J Technol Assess Health Care. 2005; 21: 119-25. [7] Whitehead A. Meta-analysis of Controlled Clinical Trials. Wiley: West Sussex; 2002. [8] DerSimonian R, Laird N. Meta-analysis in clinical trials. Control Clin Trials. 1986; 7: 177-88. http://dx.doi.org/10.1016/019 7-2456(86)90046-2 [9] Parmar MK, Torri V, Stewart L. Extracting summary statistics to perform meta-analyses of the published literature for survival endpoints. Stat Med. 1998; 17: 2815-34. http: //dx.doi.org/10.1002/(SICI)1097-0258(19981230)17: 243.0.CO;2-8 [10] Arends LR, Hunink MG, Stijnen T. Meta-analysis of summary survival curve data. Stat Med. 2008; 27: 4381-96. PMid:18465839. http://dx.doi.org/10.1002/sim.3311 [11] Thompson SG, Sharp SJ. Explaining heterogeneity in metaanalysis: a comparison of methods. Stat Med. 1999; 18: 2693708. http://dx.doi.org/10.1002/(SICI)1097-0258(1999 1030)18:203.0.CO;2-V [12] David Collett. Modelling Survival Data in Medical Research, Second Edition.Boca Raton: Chapman & Hall/CRC. 2003. ISBN 978-158488-325-8. [13] Zang J, Xiang C, He J. Synthesis of median survival time in meta-analysis. Epidemiology. 2013; 24: 337-8. PMid:23377098. http://dx.doi.org/10.1097/EDE.0b013e318282a66c [14] Zang J, Xu J, Xiang C, et al. Multi-level Model Synthesis of Median Survival Time in Meta-analysis. Epidemiology. 2015; 26: e2-3. [15] Borenstein M, Hedges L,Higgins J, et al. Computing effect sizes for Meta-analysis. 2009. Chichester: John Wiley and Sons, Ltd. Published by Sciedu Press
[16] Thompson SG, Turner RM, Warn DE. Multilevel models for metaanalysis, and their application to absolute risk differences. Stat Methods Med Res. 2001; 10: 375-92. http://dx.doi.org/10.1191 /096228001682157616 [17] Miller VA, O’Connor P, Soh C, et al. A double-blind, randomized, phase III study of maintenance erlotinib versus placebo following nonprogression with first-line platinum-based chemotherapy in patients with advanced NSCLC. J Clin Oncol. 2009; 27: 18s (suppl; abstr LBA8002). [18] Gaafar RM, Surmont V, Scagliotti G, et al. A double-blind, randomized, placebo-controlled phase III intergroup study of gefitinib (G) in patients (pts) with advanced NSCLC, non-progressing after first-line platinum-based chemotherapy (EORTC 08021-ILCP 01/03). J Clin Oncol. 2010; 28: 15s (suppl; abstr 7518). [19] Cappuzzo F, Ciuleanu T, Stelmakh L, et al. Erlotinib as maintenance treatment in advanced non-small-cell lung cancer: a multicentre, randomised, placebo-controlled phase 3 study. Lancet Oncol. 2010; 11: 521-9. http://dx.doi.org/10.1016/S1470-2045(10)701 12-1 [20] Giaccone G, Herbst RS, Manegold C, et al. Gefitinib in combination with gemcitabine and cisplatin in advanced non-small-cell lung cancer: a phase III trial–INTACT 1. J Clin Oncol. 2004; 22: 777-84. PMid:14990632. http://dx.doi.org/10.1200/JCO.2004.08.001 [21] Herbst RS, Giaccone G, Schiller JH, et al. Gefitinib in combination with paclitaxel and carboplatin in advanced non-small-cell lung cancer: a phase III trial–INTACT 2. J Clin Oncol. 2004; 22: 785-94. PMid:14990633. http://dx.doi.org/10.1200/JCO.2004.07.215 [22] Perol M, Chouaid C, Milleron BJ, et al. Maintenance with either gemcitabine or erlotinib versus observation with predefined secondline treatment after cisplatin-gemcitabine induction chemotherapy in advanced NSCLC: IFCT-GFPC 0502 phase III study. J Clin Oncol. 2010; 28: 15s (suppl; abstr 7507). [23] Kabbinavar FF, Miller VA, Johnson BE, et al. Overall survival (OS) in ATLAS, a phase IIIb trial comparing bevacizumab (B) therapy with or without erlotinib (E) after completion of chemotherapy (chemo) with B for first-line treatment of locally advanced, recurrent, or metastatic non-small cell lung cancer (NSCLC). J Clin Oncol. 2010; 28: 15s (suppl; abstr 7526). [24] Gatzemeier U, Pluzanska A, Szczesna A, et al. Phase III study of erlotinib in combination with cisplatin and gemcitabine in advanced non-small-cell lung cancer: the Tarceva Lung Cancer Investigation Trial. J Clin Oncol. 2007; 25: 1545-52. PMid:17442998. http://dx.doi.org/10.1200/JCO.2005.05.1474 [25] Herbst RS, Prager D, Hermann R, et al. TRIBUTE: a phase III trial of erlotinib hydrochloride (OSI-774) combined with carboplatin and paclitaxel chemotherapy in advanced non-small-cell lung cancer. J Clin Oncol. 2005; 23: 5892-9. PMid:16043829. http: //dx.doi.org/10.1200/JCO.2005.02.840
31
http://jer.sciedupress.com
Journal of Epidemiological Research
[26] Mok TS, Wu YL, Yu CJ, et al. Randomized, placebo-controlled, phase II study of sequential erlotinib and chemotherapy as first-line treatment for advanced non-small-cell lung cancer. J Clin Oncol. 2009; 27: 5080-7. PMid:19738125. http://dx.doi.org/10.12 00/JCO.2008.21.5541 [27] Ritesh S, Keshab M. Survival analysis in clinical trials: Basics and must know areas. Statistics. 2011; 2: 145-48. [28] Michael B, Hedges LV, Higgins JPT, et al. Introduction to MetaAnalysis. 2009 John Wiley & Sons, Ltd. ISBN: 978-0-470-05724-7.
32
2015, Vol. 1, No. 1
[29] Tierney JF, Stewart LA, Ghersi D, et al. Practical methods for incorporating summary time-to-event data into meta-analysis. Trials. 2007; 8: 16. PMid:17555582. http://dx.doi.org/10.1186/1 745-6215-8-16 [30] Bland JM, Altman DG. Statistical methods for assessing agreement between two methods of clinical measurement. Lancet. 1986; 1: 307-10. PMid:2868172. [31] Bland JM, Altman DG. Measuring agreement in method comparison studies. Stat Methods Med Res. 1999; 8: 135-60. http: //dx.doi.org/10.1191/096228099673819272
ISSN 2377-9306
E-ISSN 2377-9330