Statistical Natural Language Processing
Running Head: STATISTICAL NATURAL LANGUAGE PROCESSING
Using Statistical Natural Language Processing for Understanding Complex Responses to FreeResponse Tasks
Sarah F. DeMark John T. Behrens Cisco Systems, Inc. San Jose, California
To appear in The International Journal of Testing
1
Statistical Natural Language Processing
2
Abstract Whereas great advances have been made in the statistical sophistication of assessments in terms of evidence accumulation and task selection, relatively little statistical work has explored the possibility of applying statistical techniques to data for the purposes of determining appropriate domain understanding and to generate task-level scoring rules. Now that complex tasks are becoming increasingly prevalent, the inattention to item-level scoring is becoming more problematic. This study utilized exploratory techniques to examine the differences between experts and novices in command usage and troubleshooting strategies in the field of computer networking. Participants were students and instructors of the Cisco Networking Academy Program as well as experts from the field of networking. Each participant was asked to perform troubleshooting tasks and a log of their actions was recorded. Log files containing all commands that participants entered while completing the troubleshooting tasks were analyzed using techniques of Statistical Natural Language Processing. Results indicated that experts and novices differed in the types of commands that were used as well as in the sequence of those commands. Moreover, some patterns of examinee response that were found were entirely unexpected, leading to a rethinking of the appropriate conceptualization of the domain and the tasks. Previous assumptions about expert novice differences were shown to be faulty along with previously constructed scoring rules based on those assumptions. Comprehensive research in the application of statistical techniques to the understanding of domains and the validation of scoring rules are recommended.
Statistical Natural Language Processing
3
Using Statistical Natural Language Processing for Understanding Complex Responses to FreeResponse Tasks
Advances in electronic computing have led to numerous changes in design, implementation, and analysis of psychological and educational assessment activities (Behrens, Mislevy, Bauer, Williamson, & Levy, in submission). Despite these many advances, the application of modern statistical and computing methods have had little impact on the essential step of evidence rule specification and task model development. This is unfortunate because the value of sophisticated presentation modes will not be realized if equally appropriate response processing models are not developed to capture the rich information offered. This is especially true in the case of rich performance-oriented tasks. The purpose of this study is to explore the possibility that statistical examination of work products from tasks with open-response formats can be useful for identifying or validating evidence identification rules. This will be accomplished by examining extensive work-product data from the NetPASS troubleshooting activity (Williams et al., in submission) using the principles of Exploratory Data Analysis (Tukey, 1977; Behrens, 1997) and the computing procedures of Statistical Natural Language Processing (Manning & Schutze, 2001). Evidence-Centered Design and Evidence Rules As described in Behrens, Mislevy, Bauer, Williamson, & Levy (in submission), an important part of Evidence Centered Design is the specification of the various assessment elements in assessment delivery as detailed in the Four Process Model. Among other things, this model highlights the important distinction between scoring a test and scoring an individual task
Statistical Natural Language Processing
4
or item. It is this distinction that brings to light this need for progress in item-level/task-level scoring. (Almond, Steinberg, & Mislevy, 2002; Mislevy, Steinberg, Almond, 2003; Mislevy, Steinberg, Almond, Haertel, & Penuel, 2003; Mislevy, Steinberg, Breyer, Almond, Johnson, 1999, 2002; Mislevy, Wilson, Ercikson, & Chudowosky, 2003). Evidence Rules Evidence rules serve to characterize an examinee’s work product for characteristics relevant to the claims of the assessment. When evaluating a performance task, the evidence rules may focus on the final work product or may focus on the processes that were used to achieve the final work product. Evaluation of a work product may focus on the overall correctness and the observable may be as simple as an overall right/wrong determination. However, the evaluation may be more sophisticated by focusing on several aspects of the work product or using a partialcredit scoring model. To identify rules appropriate for open-ended tasks, assessment developers rely largely on the opinion of expert judges, or empirical study through cognitive task analysis (e.g Williamson et al., in submission). While widely used, expert opinions for the determination of scoring rules suffers from variability in expert’s views concerning critical attributes of the scoring and their relationships to total outcomes. In addition, because experts are likely trying to articulate their own internal theory regarding the relationship between activity and outcome, they may fail to report the rules they actually use. Cognitive task analysis and the related tool of protocol analysis (e.g. Eriksson and Smith, 1991), attempt a more systematic and empirical approach to rule identification; yet the interpretation of verbal and behavioral protocol data likewise have no objective standard for evaluation and application.
Statistical Natural Language Processing
5
As an alternative to these often highly interpretive approaches, we ask what statistical models can be brought to bear to make sense of the data that occurs in open-format tasks such as network troubleshooting. Can a statistical process be used that may suggest different rules than the expert opinion and if so, what is the relative quality of the proposed rules for discriminating experts and novices on other measures? Even if discriminating rules cannot be found, can we identify statistical procedures that may provide other valuable information in the hunt for objective and possibly automated pattern recognition of examinee behavior patterns? While there are troubleshooting procedures that are generally regarded as being indicative of expertise, there has been no quantitative research performed to corroborate this assumption. Accordingly, we wish to advance the argument for using data analytic methods to construct scoring rules to identify procedural differences between experts and novices when solving troubleshooting tasks. Choice of Statistical Models The statistical models that would be appropriate for use in identifying patterns of examinee behavior that are relevant to evidence rule construction will vary with the application. However, in many performance-oriented tasks with continuous verbal or written interactions, the performance may be conceptualized as a dialog between the examinee and the environment (in this case a computer network). Insofar as this is an appropriate conceptualization, this view suggests the appropriateness of statistical clustering and pattern identification methods used in the Statistical Natural Language Processing (SNLP) literature (e.g. Manning & Schutze, 2001). Human-computer interaction (or similar) activity has much in common with natural discourse in that it occurs over time, has syntactical rules and regularities, and varies in inputs depending on
Statistical Natural Language Processing
6
the outputs that occur from the other “speaker”. A large collection of human interactions with a computer or network system could serve as a “corpus” as found in natural language text corpora and variations with those data could be examined. Application of these techniques may reveal differential patterns of human-computer interaction that are difficult to see in small-n cognitive task analyses or in the implicit mental models of experts. On the one hand, these techniques may identify patterns that were otherwise unexpected and may illuminate the cognitive processes that occur in the domain. Alternately, some patterns may emerge that match the patterns suggested by instructional experts. This would allow the validation of the content of some rules, in addition to the external validation of the outcome of the rules, which is generally done in the post-hoc validation study. A third possibility is that little is learned from the results of these analyses. The troubleshooting procedures that were observed during the cognitive task analysis (see Williamson, in submission), such as testing the network after changes are made, were included in the scoring of the these tasks in the NetPASS prototype. However, these rules had not been empirically evaluated using a quantitative approach. This study will seek to validate the current rules regarding troubleshooting procedures using an approach commonly used in Statistical Natural Language Processing studies. In finding statistical differences between the troubleshooting procedures used by experts and novices, it may then be possible to provide more informed feedback and scoring to students performing various troubleshooting tasks. Determining key characteristics of experts will allow specific feedback to be given to students so that they can use that information in further developing their troubleshooting abilities. Success in this particular domain would suggest the
Statistical Natural Language Processing
7
value of broader application of statistical pattern recognition approaches following SNLP for evidence identification of work products from free-response tasks. METHOD Study Design The study used a two-group (expert and novice) contrasting groups design. A number of exploratory procedures from the field of Statistical Natural Language Processing (SNLP) were applied to the performance records of examinees completing troubleshooting tasks on networks of routers. Statistical procedures were applied to combined data, as well as expert and novice subgroups when possible. Data Coding Tokenization Tokenization concerns the specification of usable meaning units or “tokens” by identifying features that are common across class of word (or sentence) variants. For example, in analyzing English language text the researcher must decide if “walked”, “walk”, and “walking” are to be treated as a single class (walk) or should be treated as separate instances. In the case of router commands used to configure and troubleshoot computer networks, a similar process was undertaken. Stemming To determine the unit of analysis in this study, a process called “stemming” was utilized. This method concluded that some parts of a command line could be removed, much as the way the “ed” or “ing” could be removed from walk, leaving the resulting command with the same underlying meaning.
Statistical Natural Language Processing
8
Collocations When examining English language work products, the text can also be examined for collocations. A collocation is a phrase or group of words that have a semantic meaning that is more than the sum of its parts. An example of this in English would be “hard drive”. Separately these two words mean very different things than they do when taken together. This same logic was applied to router commands. N-Grams To find these collocations, the n-gram frequencies were examined. N-grams employ a process of combining sequential commands. Bi-grams, for example, look at sets of two commands that occur together; tri-grams look at sets of three commands. These frequencies helped to determine which command words needed to be combined into one token. For example, there are over a dozen different commands that begin with the word “show”. Therefore, the n-gram analysis flagged words like “show” as needing to be combined with the next word in the command line, resulting in “show run” or “show interface”. Tagging Once these commands were recoded to their appropriate level of analysis, they were tagged with a function characterization. This is analogous to tagging English words with their part of speech. There were several functions that these router commands performed as part of these troubleshooting activities: 1. query commands (i.e., commands that show different router states, like “show run”); 2. fix commands (i.e., commands that attempt to fix a problem in the network by performing a change to the configuration, like “no shutdown”);
Statistical Natural Language Processing
9
3. test commands (i.e., commands that test of network functionality; like “ping”); 4. mode commands (i.e., commands that change the router mode so that other commands can be entered); 5. save commands (i.e., commands that save the current router configurations); 6. help commands (i.e., commands that request help with command syntax, like “router ?”); and 7. errors (i.e., commands that were incorrect because of incorrect command syntax or commands entered at the inappropriate mode). Other Techniques Frequency analyses were performed to determine which commands were most commonly used. An analysis of command sequence and command-tag sequence was also performed. This was used to determine which commands were most likely to follow other commands or which command types were most commonly found in a sequence. Cluster analyses were also performed to determine the similarity of different command patterns. This attempted to discern whether there were different troubleshooting clusters by determining whether commands in the same category grouped together. Group Differences The next step was to determine whether there were pattern differences between experts and novices. To examine the possibility of different patterns in command usage and clustering across novice and expert groups, the above procedures were repeated for both experts and novices. Membership in these groups was determined using learner role (instructor, a professional from the field (experts), or a student (novices)), along with responses on the
Statistical Natural Language Processing
10
questionnaire regarding the participant’s self-rated network proficiencies, teachers ratings on students’ proficiency levels in both networking knowledge and networking skill, and performance on a multiple-choice test that assessed networking knowledge. Instructor ratings of students were made on a scale of 1-5 where a rating of one is considered to be novice and a five is considered to be performing at an advanced level. These categorizations lead to the classification of 32 novices and 24 experts. Participants There were 196 participants who were registered to take part in this study. There were 57 participants that completed the first troubleshooting activity. Many participants did not complete the first troubleshooting activity due to time constraints or lack of interest. Participants were primarily students (n=48) and instructors (n=5) from the Cisco Networking Academy Program. The students and instructors were from both high schools and colleges across the United States as well as in Australia. Students came from a variety of educational backgrounds and had a wide variety of networking experience. There were also a few additional experts (n=4) from the networking field that were also invited to participate. The field experts in this study were employees of Cisco Systems, Inc.; they were considered to be technical experts in the field of networking due to their on-the-job experience. All participants chose to take part in this study voluntarily. As part of their participation, students gained experience and received diagnostic feedback regarding their performance on these troubleshooting tasks.
Statistical Natural Language Processing
11
NetPASS Activities For the purposes of this study, the focus was on the activities associated with network troubleshooting tasks. The troubleshooting task required participants to locate and correct erroneous IP addresses as well as to repair an incorrect routing protocol across multiple routers. To complete these troubleshooting tasks students logged onto a remote set of live routers. These routers were pre-configured and included a few pre-specified faults. It was the participant’s job to identify and repair the faults in the system and indicate their completion of the problem. Tasks could take anywhere from 15 minutes to over an hour to complete. Some students completed the troubleshooting activity more than once; in these instances, only the participants’ first attempts were examined as part of this study. Participants received feedback on their performance based on the final state of the network as well as for their troubleshooting strategies. All of the actions that a participant produced while performing these tasks were recorded in a log file. This file documented all of the commands that were entered by the participant and upon completion was sent to the scoring engine for evaluation. This log file was used to collect the data of the students’ actions for this study. RESULTS Data Reduction Tokenization and Stemming A total of 4574 commands and over 750 unique commands were issued across the 57 participants for the troubleshooting activity. The cleaning and standardizing of these commands was one of the largest challenges of this study. For example, to show the current configuration of a router a participant may use the command “show run”, which displays the current running
Statistical Natural Language Processing
12
configuration of the router. However “show run” is actually an abbreviation for “show runningconfiguration”. “show” can also be abbreviates as “sho” or even “sh”. There are also many abbreviations that can be used for “running-configuration” including “run”, “runn”, “running”, and “running-config” just to name a few. Therefore, there can be many possible ways to represent this single command. Because these variations all have the same goal for the router , these commands were consolidated into a single token of “show run”. This abbreviation of commands was a very frequent occurrence and arose not only for abbreviations of text-based commands but also for certain keystrokes. For example, the “exit” command, which is used to change modes of the router, can also be accomplished by “[Control] Z”. Therefore, these types of abbreviation needed to be reconciled as well.
Statistical Natural Language Processing
13
To further consolidate the more than 750 commands it was decided that the intended function of the command could be ascertained from the first word of the line of syntax, sometimes with the addition of a couple subsequent words. For example, when a participant wanted to test the functionality of the network they often issue a “ping” command. This command tests to see if one router can communicate with another router. There are several ways to issue this ping command, such as “ping 212.56.25.65” or “ping central”. The IP address portion can be substituted for any router’s IP address (in this case “212.56.25.65”) or the name portion can be substituted for any router’s host name (in this case “central”). However, these commands are essentially performing the same task. They are both testing connectivity to another router. Therefore, stemming was used to consolidate all versions of “ping” commands into a single token: “ping”. N-grams In many cases the first word of a syntax line was sufficient for determining the intended function of the command. However, there were some instances where more than the first word was required. To establish this, the frequencies of all the first words were examined. If there was a high usage of a particular first word then the second word was also assessed to determine whether it added a more accurate meaning. The “show” command was the first word for over 1000 of the commands. However, appropriate interpretation requires more information because there are over a dozen different router characteristics that could be requested through commands beginning with “show”. Therefore, the first word “show” was concatenated with the second word of the command, such as “run” or “route”, making a bi-gram. There were also a few cases where tri-
Statistical Natural Language Processing
14
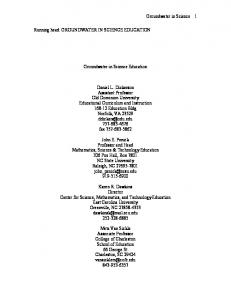
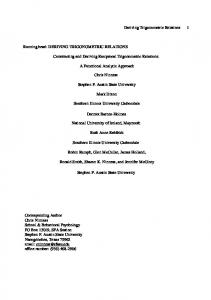
grams were used. This consolidation was done for many different types of commands as long as the intended function of the original command was preserved. This step brought the number of unique commands to 72. Tagging Once the commands had been cleaned and standardized, the next task was to tag each of the commands according to its use category. After the commands were initially classified, a separate subject matter expert independently classified the commands using the seven categories specified above. In the few instances of disagreement a third rater was used for the final categorical determination. Table 1 shows the number of commands that comprise each category and examples of each. Frequencies The distribution of tokens was extremely skewed with a mean frequency of 63 and a median of six. Figure 1 is a box-plot of the distribution of frequencies. The frequency of the different command types is depicted by level of expertise in Figure 2. Mode changes were the most prevalent type of command and commands that fix router elements are the second most frequent type of command. Sequence of Troubleshooting Procedure Errors and help commands
Statistical Natural Language Processing
15
Error commands were predominately preceded and followed by commands that were mode changes. This seemed to indicate that the reason for the erroneous command was that it was entered in the wrong router mode; hence, the change in router mode after the initial command error. The majority of help commands were preceded and followed by other help commands. There was also a high rate of errors that preceded help commands, suggesting participants were most likely to ask for syntax help after they have just issued an incorrect command. Because the errors and the help commands impeded the intended flow of the participant’s troubleshooting procedures and were not germane to other classifications, subsequent sequence analyses were completed with the errors and help commands removed. This lead to a total of 3795 commands across all participants. The mode commands were likewise uninformative as to an examinee’s goal and were removed from further analysis leaving a total of 2360 commands across all participants. Differences Between Experts and Novices Token Frequencies Table 2 displays the frequencies, expected values, and residuals for both experts and novices for the most frequently used tokens. The pattern of residuals (obtained from chi-square expected values) indicates the differences between experts and novices occurred most strongly in the use of show commands. Although, “showrun” was the most frequently used show command by both groups, it appears that novices have a higher reliance on this type of show command. Other show commands that have a high frequency are “showiproute” and “showinterface”; which are more specialized show commands and seem to be used more by experts. Another big
Statistical Natural Language Processing
16
residual comes with the “ping” command. This is the only test command and experts use it more frequently. Another interesting result in Table 2 is that all of the commands that have a negative residual for the experts (other than the “showrun” command) are “fix” commands. This indicates that novices tend to use more commands to fix network problems. Command Category Frequencies Table 3 provides the frequencies, expected values, and residuals for each of the command categories. There are many large residuals in this table. This table confirms that novices use more fix commands as evidenced by the large positive residual for novices. This table also shows that experts tend to use more testing commands than novices. The largest residual is the most surprising; experts are more likely to make errors. Experts are also slightly more likely to use the routers’ help feature. Novices also use more mode changing commands. This suggests that novices may not be as capable with navigating through the router modes. These patterns are also reflected in Figure 2. Sequence of Troubleshooting Individual frequencies, bi-grams, tri-grams, and quad-grams were computed. An analysis of bi-gram sequences revealed that sequence bi-grams that contain fixes or queries are more likely to be from a novice while sequences which include tests are more likely to be from an expert. The “query | test” and “test | query” sequences were such that novices are more likely to query before they test and experts are more apt to query after they test. Quad gram frequencies are presented in Table 4 where it can be seen that experts are more likely to fix multiple problems at one time (i.e., positive residual for “fix | fix | fix | fix”).
Statistical Natural Language Processing
17
Novices are more apt to undertake repetitive queries. Most of the sequences revolve around patterns of fixing and querying and they all have positive residuals for novices. Command Counts The number of commands that a participant used to complete this troubleshooting task was also examined. Across all participants, the mean total command count was 77 commands with a median of 71. Analyzing the command count differences between experts and novices shows that experts tend to use a higher number of commands for this troubleshooting activity. Novices have a mean command count of 72 and a median of 57 while experts have a mean of 85 and a median of 77. Cluster Analyses To gain further insight into the structure of the data, cluster analyses were performed. Clusters were examined across all participants and then separately for experts and novices. These analyses were performed on the dataset that included all command types, including errors, help, and mode commands. Commands that had a frequency of three or less were excluded from this analysis because they were thought to add additional complexity to the clusters while offering little additional information. This cluster analysis was also based on a collocation window of five. This means the frequency table of co-occurrence that served as basis for the cluster analysis included cooccurrence counts for any commands within four commands of each other. The frequency table was transformed into a similarity matrix of correlations of frequencies by correlating each vector of frequencies with every other vector. In a final step, this matrix was changed into a dissimilarity matrix by changing the correlations to squared correlations (keeping the original
Statistical Natural Language Processing
18
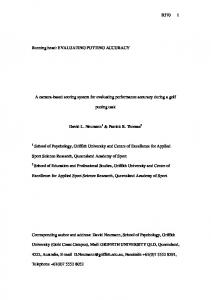
sign), adding a constant of 1 to each value, and subtracting the values from 2. In this way a perfect positive correlation of 1.0 would be transformed to a perfect dissimilarity of 2 – ((1*1) + 1)) = 0. A perfect negative correlation of frequencies would yield: 2 - (- (1*1) +1) = 2. In this way the highest value is 2, indicating high dissimilarity (following from the negative correlation) and the lowest value is 0, indicating low dissimilarity following from the perfect positive correlation of frequencies. Novices. Cluster analyses were also performed for novices and experts separately. Novices used 35 unique commands with a frequency of four or more. The dendrogram for novices is show in Figure 3. The two most similar pairs of words on this dendrogram are “interface” and “ipaddress”. One of the interesting details about this pair is that it is associated with the most similar pairing from the overall group, “ipaddress” and “noshutdown”. When configuring an IP address on a router there are generally three steps that need to be performed. First, the interface must be specified (i.e., “interface”). Next, the IP address is specified (i.e., “ipaddress”). Many people then use the “noshutdown” command, which essentially turns the interface on. Therefore, the pairing from the novice group highlights the beginning commands for configuring an IP address while the overall participant’s similar pair concentrates on the ending commands for that same objective. With this group there was a large first cluster that needed to be broken up. Therefore, the number of clusters needed to be increased to thirteen. The first cluster contained many of the “fix” commands. However, this cluster also contained the errors. In addition, to the many fix commands there was also a single query command,
Statistical Natural Language Processing
19
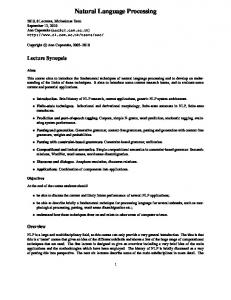
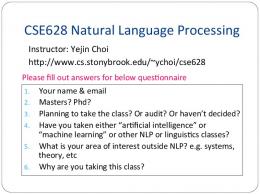
“showipinterface”, which requests information about certain features of the router’s interfaces. This may be important because many of the fix commands in this cluster are repairing problems on the router’s interfaces. The second cluster includes commands that are used to configure passwords on a router. Cluster 3 contains the “First” and “Last” markers, which indicates the beginning and end of a participant’s log file. Cluster 4 contains commands that are not required by this scenario and do not fix any of the faults on the network. Cluster 5 contains many query commands, including the three most frequently used “show” commands. There is also the testing command, “ping” and the help commands. There are several mode- changing commands and a save command. The fix commands have low frequency of usage and are not necessary to fix the network problems. The remaining clusters are single-command clusters. Experts. Experts used 37 unique commands with frequencies over three. The dendrogram for clusters of experts is in Figure 4. This graphic shows a picture of clusters that are more clearly separated. The most similar command pairing for experts were two fix commands but they are intending to correctly configure routing protocols rather configuring IP addresses on the router’s interfaces. This differs from the novice group. In fact, there were well-sized interpretable clusters when commands were grouped into just five clusters. Again, the first cluster seemed to be made up of commands that fix various components of a router. The second cluster, again, appears to be the password cluster. Cluster 3 contains the majority of query commands as well as the same mix of other command types that were found in equivalent clusters in the other groups, such as saves, tests, errors, help, and mode
Statistical Natural Language Processing
20
changes. Cluster 4 is the “First” and “Last” section breakers from the participants. Again, the last cluster with the few commands seems to be a cluster that is comprised of commands that were not used frequently and were not necessary for completing the task. DISCUSSION Prior to this study, the assessment developers believed that they had a sufficiently rich mental model of the assessment task on which to base their rule generation. The analysis reported here, however, suggests that those models were quite broad and failed to capture descriptions of variation across individuals and groups that are pertinent to the specification of response scoring rules. Moreover, in some cases rules based on expert judgment were wrong, and in other cases patterns were revealed that were previously unarticulated and highly relevant to identifying scoring rules. These findings emphasize the importance of detailed statistical analysis of work-product data to augment other rule generating processes such as expert opinion or CTA. In addition, it recommends the additional use of SNLP for subsequent study. The value of this activity is felt in a number of areas including domain description, identification of expertise, and the construction of scoring rules. Domain Description With the use of techniques commonly used in SNLP, a language for the underlying structure of the troubleshooting strategies and processes has begun to be uncovered. At every step of the process the specificity required for statistical analysis led to detailed consideration of the work products. For example, before beginning the statistical work, there was a large amount of recoding that was required. Command lines were tokenized and n-gram frequencies were calculated in order to derive the most meaningful concatenation of commands. The shift from
Statistical Natural Language Processing
21
754 unique commands to the use of 72 unique command tokens reflects a marked improvement in the researcher’s understanding of the relationship between user goals and command syntax. This was a valuable side effect of the statistical process – the researcher is forced to consider the data in great detail to complete the quantification. Tags for the different commands were based on the intended function of that command. While it was informative to look at patterns in the occurrence of errors and help commands it was determined that these types of commands hid the true intended strategy of the participants; mode commands were also masking the underlying process. Therefore, many of the analyses centered on the more action-oriented commands such as testing, querying, fixing, and saving. In addition to forcing the consideration of the meaning and goals associated with commands in the work product, a number of unexpected empirical findings forced the assessment researchers to reconsider their original assumptions. For example, participants tended to use repetitive command types during troubleshooting such as fixing several network problems at once before going on to test their fixes or to run queries to assess whether their repairs fixed the problem. In addition, queries usually preceded and followed the fix commands whereas the tests were clustered around the queries. Although save commands did not appear in the list of high frequency sequences, they were most likely to follow queries. In general, these findings were very much unanticipated, pointing out the importance of statistical work to augment evidence rule generation based on non-statistical analyses. Identification of Expertise The results from this study suggest that there are common commands and patterns of commands that are indicative of either expert or novice troubleshooting behavior. Experts use
Statistical Natural Language Processing
22
commands that are more specific and targeted, whereas novices use more global commands. This seems to suggest that experts have a better understanding of what the problem is or where the problem is located and knows which commands to use to efficiently find the answers. Novices tend to use more of a ‘looking around’ approach to locate the network problems. When looking for network problems, novices take the approach of using many of the query commands to look for incorrect configurations. For example, they will do a “showrun” command and look at the current router configuration. They will match different elements of the actual configuration to the intended configuration. If there are inaccuracies they will fix them. Experts, on the other hand, do more tests to assess network functionality. It seems as if their approach is to perform these tests in order to determine the nature of the problems as well as to pinpoint possible locations where the potential problems may lie. Experts will then follow up with some query commands in order to find and subsequently fix the problem. These findings, and the results of the command clustering procedures, are consistent with the empirical literature on expert/novice differences in which automaticity of knowledge and deep structure representations are key elements. At the same time, here again, many of the results concerning expert/novice differences were either unanticipated or opposite previous expectation. For example, the original evidence rules included one which took into account the number of times that students utilize the router’s help feature during the troubleshooting task; after a small baseline, estimates of candidate ability were lowered as more help was used. Since this study has shown that experts have a higher tendency for using help commands, the validity of this rule may need to be reevaluated. Another evidence rule examines the total number of commands that a student uses to complete the
Statistical Natural Language Processing
23
troubleshooting task as a way of measuring a student’s efficiency. This study also showed that experts had a higher average number of commands; therefore, this rule may need to be evaluated as well. One of the dangers with scoring procedures on performance assessments is the possibility of perpetuating myths about how students solve the tasks. The case above is an example of this type of misconception. Common sense seems to imply that experts would not need to rely on help as frequently as novices and they would be able to complete the task in fewer steps. However, the data suggests otherwise. This point serves to show that a greater understanding of the patterns and structure of the data is necessary before undertaking a complex performance task which utilizes scoring based on a participant’s processes and strategies. Understanding of the task and its interpretation These findings also suggest that revisions might be necessary for the troubleshooting scenario itself. Another unexpected result was the relatively high occurrence of participants configuring passwords on the router. Although, the actual frequency of these commands did not stand out like a huge red flag, this surprise was more evident in the “password configuring” cluster that occurred in all groups. Passwords were not intended to be one of the network problems; however, many participants decided that they were. There are many options to remedy this confusion. Changes could be made to the scenario that would explicitly state that the passwords need not be configured. Changes could also be made to the pre-configured routers where the password is already configured.
Statistical Natural Language Processing
24
Limitations of the Study The empirical findings reported here should be considered preliminary for a number of reasons including relatively small sample size and participant mortality. However, because the work products are digital, automatically collected, and the computer code for analysis is written, rectifying this deficiency should not be problematic. We believe this exploratory research was a good first step in trying to make sense of the troubleshooting procedures of both experts and novices; however, like other preliminary examinations of a new field, there are many more analyses that might have been performed Future Research The efforts reported here represent initial steps at a detailed model of troubleshooting activity. Because both the domain and the application of these techniques are novel, numerous variations on the analyses reported here can be conducted. For example, while some commands were labeled as errors, the reason for their incorrectness was not examined as part of this study. Other variations on the analysis include the possibility of further dividing some groups of commands (e.g. the fix group), looking at patterns of errors as they occur over the course of examinee activity, comparing patterns across variations in troubleshooting tasks, varying criteria for considering individuals as experts or novices, and tagging commands according to the examinee’s exposure to them in the Networking Academy curriculum. Variations in statistical details could also be varied including the size of the window for collocations that fed into the cluster analysis or the range of commands that were eligible based on their overall frequency.
Statistical Natural Language Processing
25
Implications for Assessment Development As assessment presentation and work products become more complex an increased burden on scoring complexity and validity occurs. Frequently, well detailed models exist for behavior around fixed-choice tasks or highly specific cognitive activities (Embretson, 1998), yet the inductive development of models based on statistical analysis has had less treatment in the literature. As illustrated here, open-response tasks may have a rich structure that is important to understand to appropriately model expertise on the task. Statistical analysis of work products may lead to a greater understanding of the domain and patterns of expertise in the domain. Use of such techniques as protocol analysis provide insight into deep underlying processes of individuals, but may overlook other patterns that must be observed through relatively larger sample exploratory work as shown above. It is important to conceptualize the work described here in the larger context of the four process model, while we believe natural language analysis techniques such as SNLP are extremely valuable, they are only one class of statistical models that can be used. More broadly, however, we want to argue that if the psychometric community put equal effort into statistical advancement of evidence identification processes as they have into evidence accumulation, the quality of assessment activity would be greatly improved. Both from a statistical/informational and evidentiary/philosophical viewpoint, the quality of the evidence accumulation and task selection is constrained by the quality of the scoring rules used. The results presented here suggest there are many underutilized techniques that the statistical community can bring to bear on this problem.
Statistical Natural Language Processing
26
References Almond, R. G., Steinberg, L. S., & Mislevy, R. J. (2002). Enhancing the design and delivery of assessment systems: A four-process architecture. Journal of Technology, Learning, and Assessment, 1(5). http://www.bc.edu/research/intasc/jtla/journal/v1n5.shtml Behrens, J. T. (1997). Principles and procedures of exploratory data analysis. Psychological Methods, 2, 131-160. Behrens, J. T, Mislevy, R. J., Bauer, M., Williamson, D. W., & Levy, R. (in submission). Introduction to Evidence Centered Design and lessons learned from its application in a global e-learning program. International Journal of Testing. Embretson, S. E. (1998). A cognitive design system approach to generating valid tests: Application to abstract reasoning. Psychological Methods, 3, 380-396. Ericcson, K. A., & Smith, J. (1991). Prospects and limits of the empirical study of expertise: An introduction. In K. A. Ericcson & J. Smith (Eds.), Toward a general theory of expertise (pp. 1-38). Cambridge, England: Cambridge University Press. Manning, C. D., & Schutze, H. (2001). Foundations of statistical natural language processing. Cambridge, MA: The MIT Press. Mislevy, R. J., Steinberg, L. S., & Almond, R. G. (2003). On the structure of educational assessments. Measurement: Interdisciplinary Research and Perspectives, 1, 3-62. Mislevy, R. J., Steinberg, L. S. Almond, R. G., Haertel, G., & Penuel, W. (2003). Leverage points for improving educational assessment. In B. Means & G. Haertel (Eds.), Evaluating the effects of technology in education (pp. 149–180). New York: Teachers College Press.
Statistical Natural Language Processing
27
Mislevy, R. J., Steinberg, L. S., Breyer F. J., Almond, R. G., & Johnson, L. (1999). A cognitive task analysis, with implications for designing a simulation-based assessment-based assessment system. Computers and Human Behavior, 15, 335-374. Mislevy, R.J., Steinberg, L.S., Breyer, F.J., Almond, R.G., & Johnson, L. (2002). Making sense of data from complex assessments. Applied Measurement in Education, 15, 363-378. Mislevy, R. J., Wilson, M. R., Ercikan, K., & Chudowsky, N. (2003). Psychometric principles in student assessment. In D. Stufflebeam & T. Kellaghan (Eds.), International handbook of educational evaluation (pp. 489-531). Dordrecht, Netherlands: Kluwer Academic Press. Tukey, J. W. (1977). Exploratory data analysis. Reading, MA: Addison Wesley. Williamson, D. M., Bauer, M., Steinberg, L. S., Mislevy, R. J., & Behrens, J. T. (in submission). Design rationale for a complex performance assessment. International Journal of Testing.
Statistical Natural Language Processing
28
Author Note Sarah F. DeMark and John T. Behrens, Assessment Development and Innovation, Cisco Systems, Inc., San Jose, California. The NetPASS research project described in this paper was supported in part by the Cisco Learning Institute. The authors would like to thank the Institute for its generous support. The research reported here was conducted as part of Dr. DeMark’s Doctoral Dissertation. The authors would like to thank Joseph Ryan, Roger Millsap, and Robert Mislevy for their assistance. Correspondence regarding this article should be sent to Sarah F. DeMark, Assessment Development and Innovation, Cisco Systems, Inc. 720 East Tasman Rd. San Jose, CA.. Email:
[email protected].
Statistical Natural Language Processing Table 1 Number of Commands and Examples for Each Command Type
Command Type
Number of Commands
Command Examples
Mode
9
exit config t
Fix
35
router igrp ip address
Query
21
show run show ip route
Test
1
Error
unlimited
Save
4
ping wrong syntax wrong mode copy run wr
Help
unlimited
any “?”
29
Statistical Natural Language Processing Table 2 Actual, Expected, and Residual Frequencies for the Most Common Tokens of Experts and Novices
Expert
Novice Tokens
Actual
Expected
Residual
Actual
Expected
Residual
showrun
297
273
+24
200
224
-24
ping
235
246
-11
213
202
+11
ipaddress
128
119
+9
89
98
-9
showiproute
94
103
-9
93
84
+9
network
80
81
-1
67
66
+1
noshutdown
90
81
+9
57
66
-9
routerigrp100
56
53
+3
41
44
-3
showinterface
33
48
-15
54
39
+15
copyrun
40
43
-3
38
35
+3
noipaddress
32
26
+6
16
22
-6
30
Statistical Natural Language Processing Table 3 Actual, Expected, and Residual Frequencies for Command Categories of Experts and Novices
Novice Command Type
Actual
Expected
Residual
Expert Actual
Expected
Residual
Mode
797
773
+24
638
662
-24
Query
499
481
+12
394
412
-18
Fix
511
485
+26
389
415
-26
Test
235
241
-6
213
207
+6
Error
190
230
-40
236
196
+40
Save
51
64
-13
68
55
+13
Help
34
43
-9
45
36
+9
31
Statistical Natural Language Processing
Table 4 Actual, Expected, and Residual Frequencies for the Most Common Four-gram Sequences of Experts and Novices
Novice 4-gram
fix | fix | fix | fix
Actual Expected Residual
Expert Actual Expected Residual
139
147
-8
128
120
+8
query | query | query | query
84
74
+10
51
61
-10
query | fix | fix | fix
67
62
+5
45
50
-5
fix | fix | fix | query
66
54
+12
32
44
-12
test | test | test | test
52
51
+2
40
42
-2
query | query | fix | fix
51
47
+4
35
39
-4
fix | fix | query | query
49
41
+8
25
33
-8
query | fix | fix | query
36
30
+6
19
25
-6
fix | fix | query | fix
33
25
+8
12
20
-8
fix | query | fix | fix
30
24
+6
13
19
-6
query | test | test | test
22
24
-2
21
19
+2
32
Statistical Natural Language Processing Figure Caption
Figure 1. Box-plot of Command Frequencies for all Participants Figure 2. Bar-chart of Command Category Percentage by Experts and Novices Figure 3. Dendrogram of Command Clusters for Novices Figure 4. Dendrogram of Command Clusters for Experts
33
Statistical Natural Language Processing
Figure 1.
600
500
400
300
200
100
0
-100 N=
73
Command Frequencies
34
Statistical Natural Language Processing Figure 2.
40
Percent of Usage
30
20
10
Proficiency Novice Expert
0 error
fix
help
mode
query
Command Category
save
test
35
Statistical Natural Language Processing
Figure 3.
1. 00 D i s t a 0. 75 n c e B e t 0. 50 w e e n C 0. 25 l u s t e r 0. 00 C e n t r o i d s
F I R S T
L A S T
r e l o a d
s h o w p r o t
s h o w s t a r t
b a n d w i d t h
n o k e e p
c l o c k r a t e
e x i t
c o n f i g t
s h o w i n t
p i n g
s h o w i p r o u t e
s h o w r u n
c o p y r u n
e n a b l e
h e l p
i p h o s t
i p r o u t e
LABEL
n o i p h o s
e i r n r t o r
i p a d d r e s s
n o i p a d d
s h o w i p i n t
n o s h u t d o w n
n o r o u t e r i g r
r o u t e r i g r p 1
n e t w o r k
s w s l l h r h i o o n g o w e i w n i c p d p p r o t o
p a s s w o r d
36
Statistical Natural Language Processing Figure 4.
1. 0 D i s 0. 8 t a n c e 0. 6 B e t 0. 4 w e e n 0. 2 C l u s t 0. 0 e F L r I A RS C S T e T n t r o i d s
b a n d w i d t h
h i o p s h t o n s a t m e
r e l o a d
s h o w s t a r t
l i n e
l o g i n
p a s s w o r d
c l o c k r a t e
d e s c r i p t i o n
n o s h u t d o w n
e i i n n x n p o o i t a i r t d p o d a u r d t e d e r s i s g r p 2 0
n e t w o r k
r o u t e r i g r p 1 0 0
c o n f i g t
e r r o r
p i n g
s h o w i p r o u t e
s h o w i n t
s h o w r u n
s h o w c d p
Figure 4. Dendrogram of Cluster Centroids for Experts LABEL
e n a b l e
h e l p
i wc s s t s s p r o h h e h h r p o o l o u o y wwn wt u r a r e i d t u c o t p o i w e n c u n n e t t s e s l i s
37