under-provisioning based on the tails of power profiles of hosted workloads .... example, a device may have a high peak power consump-. 1 A circuit breaker is ...
Statistical Profiling-based Techniques for Effective Power Provisioning in Data Centers Sriram Govindan1, Jeonghwan Choi1 , Bhuvan Urgaonkar1 , Anand Sivasubramaniam1 2 , Andrea Baldini3 1
Department of Computer Science and Engineering, The Pennsylvania State University. 2 Tata Consultancy Services. 3 Cisco System, Inc.
Abstract: Current capacity planning practices based on heavy over-provisioning of power infrastructure hurt (i) the operational costs of data centers as well as (ii) the computational work they can support. We explore a combination of statistical multiplexing techniques to improve the utilization of the power hierarchy within a data center. At the highest level of the power hierarchy, we employ controlled underprovisioning and over-booking of power needs of hosted workloads. At the lower levels, we introduce the novel notion of soft fuses to flexibly distribute provisioned power among hosted workloads based on their needs. Our techniques are built upon a measurement-driven profiling and prediction framework to characterize key statistical properties of the power needs of hosted workloads and their aggregates. We characterize the gains in terms of the amount of computational work (CPU cycles) per provisioned unit of power – Computation per Provisioned Watt (CPW). Our technique is able to double the CPW offered by a Power Distribution Unit (PDU) running the e-commerce benchmark TPC-W compared to conventional provisioning practices. Over-booking the PDU by 10% based on tails of power profiles yields a further improvement of 20%. Reactive techniques implemented on our Xen VMM-based servers dynamically modulate CPU DVFS states to ensure power draw below the limits imposed by soft fuses. Finally, information captured in our profiles also provide ways of controlling application performance degradation despite overbooking. The 95th percentile of TPC-W session response time only grew from 1.59 sec to 1.78 sec—a degradation of 12%. Categories and Subject Descriptors: C.4 [Performance of Systems]: Measurement techniques; Performance attributes
Permission to make digital or hard copies of all or part of this work for personal or classroom use is granted without fee provided that copies are not made or distributed for profit or commercial advantage and that copies bear this notice and the full citation on the first page. To copy otherwise, to republish, to post on servers or to redistribute to lists, requires prior specific permission and/or a fee. EuroSys’09, April 1–3, 2009, Nuremberg, Germany. c 2009 ACM 978-1-60558-482-9/09/04. . . $5.00 Copyright
General Terms: Experimentation, Measurement, Performance, Reliability Keywords: Data center, Power Provisioning, Power supply hierarchy, Prediction, Profiling
1. Introduction and Motivation To accommodate modern resource-intensive high-performance applications, large-scale academic, research and, industrial data centers have grown at a rapid pace. The fast-growing power consumption of these platforms is a major concern because it is resulting in a correspondingly rapid increase in their operational costs and environmental impact. By 2005, the energy required to power and cool data center equipment accounted for about 1.2% of total U.S. electricity consumption according to a report released by the Lawrence Berkeley National Laboratory. Gartner, the IT research and advisory company, estimates that by 2010, about half of the Forbes Global 2000 companies will spend more on energy than on hardware such as servers [Gartner 2007]. Furthermore, Gartner estimates that the manufacture, use, and disposal of IT equipment, a large share of which results from data centers, accounts for 2% of global CO2 emissions, which is equivalent to that of the aviation industry. While the increase in power consumption per-unit of hardware has also contributed to this growth in energy consumption, the primary reason is the rapid rise in the number of data centers and the growing size of their hardware-base (especially the number of servers). As an example, [NYTimes 2006] in June 2006 reported that Google had approximately 8,000 servers catering to about 70 Million Web pages in 2001, with the number growing to 100,000 by 2003. Their estimate put the total number of Google servers (spread over 25 data centers) to be around 450,000 at the time. As a more general example, a report the by US Environmental Protection Agency (EPA) to the Congress reveals that the number of data center servers in the country increased from 4.9 million in 2000 to 10.5 million in 2006. Correspondingly, it estimated that the electricity use of these servers increased
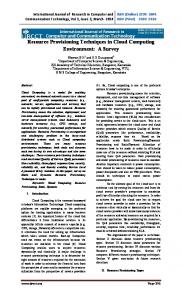
Figure 1: Illustration of the evolution of power capacity and demand in a hypothetical data center. Also shown is the evolution of provisioned capacity based on a prevalent practice such as using the face-plate ratings of devices.
from 11.6 billion kwh/year to 24.5 billion kwh/year during this period [EPA Report 2007]. Figure 1 illustrates the evolution of the power demand and capacity in a hypothetical data center. Provisioned power capacity is the maximum power available to a data center as negotiated with its electricity provider. An upgrade to provisioned power capacity is very expensive—it usually involves complete re-wiring and re-structuring of electrical poles and substations. Decisions related to the provisioning of power infrastructure in a data center must be made not only at installation time but on a recurring basis to cope with upgrades. As shown, there are two “head-rooms” between power demand and provisioned power capacity. The first head-room H1 is between the provisioned power capacity and the estimated peak power consumption of the data center and is intended to ensure that the data center can accommodate foreseeable additions/upgrades to its hardware base. The second head-room H2 , our focus in this research, results due to current capacity planning techniques that significantly over-estimate the power needs of the data center. This over-estimation results due to these techniques’ reliance on faceplate ratings of devices that are conservative, worst-case estimates of the maximum conceivable power consumption of devices. As an example, faceplate ratings for servers are typically specified assuming that the maximum number of memory units and peripherals would be connected and the most power-hungry workloads would be executed. A number of recent studies on power usage in data centers provide evidence of such over-provisioning at multiple levels of the power hierarchy, ranging from the power supplies within servers [Lefurgy 2007], Power Distribution Units (PDUs) supplying power to servers, storage equipment, etc., to even higher-level Uninterrupted Power Supply (UPS) units [Fan 2007]. Researchers at Google estimated the head-room H2 to be 40% for their data centers [Fan 2007].
Over-provisioning of Power is Unprofitable. Over provisioning reduces the amount of work that could be extracted from the provisioned power for a data center. This work refers to any activity consuming power in a data center including CPU, storage, and network bandwidth. Such provisioning of power hurts both the setup-time and recurring costs of data centers. In the case of entities maintaining a single data center, it implies premature investment into expensive, higher capacity sub-stations and power supplies. Additionally, for larger enterprises relying on multiple data centers, it leads to the deployment of more data centers than needed. This increases the recurring investments the data center owner incurs by requiring a larger team of administrators to maintain, upgrade, and repair these data centers that often reside at disparate geographic locations. While provisioning closer to demand holds the promise of cutting both installation/upgrade as well as recurring costs, it does so at the risk of severe economic penalties and/or increased episodes of degraded performance/availability. Cost penalty can occur from violating contractual agreements on power/energy consumption with the data center facility company. Degradation to performance/availability can occur due to one or more of the following: • A subset of the hardware may simply not get powered up due to insufficient power supply (as happened with an ill-provisioned $2.3 Million Dell cluster at the University at Buffalo, where two-thirds of machines could not be powered on till a $20,000 electrical system upgrade was undertaken [Clark 2005b]). • One or more fuses may give way during an episode of surge in power drawn, disrupting the operation of applications hosted on associated servers. • The thermal system, faced with constrained power supply, may trigger shut/slow down of some devices. Any improvements in power provisioning must carefully trade-off the resulting cost savings against such performance degradation. Additionally, to realize such improvements, a data center must employ mechanisms that prevent (make statistically negligible) episodes of events described above. In this paper, we introduce and evaluate power provisioning techniques that reduce over-provisioning while keeping the risk of significant economic penalties resulting from reduced performance below acceptable levels. It is our contention that understanding the power usage behavior of hosted applications can allow a data center to make more informed provisioning decisions compared to existing techniques which are mostly ignorant of the applications’ power characteristics. Our technique combines several complementary approaches to make informed power provisioning decisions. Rather than using overly pessimistic, generic faceplate estimates or power usage, we employ experimentallyderived models of power usage behavior of specific applications running on specific hardware configurations. We claim the following research contributions:
Research Contributions. • Workload-aware statistical multiplexing of power needs. We develop provisioning techniques that exploit knowledge of the power usage patterns of hosted applications (called power profiles). We exploit a number of statistical properties of power usage that our profiles reveal to propose improved provisioning techniques: (a) controlled under-provisioning based on the tails of power profiles of hosted workloads exploits rarely occurring peak power needs. (b) identification of statistical multiplexing effects (not all peaks happen at the same time) among workloads consolidated within a data center is used to carefully overbook overall data center power capacity. Furthermore, evidence of self-similarity in the power usage of an important class of workloads suggests that these under-provisioning related gains are likely to result not just for PDUs that servers are connected to, but even at higher levels of aggregation. Finally, we introduce the novel notion of soft fuses to allow flexible distribution of overall incoming power capacity down the power hierarchy than is allowed by the conventional static fuses. • Agile protective systems mechanisms. To enable safe and performance-friendly operation despite the above techniques for aggressive provisioning, we develop agile systems mechanisms to enforce given soft fuses by dynamically throttling CPU DVFS states on our servers. Our profiling and prediction techniques enable a systematic trade-off between the cost savings offered by our provisioning technique and the accompanying performance degradation. • Evaluation on a simplistic prototype data center. We define a new metric to capture the provisioning efficiency of data centers, Computation per Provisioned Watt (CPW) which denotes the amount of work (specifically CPU cycles) that could be extracted from a provisioned power capacity. We implement our techniques in a simplistic prototype data center with a state-of-the-art PDU supplying power to multiple servers, each running the Xen VMM. Using a variety of well-regarded benchmarks representative of data center applications, we conduct a detailed empirical evaluation to demonstrate the feasibility and utility of our provisioning approach. As a representative result of our evaluation, by accurately identifying the worst-case power needs of hosted workloads, our technique is able to double the CPW offered by a PDU running the e-commerce benchmark TPC-W compared to conventional provisioning practices. Furthermore, overbooking the PDU by 10% based on tails of power profiles yielded an additional improvement of 20%. Despite aggressive provisioning, for the experiment above, the 95th percentile response time of TPC-W grew from 1.59 sec to 1.78 sec, a degradation of only 12%. Road-map. The rest of this paper is structured as follows. We provide background on the power hierarchy within data
centers in Section 2. We conduct an empirical study of power consumption in consolidated settings in Section 3. Based on lessons learnt from this study, we develop techniques for improved provisioning of power infrastructure and introduce the notion of soft fuses in Section 4 and address associated reliability, performance and feasibility concerns in Section 5. We present our prototype implementation in Section 6 and conduct an experimental evaluation of our techniques in Section 7. We discuss related work in Section 8. Finally, we conclude in Section 9.
2. Power Provisioning Overview In this section, we provide necessary background on the power supply infrastructure in current data centers and introduce the notion of sustained power budgets to capture the limits of fuses/circuit-breakers within the various power supply elements of a data center. Power Supply Hierarchy. In a typical data center, a primary switch board distributes power among several Uninterrupted Power Supply Sub-stations (UPS; 1,000 KW) that, in turn, supply power to collections of Power Distribution Units (PDU; 200 KW.) A PDU is associated with a collection of server racks (up to 50.) Each rack has several chassis that host the individual servers. Power supply could be either at the server-level (as in rack-mounted systems) or at the chassis-level (as in blade servers.) Within all these components, fuses/circuit-breakers1 are used to protect equipment from surges in the current drawn. We view this collection of power supply infrastructure as forming a power supply hierarchy within the data center. While the provisioning technique we develop applies to a general power hierarchy, our implementation and evaluation is restricted to a two-level hierarchy where a PDU is directly connected to a set of servers. Power Budgets. Each fuse or circuit-breaker has a timecurrent characteristic curve: a point (s, l) on this curve specifies the maximum power draw s that the fuse can safely sustain over l contiguous time units. For simplicity, we use a single such point (S, L) as the sustained power budget for the corresponding level in the hierarchy. Sustained power budgets are defined over fairly small time periods—of the order of a few seconds or even milliseconds. A violation of this sustained power budget would mean a draw of S Watts or more was sustained over a contiguous period of L time units. While sustained power is closely related to the notion of peak power that is frequently used in literature [Felter 2005, Ranganathan 2006], the difference must be clearly understood. Peak power, as is typically defined, does not include the time-scale over which this power usage sustains and therefore does not capture the limits posed by fuses. For example, a device may have a high peak power consump1 A circuit breaker is similar to a fuse in its function except that it could be reused after an episode of excessive current draw. We will simply use the term fuse for both henceforth.
3.1 Profiling Infrastructure Our approach for characterizing the power and resource usage of an application employs a profiling technique which involves running the application on an isolated server 2 . The application is then subjected to a realistic workload.
0.03
0.025
0.025
0.02
0.02 Probability
0.03
0.015
0.015
0.01
0.01
0.005
0.005
0
160
180
200 220 Power (W)
240
0
260
0.03
0.025
0.025
0.02
0.02
0.015
0.01
0.005
0.005
160
180
200 220 Power (W)
240
260
(c) Bzip2 (SPECcpu suite)
180
200 220 Power (W)
240
260
0.015
0.01
0
160
(b) Streaming, 100 clients
(a) TPC-W, 60 sessions 0.03
Probability
In this section, we characterize the resource usage and power consumption of individual applications. We then briefly present our prediction techniques that use this characterization to estimate the sustained power consumption of applications consolidated under different levels of the power hierarchy. Taken together, these measurement and prediction techniques set the background for improvements in provisioning the power infrastructure that we explore in the following sections.
Probability
3. Power Profiling and Prediction for Aggregates
Probability
tion and still operate safely if this peak does not sustain long enough to exercise the limits associated with the corresponding fuse.
0
160
180
200 220 Power (W)
240
260
(d) Mcf (SPECcpu suite)
Dell PowerEdge SC1450 (450W - Face-plate Power) [Dell SC1425 2005] Processors (2) Intel(R) Xeon 64bit 3.4 GHz (2MB L2 Cache) Main Memory 2GB Hard Disk (2) WD Caviar 40GB 7200rpm (7W Active power) Network Interface Dual embedded Intel Gigabit2 NICs
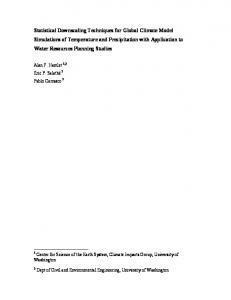
Figure 2: Power distributions (collected at 2ms granularity) of TPC-W(60), Streaming(100), Bzip2, and Mcf compared (Idle power of our server is 155W).
Table 1: Specifications of the server used for profiling.
saturating, in that they are ready to use the CPU at all times. The remaining applications (non-CPU-saturating) alternate between using the CPU and being blocked (e.g., on I/O, synchronization activities, etc.) and their CPU utilization depends on the workload they are offered. We profile these non-CPU-saturating applications at different workload intensities. TPC-W is profiled with the number of simultaneous Web sessions varying from 10 to 100, in increments of 10. For experiments involving TPC-W, we represent the workload intensity as TPC-W(x) where x is the number of simultaneous Web sessions. For experiments involving the Streaming Media Server, 3Mbps is used as the streaming rate; SM(x) represents a workload of x clients. Finally, the workload intensity for SPECjbb2005 can be controlled using a tunable parameter dictating the number of “warehouses” it stores. We use a value of 6 for this parameter and keep its workload intensity as 100% throughout this paper.
Our testbed consists of several Dell PowerEdge servers (details in Table 1.) We run the Xen VMM [Barham 2003] on our servers with each application encapsulated within a Xen domain. We connect a Signametrics SM2040 multimeter (1µA accuracy) in series with the power supply of our servers. This multi-meter is capable of recording power consumption as frequently as once every millisecond. Unless otherwise specified, throughout this section, we use 2 msec as our measurement granularity. We find it useful to convert the resulting time-series of (instantaneous) power consumption samples into a probability density function (PDF) that we call the application’s power profile. 3.2 Profiling Applications: Key Experimental Results In this section, we profile a diverse set of applications (refer Table 2) to illustrate the process of deriving an application’s power consumption behavior. These experiments provide key insights into the extent of variability in the power consumption of these applications. We classify these applications based on their CPU usage. Applications in the SPEC CPU2000 suite are CPU-
TPC-W [Smith 2005] Streaming Media SPECjbb [SPECJBB 2005] SPECcpu [SPECCPU 2000]
Applications 3-tiered NYU implementation of the TPC-W Transactional Web-based E-commerce benchmark Home-grown UDP streaming server, Streams MPEG-1 to specified no. of clients & data rate SPEC’s 3-tiered client-server benchmark Emulates server-side Java applications SPEC CPU2000 suite (Art, Bzip2, Mcf, Mesa)
2 In
practice, a distributed application with multiple components may require multiple servers to meet its resource needs. We only consider applications whose resource needs can be met by a single server. Our technique extends to applications requiring multiple servers by simply running the application on the appropriate number of servers and conducting measurements on each of them.
Table 2: Salient properties of our applications. TPC-W, Streaming Media Server, and Specjbb2005 are non-CPU-saturating, whereas applications in the SPEC CPU2000 suite are CPU-saturating.
Application TPC-W(60) Streaming(100) Bzip2
100th 260.4 242.4 252.6
Power usage percentile (W) 99th 95th 90th 236.4 233.2 229.2 227.4 214.8 208.2 242.4 237.2 235.1
Avg. 185.5 184.1 224.9
Table 3: Salient aspects of the power profiles of TPC-W, Streaming, and Bzip2 sampled at 2 msec granularity.
Dealing with Varying Power Usage. Implicit in the collection of power profiles described above is an assumption of stationarity of power/resource usage behavior. Executions of realistic applications are likely to exhibit “phases” across which their power and resource usage behavior change significantly. An example of this is the change in resource needs (and hence power consumption) of a Web server whose workload exhibits the well-known “time-of-day” variation [Hellerstein 2000]. Similarly, many scientific applications alternate between doing significant amounts of I/O (when reading in parameters from files or dumping results to them) and computation. Clearly, the utility of our power profiles depends on effectively determining such phases. Power and resource profiles could then be derived separately for every such phase. Enhancing our techniques to deal with these issues is part of our future work. In this paper, we limit ourselves to a single profile per-application, except in Section 7.5, where we explore a simple technique to detect a significant change in a power profile. Temporal Variations in Power Usage. We find that all our applications exhibit temporal variations in their power usage to different degrees. Power profiles for non-CPU-saturating application (Figures 2 - TPC-W(60) and SM(100) ) are found to exhibit higher variance than CPU-saturating application (Figures 2 - Bzip2 and Mcf from SPECcpu2000 suite.) Specifically the variance of the TPC-W and Streaming profiles were 92 and 84 W 2 compared with only 47 and 59 W 2 for Bzip2 and Mcf, respectively. The CPU usage of a non-CPU-saturating application exhibits an ON-OFF behavior, corresponding to the application being in running and blocked states, respectively. When such an application blocks, its power consumption corresponds to the server’s idle power. This ON-OFF CPU usage contributes to the higher variance in its power consumption. Intuitively, we expect that on being consolidated under common power elements, applications with higher variance in their power usage are likely to yield larger reductions (over worst-case provisioning) in required power capacity via statistical multiplexing. The exact extent of these savings would depend on the particular set of applications. Tails of Power Profiles. The nature of the tail of a resource requirement distribution crucially affects savings that underprovisioning (that is, provisioning less than what the worstcase needs) can yield. In Table 3, we present the 99th , 95th , and 90th percentiles of the power profiles of TPC-W(60),
Streaming(100), and Bzip2 along with their peak and average values. We make two useful observations. First, for all the applications, the worst-case power needs (in the range 240-260 W) are significantly less than the power supply provisioned within our server (450 W, recall Table 1.) Second, the 99th and 95th percentile needs are lower than the worst case by up to 10%, while the 90th percentile is lower by up to 15%. Together these results suggest that controlled under-provisioning based on power profile tails can potentially bring about capacity and cost savings. Self-similarity in Power Usage. A final statistical feature worth investigating in our profiles is the presence (and extent) of self-similarity [Park 2000]. Due to the hierarchical nature of the power infrastructure (recall Section 2), the presence of self-similarity has interesting implications on capacity provisioning at higher layers of aggregation (PDU, UPS, etc.) Specifically, applications with (i) long tails in their power profiles and (ii) high self-similarity in their power time series, are likely to retain these characteristics (i.e., long tails/burstiness) even at higher levels of aggregation. The well-known Hurst parameter (H) is one way to quantify the self-similarity exhibited by a process. It lies in [0.5, 1.0] with higher values representing larger degrees of self-similarity. We calculate the Hurst parameter for the power-time series of our applications. We find the Hurst parameter to be 0.86, 0.76, and 0.52 for TPC-W(60), Bzip2 and Streaming(100), respectively. In case of TPC-W(60), it has a long tail (refer Table 3) and a high Hurst parameter, therefore we expect the aggregate power series of multiple TPC-W(60) server instances to also exhibit burstiness. Streaming Server, that exhibits a low Hurst parameter along with high burstiness, presents a contrasting case: we expect power elements consolidating copies of this application to experience power usage patterns with low burstiness. We validate these intuitions in Section 3.3 where we study power usage of such aggregates. 3.3 Prediction Techniques for Aggregates Power percentile 80 90 99 100
Measured Sustained power (W) 1143 1171 1236 1269
Predicted sustained power (W) 1181 1201 1250 1300
Error (%) 3.2 2.4 1.1 2.4
Table 4: Efficacy of our sustained power prediction on a PDU consolidating 7 Servers each running TPC-W(60). We compare the tail of the measured power with our predicted power.
Crucial to provisioning levels in the hierarchy higher than the server (PDU, UPS, etc.) are ways to combine the power profiles of applications running on the servers beneath this level to predict their aggregate power usage. While predicting the average and even the peak of such an aggregate is fairly straightforward, doing the same for sustained power (recall the definition in Section 2) is non-trivial.
4.1 Under-provisioning Based on Power Profile Tails
1 0.99
CDF
0.95
0.9 Prediction 0.85
0.8 1100
Measured
1150
1200 Power(Watt)
1250
1300
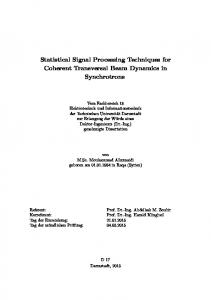
Figure 3: Comparison of measured and predicted sustained power consumption (L=5 sec) of a PDU connected to 7 Servers (each running TPC-W(60).)
We employ our recent research [Choi 2008], which combines power and resource usage profiles of individual applications and predicts the behavior of sustained power consumed at various levels (server, PDU, and higher) when these are consolidated. Our prediction technique follows a two-step process. First, we develop techniques to predict the sustained power consumption of a server consolidating n applications. This involves estimating all possible ways the n applications interleave on the CPU and then computing the sustained power consumption of the server for each of these interleavings. Second, using the resulting distribution of predicted sustained power consumption of individual servers, we predict an upper-bound on the sustained power consumption of a PDU supplying power to m servers. A representative result is presented in Figure 3 and Table 4. As shown, for a PDU connected to 7 servers, each hosting TPC-W(60), our technique predicts within reasonable error margins (1-5%). As suggested in Section 3.2, we observe that the sustained power consumption of this collection of servers, each running an instance of the relatively bursty TPC-W(60) application, also exhibits a longer tail (e.g., compare the 100th and 90th percentiles reported in Table 4) than the aggregates of the less self-similar Streaming Server (numbers not shown here).
4. Improved Provisioning of Power In this section, we propose techniques that utilize the profiling and prediction framework described in Section 3 to increase the utilization of the data center power capacity by connecting more servers than allowed by conventional provisioning practices. For ease of exposition, let us assume that all sustained power budgets in the following discussion are defined over a unit time period - the second element of the sustained power budget pair will therefore be omitted. It is easy to generalize this discussion to budgets defined over arbitrary time periods. Let us denote by B the sustained power budget associated with a power supply element E. Let n elements drawing power from E be denoted e1 , . . . , en , and their sustained power profiles be denoted u1 , . . . , un . 3 3 This
notation is general enough to capture provisioning at any level. For example, if E denotes a server (with its power supply being provisioned),
Recent research suggests that provisioning based on the face-plate ratings of servers severely under-utilizes the power infrastructure [Lefurgy 2007, Fan 2007]. We use our prediction technique to estimate the peak power needs of the applications consolidated in a data center and provision appropriately. Let upi denote the pth percentile of the ith application’s power profile ui . Then provisioning based on peak needs (100th percentile) for a data center (B denotes the sustained power budget at the highest level of a data center) consolidating n applications is given by, n X
u100 ≤ B. i
(1)
i=1
Our observations in Section 3.2 suggest that a data center can even go a step further—given the extent of burstiness present in the power usage of many commonly hosted applications, we can realize further improvements by provisioning less conservatively than for the peak. Under-provisioning the capacity of element E implies ensuring the following condition: n X i ≤ B; ∀i : pi > 0. (2) u100−p i i=1
where pi represents the degree of under-provisioning at the level ei . The gain in the utilization of provisioned power offered by the provisioning as represented by Eq. (2) over peak-based provisioning (as in Eq.( 1)) is the difference between the applications’ collective (i) peak power P needs and (ii) power needs based on under-provisioning, ni=1 (u100 − i 100−pi ). Clearly, applications with more bursty power proui files would yield higher gains. It is worth mentioning here that current servers [IBM Energy Manager 2007, HP Power Manager 2008] are shipped with in-built mechanism to enforce a specified power budget at very fine time scale. Our predicted peak power consumption of the application (2) can be used to set the power budget for these servers. 4.2 Over-booking Based on Statistical Multiplexing If the applications consolidated in a data center exhibit power usage patterns that complement each other temporally, then statistical multiplexing gains become worth exploiting. In simple terms, provisioning for the tail of aggregates can be more gainful than provisioning for the sum of individual tails (as was done in the under-provisioning technique above.) Adding to the terminology introduced above, the symbol U for the sustained power profile of the highestlevel power supply of the data center, we can enhance our provisioning technique as follows: U 100−P ≤ B · (1 + δ);
P, δ ≥ 0.
(3)
the elements ei are applications consolidated on it. The specific level for which we evaluate our techniques considers a PDU as the element E supplying power to servers denoted by ei .
Figure 4: Illustration of our provisioning techniques based on statistical multiplexing and soft fuses as applied to a hypothetical data center power hierarchy.
where P denotes the degree of under-provisioning and δ denotes the degree of over-booking both at the highest level of a data center. Rather than under-provisioning each element ei independently as in (2), this technique does so for the aggregated needs of all these elements (at the data center level). For simplicity, in this paper, we ignore the parameter δ (δ=0) and discuss over-booking of power only in terms of P . A key point to note here is that under-provisioning and statistical multiplexing are not mutually exclusive but complementary—the aggregation U representing multiplexing of underlying power usages is being under-provisioned. The degree of under-provisioning P and the degree of overbooking δ should be chosen based on the following considerations. First, it should be possible to distribute them into individual degrees of under-provisioning (pi for element ei ) that provide desirable trade-offs between cost savings and performance. Second, (as mentioned in the last technique) mechanisms should be present at (and below) the level of elements ei in the hierarchy to enforce the power limits corresponding to these degrees of under-provisioning. We will address these issues in Section 5. 4.3 Provisioning within the Data Center: Soft Fuses Techniques based on under-provisioning and over-booking described in Sections 4.1 and 4.2 are intended to increase the utilization of the provisioned power capacity (at the highest level) of a data center. A typical data center has multiple levels in its power hierarchy and recent research [Fan 2007] suggests that the head-room between the provisioned power capacity and power demand at each level increases as we move up the power hierarchy. This is because the unused (fragmented) capacities at the lower levels add up as we move higher in the hierarchy. We introduce the notion of soft fuses to reduce this head-room at each level of a data center power hierarchy. Soft fuses are similar to traditional static fuses for they represent a limit on the power consumption at that level. But unlike static fuses, soft fuses can be changed dynamically. This allows more flexibility in
distributing power and also reduces/eliminates the unused fragmented capacity at the lower levels as demonstrated in Section 7.4. A soft fuse is represented as a sustained power tuple (X Watts, Y Seconds) which has to be (lexicographically) less than or equal to the sustained power budget of that level in the hierarchy (Soft fuse ≤ Sustained power budget). Soft fuses are set for each of the power supply elements at the lower levels ensuring that their sum at that level does not violate the soft fuse of their higher-level (parent) power supply. Note that soft fuses themselves could be under-provisioned or over-booked similar to techniques described in Sections 4.1 and 4.2. Figure 4 summarizes all of these techniques for a hypothetical data center power hierarchy.
5. Reliability, Performance, and Feasibility Concerns We consider, in turn, concerns of reliability, performance, and feasibility that must be addressed to gainfully utilize the provisioning techniques developed so far. 5.1 Enforcement of Soft Fuses Our techniques result in (or increase) the likelihood of episodes where the power needs at one or more levels within the hierarchy exceed its capacity. Unless remedial actions are taken during such an occurrence, extremely undesirable outcomes (e.g., a subset of the hardware becoming unavailable) could result. Realizing any meaningful usage/cost gains for the power infrastructure may require setting the provisioning parameters (e.g., p and δ introduced in the previous section) high enough to make the likelihood of budget violations non-negligible. Furthermore, hard-to-predict workload changes (such as an overload experienced by an e-commerce site [Iyer 2000]) may also render budget violations more likely than predicted using application profiles. These concerns necessitate mechanisms within a data center that can completely avert such episodes. We employ reactive techniques based on power thresholds that utilize dynamic transitions to lower power states (CPU DVFS states) to avert soft fuse (power budget) violations. Conceptually, when the power threshold for an element in the hierarchy is exceeded, the data center triggers throttling of the appropriate subset of its hardware. A power threshold for an element with a soft fuse (s, l) is a 2-tuple (spt , lpt ) ≤ (s, l) and has the following operational meaning: Upon observing a sustained power draw at a rate of spt units or more for contiguous lpt time units, an element should initiate the throttling of the devices under it in the hierarchy. The choice of a power threshold has the following implications. Lower values of lst could render the throttling excessively aggressive and increase the number of invocations of throttling. Higher values could induce violations of soft fuses at higher levels in the power hierarchy. Both scenarios could result in unnecessary performance degrada-
tion via throttling. Additionally, higher values of lst could also result in the data center equipment operating in unsafe regimes. We can borrow from the findings of existing research, particularly [Zeng 2002], on this front. In our implementation and evaluation, we use a simple, statically-chosen power threshold (see Sections 6 and 7.2.) 5.2 Performance Concerns It is easy to see that our aggressive provisioning techniques will result in higher overall system capacity (since the PDU is now connected to more servers.) However, aggressive provisioning also increases the chances of degraded application performance due to the accompanying increase in violation of power thresholds. In Section 7.1, we capture the above trade-off using the CPW metric and in Section 7.3, we use our profiling techniques to estimate the performance degradation for different degrees of over-booking. 5.3 Arguments for Feasibility of Our Technique Power Profiling. Application profiling is performed in many state-of-the-art systems with the help of Workload Sizing/Estimator tools [IBM Workload Estimator 2009] that determine the resources required for meeting desired performance guarantees. In addition to collecting these resource usage statistics, our approach requires collecting information about power usage associated with different application load levels. In contemporary data center environments, such online power measurement capability is readily available within servers (e.g., IBM [IBM Energy Manager 2007] and HP [HP Power Manager 2008]) and PDUs [Raritan Inc. 2008] that are equipped with high-resolution power meters with simple interfaces for extracting run-time power measurement. Furthermore, SPEC’s power benchmark suite, SPECPOWER [SPEC POWER 2008] provides standard interface for collection power data in conjunction with traditionally collected performance data. Limitations of Our Current Prototype. In addition to the simplistic nature of our data center—a small set of servers, a two-level power hierarchy, lack of other components commonly resident in data centers (particularly storage arrays), etc.—a key limitation in our prototype (to be described in Section 6) arises due to our access to a PDU [Raritan Inc. 2008] that can only conduct power measurements once every second. As a result, whereas the profiles described thus far were obtained in an offline manner using a high-fidelity multi-meter (that could conduct such measurements at the msec granularity), the profiles we obtain in our evaluation are based on sampling power once every second. This potentially limits the extent of variation we observe in power usage in our evaluation compared to the profiles presented earlier, implying that the multiplexing gains we observe could be further improved if we were able to sample power faster. Power measurement can be done at finer time scales (msecs [Lefurgy 2007]) in current servers and we would
like to enhance our prototype to use such servers to evaluate further improvements in provisioning. Safety. Fortunately, current servers [IBM Energy Manager 2007, HP Power Manager 2008] have in-built mechanisms that can limit power consumption at very fine timescales. Also, intelligent PDUs like ours [Raritan Inc. 2008] have the capability to send alert messages to servers upon violating a specified PDU-level power budgets within a few hundreds of milliseconds. These device capabilities suggest the feasibility of designing a data center that employs our reactive technique to operate safely.
6. Implementation Considerations Infrastructure. Our experimental testbed consists of a 20A PDU from Raritan Inc. [Raritan Inc. 2008] supplying power to 10 Dell PowerEdge SC1450 processors whose key features are shown in Table 1. For our experiments, we vary the number of servers connected to the PDU. The PDU provides a software interface to read the power consumption of each server connected to it as well as the power consumption of the entire PDU. The granularity of the power measurement is one second and the accuracy is 0.1A. Note that the measurement capability offered by the PDU is of a lower fidelity than the multimeter used in Section 3 (every msec with accuracy within 1µA.) We repeat the profiling experiments described in Section 3 using the PDU and report important power consumption characteristics in Table 5. Each server hosting an application runs the Xen VMM 3.1.0 with each application encapsulated within a separate domain. While our techniques apply to scenarios where multiple applications are consolidated on a single server, we restrict ourselves to hosting one application per server. To enable live migration [Clark 2005a] of these VMs across servers, we place all the VM disk images in a NFS partition that is exported to all the servers connected to the PDU. Our servers have a rich set of power states including 4 DVFS and 8 Clock Modulation states (see Table 1.) We write custom drivers for changing the power state of our servers. We use the IA32 PERF CTL and IA32 CLOCK MODULATION MSR registers to change the DVFS and clock modulation states, respectively. Since the vanilla Xen VMM traps and nullifies all writes to MSR registers (wrmsr operations), we modify it to enable writes to these registers. Threshold-based Budget Enforcement. The time constant for the power threshold (lst ) at any level within the hierarchy has to be at least as large as the granularity at which measurements can be done. Due to the limitations posed by the measurement frequency of the PDU used available to us, in our prototype, we can (in theory) enforce soft fuses only as frequently as once every second. However, it takes an additional 100-300 msecs for our PDU to convey DVFS throttling messages to the servers connected to it and for them to move to these states. Therefore, we choose a conservative value of 3 seconds for the parameter lst . In our experiments,
Application TPC-W(60) TPC-W(20) Streaming(100) Specjbb2005
Power usage percentile (W) 100th 90th Avg. 209 199 164.3 183 152 150 183 159 152.1 219 219 217.0
Table 5: Salient aspects of the power profiles of TPC-W, Streaming Server, and Specjbb2005 collected by running these applications on servers connected to our PDU. Power is sampled at 1 second granularity.
we choose the time constant element of the PDU’s sustained power budget to be L = 5 seconds. Our choice is based on the time-current curves of commercial [Circuit Breakers 2009] medium-delay circuit breakers. For these circuitbreakers, an over-current of 1.5I (I being the rated current for the breaker) would approximately be sustained between 5 to 10 seconds before tripping the circuit. Long-delay circuit breakers have time-constants ranging in several tens of seconds for the same amount of over-current and therefore could be used at higher levels of a data center power hierarchy. We briefly discuss the implementation of our technique based on a power threshold (spt , lpt ) for enforcing a soft fuse (s, l). We dedicate a server to initiate reactive throttling and call it the threshold-based enforcer. Once every second, the enforcer monitors the power consumption of the PDU and inspects all the power samples collected during the last lpt time units. If all these values exceed spt , it sends throttling commands to all the servers connected to the PDU using RPCs that specify their new power states. In Section 7, we will discuss how the threshold-based enforcer selects appropriate throttling states for the servers.
7. Experimental Evaluation 7.1 Improvements in Computation per Provisioned Power Unit We compare provisioning techniques commonly used in data centers with the techniques developed in Section 4. For all our experiments we assume the sustained power budget for the PDU to be (1200W, 5 sec). We choose (1200W, 3 sec) as its power threshold. In general, to express the efficacy of a provisioning technique, one would like to define a metric that could capture application-specific performance that a given power capacity could provide. Given our focus on servers, we use the following simpler and restricted metric called Computation per Provisioned Watt: CPW = (No. servers connected * Average clock frequency) / Provisioned power capacity. P Average clock frequency = i (Fi · fi ). where Fi is the frequency (CPU power state) of the server and fi is the percentage of time the server operates at Fi Hz.
Technique UP(0) UP(10) SP(0) SP(10)
Servers running instances of TPC-W(60) No. Servers CPW Improvement 5 66% 6 71.76% 6 100% 7 119.6%
Table 6: The number of servers (each running an instance of TPCW(60)) connected to a 1200W PDU by different provisioning techniques. CPW percentage improvements reported are over VP. Technique UP(0) UP(10) SP(0) SP(20)
No. servers hosting each type of app. 2 x TPC-W, 2 x SPECjbb 2 x TPC-W, 2 x SPECjbb, 2 x SM 2 x TPC-W + 2 x SPECjbb, 2 x SM 2 x TPC-W, 2 x SPECjbb, 3 x SM
CPW Improvement 33% 71.76% 100% 105.8%
Table 7: The number of servers connected to a 1200W PDU by different provisioning techniques. CPW percentage improvements are reported over VP. Each server runs an instance of one of the following: TPC-W(60), SPECjbb2005, and Streaming(100), shortened to TPC-W, SPECjbb, and SM, respectively.
Face-plate Provisioning (FP). Face-plate value is the capacity rating of a server specified for its power supply. For our servers the face-plate value is 450W. Using FP, we can connect 2 servers to our PDU. Vendor Calculator-based Provisioning (VP). In an attempt to help data center administrators, IBM, HP, Dell, and other server vendors provide calculators for estimating the peak power needs of their servers. Such a calculator takes as input the configuration of a server (number and type of processors, memory cards, etc.) and expected workload intensity (rough descriptions of CPU, I/O intensity, etc.) and outputs its power needs. The calculator provided by the vendor of our server [Dell Power Calculator 2008] (for average load specification) estimates its power need to be 385W. Therefore using this provisioning technique, we would connect 3 servers to our PDU. Profiling-guided Provisioning (UP and SP). The previous two prevalent provisioning techniques are based solely on worst-case estimates of server power needs. In contrast, the techniques developed in Section 4 incorporate applicationspecific power needs. Let us denote by UP(p) and SP(p) our under-provisioning and overbooking-based techniques (recall Equations 2 and 3), respectively. In theory, UP(0) and SP(0) should coincide. However, due to extremely small probabilities (smaller than 0.1µA) being rounded off to 0 (floating-point roundoff after the 6th decimal point) in our implementation of sustained power prediction, we observe a difference between these quantities. In fact, the difference adds up to slightly more than 150W for a PDU connected to 7 servers, each running an instance of TPC-W(60). Tables 6 and 7 present improvements in CPW yielded by UP and SP for our PDU hosting a diverse mix of applica-
7.2 Sustained Budget Enforcement Power state (DVFS, Clk. Mod.) (3.2Ghz, 100%) (2.8Ghz, 100%) (2.8Ghz, 50%)
th
Predicted Peak (100 percentile) of Sustained Power 6 servers 7 servers 8 servers 9 servers 1191.0 W 1300.0 W 1481.0 W 1672.0 W 967.6 W 1138.6 W 1308.2 W 1478.2 W 861.7 W 1011.7 W 1162.7 W 1313.6 W
Table 8: Predicted power consumption of a PDU (L = 5sec) connected to servers each running TPC-W(60) when operating at three different power states. Bold power values indicate that the corresponding power state is chosen for throttling by the threshold-based enforcer. Legend: Clk. Mod.= Clock Modulation state.
We evaluate the efficacy of budget enforcement for an increasing number of servers—starting at 6 and going up to 9—connected to a PDU. Each server runs an instance of TPC-W(60). The threshold-based enforcer described in Section 6 sends throttling commands to the servers upon observing three consecutive power readings above 1200W at the PDU (recall that the sampling interval is 1 sec.) Upon observing such an episode, the enforcer must choose suitable power states for throttling the servers so that the sustained budget remains un-violated. This is achieved using a combination of our sustained power prediction technique and information gathered during profiling. In Table 8, we record the predicted peak sustained power consumption at the PDU for varying number of servers connected to it operating at different power states. For each of these server aggregates, we choose the highest power state for which the peak of sustained power consumption is less than the PDU’s budget. This chosen power state (highlighted in Table 8 for server aggregates of different sizes) is therefore guaranteed to bring the system within the capacity limits. As we can see from the table, there is no such power state if 9 servers, each running TPC-W(60), were connected to our PDU. That is, even if we operate at the lowest possible power state 4 , our technique can not prevent violations of the PDU budget. 4 (2.8GHz,
50% Clk.) is not the lowest power state in our server. There are 3 more lower power states, but a server hosting the TPC-W workload crashes
1 Prediction 0.8
Measured (No throttling) Measured (With throttling)
0.6 CDF
tions. For computing CPW, we assume 3.4Ghz for normal operation ((100-fi)% of the time) and 1.4 Ghz (2.8Ghz, 50% Clk) for durations over which the server is throttled (fi % of the time). Whereas the worst-case sustained power consumption of SPECjbb2005 and TPC-W are close to each other (220W and 210W respectively as shown in Table 5), due to the longer tail in its profile, higher gains result in an environment with servers hosting TPC-W like workloads. In fact, for a PDU connected to servers running SPECjbb2005, while provisioning based on UP(0) (i.e., peak needs) provides 66% improvement over VP and 150% improvement over FP, no further improvements result from over-booking (numbers not provided in the table). Gains offered by our over-booking techniques are thus closely dependent on the power usage characteristics of the hosted workloads.
0.4 Power budget 0.2
0 950
1000
1050
1100 1150 Power(Watt)
1200
1250
1300
Figure 5: Sustained power profile (L=5 sec) for a 1200W PDU connected to 7 servers (using SP(10)), each running TPC-W(60), with and without our threshold-based enforcement.
Throttling is done for a period of 2 seconds (which is the difference between the time constants of the power threshold and the sustained power budget), after which the servers revert back to their original power states. Figure 5 compares the sustained power profile of a 1200W PDU consolidating 7 servers (using SP(10)) each running TPC-W(60), with and without threshold-based budget enforcement. Also shown is the predicted sustained power profile for this PDU. As shown, our threshold-based enforcer is successfully able to enforce the PDU’s sustained power budget. 7.3 Performance Degradation Using our prediction algorithm, we estimate the probability of the aggregate power consumption at the PDU exceeding its power threshold. This probability, reported in Table 10, provides an estimate of the amount of time an application would find its server running at a throttled power state. We use our profiling technique (see Table 9) to estimate the performance degradation caused by different power states 5 . We compare the predicted performance degradation with the measured values in Table 10. Since our threshold is (1200W, 3 sec), even if the application needs to consume 1200W or more all the time, it will be throttled only 40% of the time (3 seconds at the highest power state, 2 seconds at a throttled state). Therefore, the predicted threshold violation in Table 10 is computed by using the probability of violating the threshold and then multiplying that probability by 0.4. In Table 10, our technique indicates that 7 is the maximum number of servers that could be safely connected to our PDU and still be operated while only causing a small degradation in the performance of the TPC-W applications they host. The predicted degradation was 1.08 while the if transitioned to any of these lower power states. These states are, therefore, considered infeasible for the TPC-W workload. 5 The higher performance degradation for TPC-W(60) at (2.8Ghz, 50%Clk.) is due it’s very high CPU utilization (92% - almost close to saturation). This results in the TPC-W threads spending lot of time waiting in the run queue, further delaying the time for receiving the next I/O request.
Power States (DVFS GHz, Clk. Mod. (%)) Normalized performance
Average Response Time (3.2, 100) (2.8, 100) (2.8, 50) 1 1.18 15.69
Table 9: Performance degradation of TPC-W(60) at three different power states expressed as the ratio of average session response time with that offered by the servers operating at the highest power state (obtained from profiling.) No. of Servers 6 7 8 9
Threshold Violation Meas. (%) Pred.(%) 0 0 2 4.8 61.2 39.9 N/A N/A
Perf. Degradation Meas. Pred. 1 1 1.04 1.08 5.2 9.3 N/A N/A
Feasible? YES YES YES NO
Table 10: Predicted and measured power threshold violations at the PDU and normalized performance degradation for the instances of TPC-W(60), running on each of the servers connected to the PDU. Performance degradation is expressed as the ratio of average session response time to that offered by the server operating at its highest power state. The column labeled Feasible? indicates whether we would be able to prevent the sustained budget for the PDU from being violated. Legend: Meas.=Measured, Pred.=Predicted, Perf.=Performance, N/A=Not Applicable.
measured degradation upon actually connecting 7 servers running TPC-W(60) was only 1.04. We also estimate that while 8 servers can be safely connected and operated, such a configuration would result in significantly degraded performance (the measured normalized degradation, although much smaller than predicted, is still a significant 5.2.) 7.4 Efficacy of Soft Fuses In Figure 5, we showed that we were able to connect up to 7 servers (using SP(10)) each running TPC-W to our 1200W PDU. The above scenario depicts a flat hierarchy where all servers are directly connected to the 1200W PDU. However, in a realistic setting, the 1200W PDU could in turn be connected multiple lower level PDUs. Consider a scenario where our 1200W PDU is connected to two 600W PDUs. Now, we will be able to pack only 3 TPC-W(60) servers on each of the 600W PDUs (A 600W PDU connected to more than 3 servers will always exceed power budget since the idle power of our servers itself is 155W). Therefore, the 1200W PDU remains under-utilized (connected to only 6 servers) because of the unused (fragmented) capacities at the 600W PDUs. If we had instead connected two 800W PDUs to the 1200W PDU 6 and set the soft fuse to be 690W and 510W for the first PDU (connected to 4 TPC-W servers) and second PDU (connected to 3 TPC-W server) respectively, then we could have packed 7 TPC-W(60) servers (using SP(20) for both PDUs). It is important to note that the sum of soft fuse at the lower level PDUs (690W + 510W) is less than or 6 In fact, it is common in data centers to have lower level PDUs whose sum capacity adds up to more than that of the parent PDU. This is done to accommodate future addition of compute equipments to its hardware-base which is more frequent than infrastructure upgrade (Refer Figure 1).
Figure 6: Illustration of the application configurations before and after our example of re-provisioning.
equal to that of the higher level PDU (which is 1200W). This is an improvement of 16.66% in the degree of provisioning for the 1200W PDU. Upon provisioning using SP(20), the 95th percentile of TPC-W session response time grew from 1.59 to 1.86 seconds, a degradation of only 17%. 7.5 Dynamic Changes in Workloads In Section 5.1 and 7.2, we looked at techniques based on CPU DVFS states to handle transient power spikes above the soft fuse. While these techniques suffice for short-term power budget violations, the same when applied to long-term power budget violations (like time-of-day phase variations), will result in undue degradation in performance. In this section, we develop techniques to deal with long-term dynamic phase change in applications. Specifically, we are interested in two aspects of dynamic variations exhibited by a hosted workload. First, it may consume higher power than indicated by its power profile, which will result in more frequent violations of the power thresholds associated with power supply elements, raising the extent of degradation in performance (due to throttling.) Second, a workload may consume substantially lower power than its profile, resulting in overly-conservative provisioning. We evaluate a simple mechanism to detect such changes and adjust the provisioning parameters accordingly. We keep track of the recent power profile of the PDU and periodically compare it with its predicted profile. If there is a statistically significant difference between these distributions, (as reported by a well-regarded test such as the Kolmogorov-Smirnov Test), we assume the workload has changed enough to necessitate re-provisioning. Note that, upon detecting a phase change at the PDU level, we may want to trigger instances of similar detection down the hierarchy to single out the application whose phase has changed. This can be achieved since we have the predicted profile of every server consolidated in the power hierarchy.
8. Related Work Research on Provisioning of Power Infrastructure. Serverlevel: Server vendors (like [Dell Power Calculator 2008]), in an attempt to help data centers administrators do better provisioning, provide calculators for estimating the peak power needs of their servers, given its component configuration and workload characteristics. [Lefurgy 2007] observe that the power supplies of servers are typically over-provisioned
1 0.9
CDF
We evaluate a simple scenario to demonstrate the working of this mechanism. We consider a set of six servers. Three of these servers run an instance of SPECjbb2005 each, two servers run TPC-W(20), and the sixth server runs TPC-W(60). We assume that we are provided with 2 PDUs (P DU1 and P DU2 ), each with a budget (600W, 5 sec). Based on our SP (0) provisioning, we connect two SPECjbb2005 servers and a TPC-W(20) server to P DU1 and the remaining servers (hosting one out of SPECjbb2005, TPC-W(20), and TPC-W(60)) are connected to P DU2 . Suppose the workload of the TPC-W(20) connected to P DU1 increases in intensity to TPC-W(60), simulating an overload where 40 new clients open sessions. The measured sustained power consumption of P DU1 , before and after this workload change, is presented in Figure 7. This triggers reprovisioning to accommodate the increased workload (the exact mechanisms of such re-provisioning are orthogonal to this work), as shown in Figure 6, where this instance of TPC-W(60) under P DU1 is swapped with the TPC-W(20) under P DU2 to prevent degraded performance for these new sessions via throttling. We determine the overheads and effects of migration involved in the re-configuration described above. We use Xen’s live migration facility [Clark 2005a] to migrate the TPC-W servers between the PDUs and find that it approximately takes 32 seconds to migrate the virtual machines. This causes a factor of 1.37 and 2.02 average response time degradation for the workloads TPC-W(60) and TPC-W(20), respectively. In Section 4.3, we mentioned that soft fuse enables flexible distribution of power down the power supply hierarchy. We present a small example to illustrate how soft fuses can be changed dynamically to adapt to varying workload behavior. In the above scenario, assume we replace both the 600W PDUs connected to our 1200W PDU with two 800W PDUs. The soft fuse for the 1200W PDU is set to be equal to its sustained power budget. Before the phase change, we set the soft fuse as 600W for both the 800W PDUs. After detecting the phase change, instead of performing a potentially costly migration, we merely change the soft fuses of P DU1 and P DU2 to be 620W and 580W, respectively (using SP(0) for both PDUs). Since we provisioned for the peak ((SP(0)), there is no degradation in performance for the TPC-W workload. Note that both before and after phase change, the sum of the soft fuses of P DU1 and P DU2 does not exceed that of the 1200W PDU.
0.8
0.977
0.7 0.6
2 SPECjbb + TPC−W(20) 2 SPECjbb + TPC−W(60)
0.5 550
560
570
580 Power(Watt)
590
600
610
Figure 7: Illustration of the measured sustained power distributions of P DU1 before and after the phase change. Workload change is detected by comparing the two distributions. The arrow indicates violation of sustained power budget after the phase change.
and report that replacing these with cheaper power supplies with 15% lower capacities results in negligible degradation in performance. To prevent rare power spikes from exceeding the capacity, they implement a reactive technique that keeps the server power within safe limits. [Felter 2005] observe that different components of a server (CPU, memory, etc.) do not require their peak power simultaneously. This suggests that statistical multiplexing techniques explored in our paper could be extended to the granularity of individual resources within a server. They devise a technique that dynamically apportions the total system power among the system components thereby reducing the power and cooling requirements of a server. Cluster-level: Ensemble-level power management [Ranganathan 2006] looks at provisioning the cooling capacity as opposed to our work that looks at provisioning power capacity expended towards operating servers. The authors observe that for real workloads, the possibility of their peak power consumptions occurring simultaneously is small and use it to better provision the cooling capacity at a blade enclosure level. Their results showed that they are able to realize a reduction of 20% system power budget with minimal performance impact. Very closely related to our research is recent work by [Fan 2007] which also looks at provisioning the power infrastructure for large data centers at different levels of the power hierarchy. They analyze data from a real large-scale Google data center and estimated that their power supply infrastructure has enough headroom to accommodate 46% additional servers with minimal performance degradation. While our research shares several basic ideas with the above body of work, to the best of our knowledge, we are the first ones to: (i) precisely define the constraints imposed by fuses/circuit-breakers deployed in the power hierarchy by introducing the notion of sustained power budgets, (ii) develop efficient power capacity provisioning techniques that exploit the burstiness of applications to strike the desired balance between cost gains and performance loss while guaranteeing safe operation, and (iii) demonstrate the feasibility of our approach in a prototype data center.
Control Techniques for Power/Performance Trade-offs. CPU throttling has widely been adopted for enforcing peak power budgets related to: (a) thermal/cooling capacity of a server [Raghavendra 2008, Ramos 2008] and (b) provisioning power capacity of a server [Lefurgy 2007, Fan 2007]. [Wang 2008] developed a control-theoretic model that enforces a specified power budget at a cluster level and dynamically distributes the power budget among the connected servers based on their needs. [Nathuji 2007] and [Stoess 2007] extend power management solutions for the virtual machines running on virtualized hardware. [Raghavendra 2008] look at coordinating the different power budgets (peak and average) enforced at different granularities. A lot of research has gone into evaluating the energy/performance trade-offs of applications which involves keeping either energy or performance as a constant and optimizing for the other metric [Weisel 2002, Chaitanya 2008, Annavaram 2005]. The above techniques for implementing some form of power budgets are complementary to our work. Yield Management Inspired Provisioning Techniques. Provisioning practices inspired by yield management have been explored in areas such as the airline industry [Smith 1992], networking [Boorstyn 2000], memory [Waldspurger 2002], and CPU/network management [Urgaonkar 2002] for servers.
9. Concluding Remarks The central thesis of this research was that by carefully understanding the power needs of hosted workloads and their aggregates, a data center could significantly improve the cost-revenue trade-off associated with its power supply hierarchy. We designed a novel technique guided by the application power profiles that employed controlled underprovisioning, statistical multiplexing, and over-booking when provisioning the power infrastructure. Our evaluation on a prototype data center using well-regarded benchmarks demonstrated the feasibility and benefits of our technique. By accurately identifying the peak power needs of hosted workloads, our technique was able to double the throughput per provisioned power capacity (expressed as CPW) offered by a PDU running the e-commerce benchmark TPC-W compared to conventional provisioning practices. Over-booking the PDU by 10% based on tails of power profiles yielded a further improvement of 20% in PDU throughput with minimal degradation in performance. We view this paper as a first step towards demonstrating that our provisioning technique could be effective in real, large-scale data centers. As part of our future work, we hope to use the insights gained from this exercise to explore the efficacy of such provisioning techniques in reasonably-sized data centers with a complex hierarchy of PDUs, heterogeneous servers, network switches, disk arrays, etc. We are in the process of collecting CPU utilization and power consumption data from real production servers. We intend to
use this data to evaluate the efficacy of our prediction and provisioning techniques.
10. Availability A Xen patch for enabling DVFS MSR writes, code for our threshold-based budget enforcement mechanism and scripts for our prediction techniques are available at: http://csl.cse.psu.edu/hotmap.
Acknowledgements We would like to express our gratitude to our shepherd Jeff Kephart of the IBM Thomas J. Watson Research Center and the anonymous reviewers for their detailed comments that helped us improve the quality of our paper. Also we would like to thank Karthick Rajamani, IBM Austin Research Laboratory for his insightful comments that helped us improve our paper. This research was funded in part by NSF grants CNS-0720456, CPA-0811650 and a gift from Cisco System, Inc.
References [Annavaram 2005] Murali Annavaram, Ed Grochowski, and John Shen. Mitigating Amdahl’s Law through EPI Throttling. In Proceedings of the International Symposium on Computer Architecture (ISCA), 2005. [Barham 2003] Paul Barham, Boris Dragovic, Keir Fraser, Steven Hand, Tim Harris, Alex Ho, Rolf Neugebauer, Ian Pratt, and Andrew Warfield. Xen and the art of virtualization. In SOSP ’03: Proceedings of the nineteenth ACM symposium on Operating systems principles, New York, NY, USA, 2003. ACM. [Boorstyn 2000] R. Boorstyn, A. Burchard, J. Liebeherr, and C.Oottamakorn. Statistical Service Assurances for Traffic Scheduling Algorithms. In IEEE Journal on Selected Areas in Communications, 18:12, pages 2651–2664, December 2000. [Chaitanya 2008] Shiva Chaitanya, Bhuvan Urgaonkar, and Anand Sivasubramaniam. QDSL: QoS-aware Systems with Differential Service Levels. In Proceedings of the ACM Conference on Measurement and Modeling of Computer Systems (SIGMETRICS), Annapolis, MD, June 2008. [Choi 2008] J. Choi, S. Govindan, B. Urgaonkar, and A. Sivasubramaniam. Profiling, Prediction, and Capping of Power Consumption in Consolidated Environments. In IEEE International Symposium on Modeling, Analysis, and Simulation of Computer and Telecommunication Systems, 2008. [Clark 2005a] C. Clark, K. Fraser, Steven Hand, J. Hansen, E. Jul, C. Limpach, I. Pratt, and A. Warfield. Live Migration of Virtual Machines. In Proceedings of the 2nd Symposium on Networked Systems Design and Implementation (NSDI’05), May 2005. [Clark 2005b] D. Clark. Power Hungry Computers Put Data Centers in Bind. The Wall Street Journal (Online), November 2005. http://hightech.lbl.gov/DCTraining/ docs/wsjon-data-ctr-power.pdf. [Circuit Breakers 2009] Commercial Circuit Breakers. http://circuit-breakers.carlingtech.com/ all circuits.asp.
[Dell Power Calculator 2008] Dell Power Calculator, May 2008. http://www.dell.com/content/topics/topic. aspx/global/products/pedge/topics/en/ config calculator?c=us\&cs=555\&l=en\&s=biz.
level power management for the data center. In 13th International Conference on Architectural Support for Programming Languages and Operating Systems, March 2008.
[Dell SC1425 2005] Dell SC1425, Dec 2005. http: //www.dell.com/downloads/global/products/ pedge/en/sc1425 specs.pdf.
[Ramos 2008] L. Ramos and R. Bianchini. C-Oracle: Predictive thermal management for data centers. In Proceedings of the Fourteenth International Symposium on High-Performance Computer Architecture (HPCA’08), February 2008.
[Fan 2007] X. Fan, W.-D. Weber, and L. A. Barroso. Power Provisioning for a Warehouse-Sized Computer. In Proceedings of the Thirty Fourth Annual International Symposium on Computer Architecture, 2007.
[Ranganathan 2006] P. Ranganathan, P. Leech, D. Irwin, and Jeff Chase. Ensemble-level Power Management for Dense Blade Servers. In Proceedings of the International Symposium on Computer Architecture (ISCA), June 2006.
[Felter 2005] W. Felter, K. Rajamani, C. Rusu, and T. Keller. A Performance-Conserving Approach for Reducing Peak Power Consumption in Server Systems. In 19th Annual International conference on Supercomputing (ICS), June 2005.
[Raritan Inc. 2008] Raritan Inc. 20Amp PDU Model, May 2008. http://www.raritan.com/products/ power-management/Dominion-PX/DPCR20-20/.
[Gartner 2007] Gartner 2007. http://www. globalactionplan.org.uk/upload/resource/ Full-report.pdf.
[EPA Report 2007] Server and Data Center Energy Efficiency - EPA, August 2007. http://www.energystar.gov/ ia/partners/prod development/downloads/ EPA Datacenter Report Congress Final1.pdf.
[Heins 2006] S. Heins. Divorcing Electricity Sales from Profits Creates Win-Win for Utilities and Customers, Energy Pulse, Sept. 2006. http://www.energypulse.net/ centers/article/article display.cfm?a id= 1342.
[Smith 1992] B. C. Smith, J. F. Leimkuhler, and R. M. Darrow. Yield Management at American Airlines, Jan 1992.
[Hellerstein 2000] J. Hellerstein, F. Zhang, and P. Shahabuddin. A Statistical Approach to Predictive Detection. Computer Networks, January 2000.
[SPEC POWER 2008] SPEC POWER. http://www.spec. org/specpower/.
[HP Power Manager 2008] HP Power Manager. http: //h18013.www1.hp.com/products/servers/ management/ilo/power-regulator.html.
[Smith 2005] W. Smith. TPC-W: Benchmarking An Ecommerce Solution. http://www.tpc.org/information/ other/techarticles.asp.
[SPECCPU 2000] SPECCPU. cpu2000/.
http://www.spec.org/
[SPECJBB 2005] SPECJBB. jbb2005/.
http://www.spec.org/
[IBM Energy Manager 2007] IBM Energy Manager. http: //www-03.ibm.com/press/us/en/pressrelease/ 22551.wss.
[Stoess 2007] J. Stoess, C. Lang, and F. Bellosa. Energy Management for Hypervisor-Based Virtual Machines. In Proceedings of the USENIX Technical Conference (USENIX’07), June 2007.
[IBM Workload Estimator 2009] IBM Workload Estimator. http://www-304.ibm.com/systems/support/ tools/estimator/index.html.
[Urgaonkar 2002] B. Urgaonkar, P. Shenoy, and T. Roscoe. Resource Over-booking and Application Profiling in Shared Hosting Platforms. In Proceedings of the 5th USENIX Symposium on Operating Systems Design and Implementation (OSDI), Boston, Dec 2002.
[Iyer 2000] R. Iyer, V. Tewari, and K. Kant. Overload Control Mechanisms for Web Servers. In Workshop on Performance and QoS of Next Generation Networks, 2000. [Lefurgy 2007] C. Lefurgy, X. Wang, and M. Ware. Server-Level Power Control. In ICAC ’07: Proceedings of the Fourth International Conference on Autonomic Computing, Washington, DC, USA, 2007. IEEE Computer Society. [Nathuji 2007] R. Nathuji and K. Schwan. Virtualpower: Coordinated power management in virtualized enterprise systems. In 21st ACM Symposium on Operating Systems Principles (SOSP’07), 2007. [NYTimes 2006] New York Times Article. Hiding in plain sight, Google Seek More Power, June 2006. http: //www.nytimes.com/2006/06/14/technology/ 14search.html?pagewanted=2. [Park 2000] K. Park and W. Willinger. Self-Similar Network Traffic and Performance Evaluation. Wiley-Interscience, John Wiley and Sons, Inc., 2000. [Raghavendra 2008] R. Raghavendra, P. Ranganathan, V. Talwar, Z. Wang, and X. Zhu. No Power Struggles: Coordinated multi-
[Waldspurger 2002] C. Waldspurger. Memory Resource Management in VMWare ESX Server. In Proceedings of the Fifth Symposium on Operating System Design and Implementation (OSDI’02), December 2002. [Wang 2008] X. Wang and M. Chen. Cluster-level feedback power control for performance optimization. In Proceedings of the Fourteenth International Symposium on High-Performance Computer Architecture (HPCA’08), February 2008. [Weisel 2002] Andreas Weisel and Frank Bellosa. Process cruise control-event-driven clock scaling for dynamic power management. In Proceedings of the International Conference on Compilers, Architecture and Synthesis for Embedded Systems, October 2002. [Zeng 2002] H. Zeng, X. Fan, C. Ellis, A. Lebeck, and A. Vahdat. ECOSystem: Managing Energy as a First Class Operating System Resource. In Proceedings of the Architectural Support for Programming Languages and Operating Systems, Oct 2002.