A unique parabolic relation is observed to link skewness and kurtosis of ... those characterised by a negative skewness, are universally described by a special ...
Statistical properties of electrostatic turbulence in toroidal magnetized plasmas B. Labit, A. Diallo, A. Fasoli, I. Furno, D. Iraji, S.H. M¨ uller1 , G. Plyushchev, M. Podest` a2 , F.M. Poli, P. Ricci, C. Theiler and J. Horaˇcek3 Centre de Recherches en Physique des Plasmas (CRPP), Ecole Polytechnique F´ed´erale de Lausanne (EPFL), Association Euratom – Suisse, CH-1015 Lausanne, Switzerland 1 present address: Center for Energy Research University of California of San Diego, La Jolla, CA-92093, USA 2 present address: University of California at Irvine, Irvine, CA-92697, USA 3 Institute of Plasma Physics, Association EURATOM/IPP.CR, Praha, Czech Republic Abstract. A unique parabolic relation is observed to link skewness and kurtosis of density fluctuation signals, measured over the whole cross section of the simple toroidal device TORPEX for a broad range of experimental conditions. This relationship is also valid for density fluctuation signals measured in the scrape-off layer of the TCV tokamak. All the probability density functions of the measured signals, including those characterised by a negative skewness, are universally described by a special case of the Beta distribution. In TORPEX, fluctuations in the drift-interchange frequency range are necessary and sufficient to assure that probability density functions can be described by this specific Beta distribution. For a more detailed plasma scenario, it is shown that electron temperature and plasma potential fluctuations have different statistical properties compared to the density.
PACS numbers: ??
Submitted to: Plasma Phys. Control. Fusion
1. Introduction The transport associated with plasma turbulence constitutes one of the main limiting factors for the performance of magnetic fusion devices. Fluctuations leading to a turbulent state and possible methods to control them have been investigated for many years [1]. A statistical description of plasma turbulence [2] is appropriate to capture some of the underlying physical mechanisms. A significant effort is dedicated to finding universal aspects in this statistical description [3], i.e. a common behavior for all spatial and temporal scales and/or for different physical systems and experimental conditions.
Statistical properties of electrostatic turbulence in toroidal magnetized plasmas
2
The knowledge of some of these universal properties may lead to a better understanding of the impact of different types of micro-instabilities on the macroscopic behavior of the plasma, e.g. in terms of fluctuation induced transport. In magnetic fusion plasmas, the universality of the probability density function (PDF) is investigated in various devices and experimental conditions, only using local density measurements at the plasma edge or in the scrape-off layer (SOL) (see Ref.[4] and references therein). Despite the common observation that PDFs of density fluctuations are non-Gaussian, there is no consensus on a unique PDF that could model all the experiments. In this paper, we report on the statistical properties of the density fluctuations, in particular on their universal character, measured in the TORPEX toroidal device [5], in various experimental scenarios described in Sec. 2. We investigated first the universal character of the fluctuations by fitting the experimental PDFs with some analytical distributions evaluated with two experimental or optimized parameters. None of the tested distribution can universally fit the experimental data, Sec. 3. Therefore, a method based on higher moments of the probability density function is proposed. Such method unambiguously reveals the universal character of the plasma density fluctuations: a second order polynomial links the third and fourth moments, Sec. 4. In Sec. 5, we show that the Beta distribution, which was not yet tested, fits properly the experimental data, reinforcing this universal character. To progress towards an identification of the physical mechanism behind the universality, the role of the drift-interchange frequency range is investigated in Sec. 6. Finally, statistical properties of fluctuating density measurements in the SOL of the TCV tokamak are compared to those associated with density, temperature, and potential fluctuations obtained in a particular TORPEX plasma scenario, characterized by strong similarity to a tokamak scrape-off layer (Sec. 7). 2. Experimental setup The experiments are performed in TORPEX, a toroidal device with major and minor radius R = 1 m and a = 0.2 m, and a toroidal magnetic field up to 0.1 T. A small vertical magnetic field component ≤ 4 mT is superimposed to partly short circuit the vertical electric field due to ∇B and curvature drifts and reduce the particle losses [6]. Highly reproducible plasmas are created and sustained for up to 3 s by means of waves in the Electron Cyclotron range of frequencies [7]. Measurements of ion saturation current are obtained over the whole plasma cross-section (comprising ionization source, edge and confinement region) in a single plasma discharge, with a spatial resolution of 3.5 cm and at a sampling frequency of 250 kHz with a hexagonal array of 86 Langmuir probes, named HEXTIP [8]. As in these experiments temperature fluctuations are small compared to density fluctuations, ion saturation current fluctuations are assumed to be directly proportional to electron density fluctuations. The microwave power and the toroidal magnetic field are kept constant. Different neutral gases are used (H, He, Ar), the vertical magnetic field and the neutral gas pressure are varied, leading
Statistical properties of electrostatic turbulence in toroidal magnetized plasmas
3
to variations of the ion gyroradius, the plasma shape and the ion-neutral collision frequency. As a consequence, for all signals the range of time averaged densities n ¯ and electron temperature T¯e extends between 1.4 × 10¹⁵ and 3.7 × 10¹⁷ m−3 and 1 and 10 eV, respectively. The range of fluctuation levels is 1% ≤ δn/¯ n < 95%, where δn is the rms fluctuating density. The observed density fluctuations are associated with drift-interchange instabilities, generated in regions of bad field curvature and convected by the E × B fluid motion [5, 9]. The nature of these fluctuations is relevant for edge/SOL turbulence studies. Note that the achieved range of density fluctuations is large compared to what can be covered in tokamaks, even across several different devices. 3. Local statistical properties and relation with coherent modes and structure trajectories In this Section, we focus on a subset of the data which corresponds to a neutral gas pressure scan in Argon. To obtain the probability density function of the plasma density across the plasma cross-section, the ion saturation current Isat measured by each tip of HEXTIP is binned. Without an a priori idea on the PDF shape, a good compromise between resolution √ in the binned quantity and statistics is given by choosing a number of bins Nbin = O( N ) (N is the number of points in the time series). As the binning introduces some noise on√the distribution, we choose to smooth the PDF, using a smoothing parameter fixed to N /10. Five analytical functions, frequently used in plasma physics (Normal, Gamma, Log-normal, Extreme Value, Gumbel) are considered for describing the experimental distributions. All of them have two free parameters, the mean value µ and the R +∞ variance σ 2 , and are normalized in such a way that −∞ f (x)dx = 1. To determine which distribution provides the best fit to the experimental data, two different approaches are followed: to insert the parameters µexp and σexp estimated from the measured signals in the analytical expressions or to let them free to evolve in order to minimize the residual. The quality of a fit is estimated by comparing the N N bin bin X X ¤2 ¤2 £ smooth £ smooth different residuals: s = f (xi ) − f (xi ) , sexp = f (xi ) − f exp (xi ) i=1
and sopt =
N bin X i=1
£
i=1
¤2 f smooth (xi ) − f opt (xi ) , where f is the binned distribution from
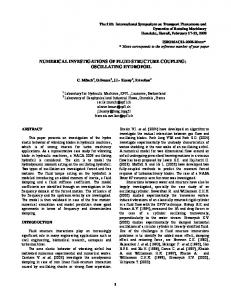
experimental signal, f smooth is the smoothed experimental distribution, f exp an analytical distribution with µexp and σexp and f opt , an analytical distribution with the optimal mean value and variance. A good fit corresponds to sexp,opt ≤ s. The result for the fit with the analytical distributions evaluated with µopt and σopt is plotted on Fig. 1(a) for three selected neutral gas pressure values. Results for a more complete pressure scan are presented in Ref. [10]. For all the neutral gas pressure values, double-humped PDFs (dark gray hexagons) are present. A doubled-humped
Statistical properties of electrostatic turbulence in toroidal magnetized plasmas -5
0
5
1500
500
-20 -20
20
5
120 80 40
-20
0 r(cm)
20
2 1
100 80 60 40 20
0
0
0 r(cm)
10
160
1000
0
15
Trajectory Counts
10
x1035 3
r (cm)
15
34
Trajectory Counts
0
x10
r (cm)
r (cm)
x1033
-20 c) 20 z (cm)
-5
1.0x10 mbar
2.3x10 mbar
20
-20 b) 20 z (cm)
-5
9.7x10 mbar
Trajectory Counts
z (cm)
a)
4
0
-20
0 r(cm)
20
Figure 1. For three different neutral gas pressures: (a) Result of the fit with optimized parameters. The color coding is the following: several PDF fit the experimental one (white), none PDF fit the experimental one (black), only one PDF fit the experimental one (soft gray), double-humped PDF (dark gray); (b) statistics of structures trajectories and (c) energy contained in the mode
distribution is associated with large amplitude coherent modes. This is confirmed by the correlation between the presence of a double-humped distribution and a large ratio of the energy contained in the coherent modes to the total energy (Fig. 1(b)). Coherent modes have been identified from the statistical frequency distribution computed from the spectra of the 86 tips of HEXTIP [9]. The range of frequencies over which the spectra are integrated to estimate the energy is given by the full-width at half-maximum of the distribution. At high pressure, almost all single-humped distributions can be fitted by any of the tested PDFs (white hexagons). In contrast, at low pressure, some measured distributions corresponding roughly to the transition between double-humped and single-humped can be fitted by none of the tested distributions (black hexagons). Finally, for a small subset of the experimental data, we find that only one tested PDF yields a good fit (soft gray hexagons). In this case, one can conclude that none of the analytical functions is predominantly present compared to the others and that no particular spatial localisation or particular value of the neutral gas pressure is correlated with a given analytical distribution [10]. On Fig. 1(c) we represent the trajectories of the fluctuation structures. Structures are defined as spatial regions where the density deviation from average
Statistical properties of electrostatic turbulence in toroidal magnetized plasmas
5
exceeds a threshold value. By following these structures in time, their trajectories can be identified [11]. It is clear that the modes with large amplitude and the trajectories associated with a drift-wave propagating with the E × B velocity are located where an experimental time series is characterized by a double-humped distribution. 4. Unique relation between skewness and kurtosis A fitting method based on the 1st and 2nd moments of the PDF can not provide a clear evidence of universality for the statistical properties of density fluctuations. A new approach based on higher moments is presented in this section. For around 10000 HEXTIP signals, the skewness (normalized third order moment of the PDF) and the kurtosis (normalized fourth order moment of the PDF) are estimated and plotted against each other (Fig. 2). We observe that a significant fraction of the signals (' 30%) are characterized by a negative skewness. Previous measurements in tokamak plasmas [12] reported a change in the skewness sign from positive to negative values when crossing the last closed flux surface from the SOL region into the plasma edge. The data in Fig. 2 is least-square fitted by the quadratic polynomial K = (1.502 ± 0.015)S 2 + (2.784 ± 0.019).
(1)
The uncertainty on the estimated coefficients corresponds to the 95% confidence bounds. This interval is illustrated on the graph with error bars. The inset in Fig. 2 shows that approximately 95% of the experimental data is contained within these error bars. Such a link between third and fourth order moments is valid for a large set of PDF families [13]. This emphasizes the importance of identifying a particular parabolic relation when trying to determine a theoretical PDF that reproduces experimental distributions. Because of the functional relation between the kurtosis and the skewness, none of the analytical PDFs that are defined with constant S and K (normal, logistic, Rayleigh, uniform, exponential, etc.) cannot universally reproduce the experimental measurements. Furthermore, a quadratic polynomial rules out distributions (triangular, error, Student’s, etc.) for which either K or S varies, but the other moment is constant. Finally, the robustness of the least-square fit Eq. (1) excludes distributions (Weibull, Log-normal, Wald, F, etc.) that have a similar relationship between K and S but with different coefficients [13]. All these PDF can be excluded together with the underlying physical basis from which they originate. The question one needs to answer now is: Is there an analytical distribution that is charecterized by a relationship between its skewness and its kurtosis identical to the one found from experiment? 5. The Beta distribution and its application to experimental results The polynomial in Eq. (1) is very close to the relation between the kurtosis and the skewness associated with the Gamma distribution: K = 1.5S 2 +3, although the skewness of the Gamma distribution is by definition always positive [13]. One distribution that
35
kurtosis
Statistical properties of electrostatic turbulence in toroidal magnetized plasmas 0
1
6
2
log (#counts) 10
10
kurtosis
25
5
-2
0 skewness 2
15
5 -2
0
skewness
2
4
Figure 2. Kurtosis versus skewness computed for 8966 experimental signals. The fitting second order polynomial (solid grey line) is also plotted. Inset) Joint probability of K and S for the experimental signals. On both graphs, the error bars correspond to the 95% confidence interval.
can admit both positive and negative values for the skewness is the Beta distribution [13]. For a random variable n, the general Beta distribution is defined by: (n − nl )p−1 (nh − n)q−1 (2) B(p, q)(nh − nl )p+q−1 nh ; p, q > 0 and B is the Beta function defined as
Fβ (n; p, q, nl , nh ) =
where nl Z ≤ n ≤ 1 B(p, q) = tp−1 (1 − t)q−1 dt. Its first four normalized moments can be computed from 0
p (nh − nl ) + nl p+q pq (nh − nl )2 , σ2 = 2 (p + q) (p + q + 1) r 2(q − p) p+q+1 , S= (p + q + 2) pq µ=
(3) (4) (5)
and 3(p + q + 1) [2(p + q)2 + pq(p + q − 6)] . (6) pq(p + q + 2)(p + q + 3) The relation between the third and fourth moments is not trivial since it depends on parameters p and q, but S and K do not depend explicitly on the boundaries of the random variable n. Moreover, for any (p, q) it can be shown that [13] K=
1 + S 2 (p, q) ≤ K(p, q) ≤ 3 + 1.5S 2 (p, q).
(7)
Statistical properties of electrostatic turbulence in toroidal magnetized plasmas a)
d)
c)
-1
P.D.F.
10
low pass high pass
7 Ar H2
-2
normalized residual
10
-3
10
-2
10 8
10 density (x10 16 m-3 )
b)
P.D.F.
6
Normal; 1.72
-1
P.D.F.
10
Gumbel; 7.98 Gamma; 1.21 Log-normal; 1.45 Extreme val.; 3.26 Beta; 0.63
-4
10
-2
10
-3
10
2
6
10
density (x10 16 m-3 )
2
He
0
He H2
10
10
-2
10
0
residuals
10
Ar 2
10
10 -1
10 0
101
cut off frequency (kHz)
Figure 3. a) and b) Two experimental distributions from Argon plasmas (gray line) with a negative (a) and positive (b) skewness. The Beta distribution (solid) and the Gamma distribution (dash) estimated with µexp and σexp are also plotted. c) Distributions of the residuals between all the experimental PDFs and several analytical distributions estimated with µexp and σexp . The average value of the residuals is indicated in the legend. d) Normalized residuals for different cut-off frequencies of a low-pass and a high-pass filters applied to experimental signals. The shadowed region represents the drift-interchange frequency range.
The upper limit is reached when q → +∞ for positive skewness and when p → +∞ for negative skewness. The experimentally measured skewness and kurtosis are very close to the upper limit of the domain of variation for a Beta distribution, thus either p or q has to be large. In Ref. [4], we have shown that the best choice for the boundaries nl and nh is to take nl = nmin and nh = nmax where nmin and nmax are the minimal and maximal density for each time trace, respectively. With this choice, typical values for parameters p and q estimated together with µexp and σexp , are larger than 100. Thus S and K for a Beta distribution, Eqs. (5-6), are close to the upper limit in Eq. (7) and are compatible with the experimental third and fourth moments. An illustration of the good agreement between the experimental PDF and the Beta distribution is shown in Fig. 3(a-b) for a negative and a positive skewed experimental distributions. For all the signals, we repeat the analysis presented in Sec. 3. We compute the residual sexp between the experimental distribution and several analytical PDFs, including now the Beta distribution, evaluated with µexp and σexp . The probability distribution function of the residuals is shown in Fig. 3(c). The Beta distribution provides the smallest average residual as well as a better fit than any other tested PDF in the region of small residuals (sexp ≤ 0.1). All the experimental PDFs can be universally reproduced by a limiting case of the Beta distribution.
Statistical properties of electrostatic turbulence in toroidal magnetized plasmas
8
6. Role of the drift-interchange frequency range To address the question of which physical mechanisms contribute to such behavior, we investigate which frequency range of the fluctuations spectrum, if any, is necessary and sufficient to recover the Beta distribution. For the three neutral gases used, M ' 800 signals have been filtered at different cut-off frequencies (0.1 kHz ≤ fc ≤ 50 kHz) with both low-pass and high-pass filters. For all the cut-off frequencies fc , the skewness Sj (fc ) and the kurtosis Kj (fc ) of the filtered signals are estimated. For each fc , the residual defined by rfc =
M X £
¤2 Kj (fc ) − (1.502Sj (fc )2 + 2.784) ,
(8)
j=1
is computed and normalized to the original residual for the unfiltered signals, rexp =
M X £
¤2 2 Kj,exp − (1.502Sj,exp + 2.784) .
(9)
j=1
This quantity is represented in Fig. 3(d) for different cutoff frequencies and for the three gases. As fc increases (decreases) for the low-pass (high-pass) filters, the difference between the original moments and those associated with filtered signals tends to disappear. For the three gases, if only the low (fc ≤ 1 kHz) or high (fc ≥ 20 kHz) frequency contributions to fluctuations are kept, the experimental fit described by Eq. 1 cannot be satisfied. The density fluctuations contained in the measured frequency range of drift-wave instabilities (1 kHz ≤ f ≤ 10 kHz) [9] must be retained to recover this Beta distribution. 7. Statistical properties of SOL-like plasmas in TORPEX Up to now, only the statistical properties of the plasma density fluctuations in TORPEX have been investigated. In this section, we report on similar studies for density measurements from another toroidal plasmas, the SOL plasmas of the TCV tokamak but also for other quantities than the density, like the electron temperature and the plasma potential measured on TORPEX. Measurements of electron temperature fluctuations and plasma potential fluctuations on TORPEX have been performed in a particular plasma scenario. Hydrogen plasmas are produced by microwaves with Prf ' 400 W. The plasma source is localized on the high-field side, with negligible plasma production for r ≥ 5 cm. By using a relatively high vertical magnetic field (Bϕ = 76 mT, Bz = 2.3 mT), the profiles of pressure and plasma potential are vertically elongated, peak in the high field side region and decrease towards the low field side. (Fig. 4(a-b)). The poloidal profile of the skewness estimated for the 86 signals measured by HEXTIP and averaged over 30 similar shots is plotted on Fig. 4(c). In this configuration, we identify two distinct poloidal regions with different plasma dynamics: 1) a main plasma region for r ≤ 5 cm dominated by a coherent interchange mode at f ' 4 kHz. The inner part of
Statistical properties of electrostatic turbulence in toroidal magnetized plasmas
9
this region is characterized by density fluctuations with negative skewness (Fig. 4(c)); 2) a region on the low field side for r ≥ 5 cm with negligible plasma production, dubbed source-free region (as no plasma production process is present), characterized by the propagation of plasma blobs leading to positively skewed PDF and resulting in intermittent transport events [14]. The mechanism for plasma blob formation in TORPEX has been investigated using time-resolved measurements of two-dimensional structures of electron density, temperature and plasma potential. The blobs are observed to form from a radially elongated structure that is sheared off by the E × B flow [15]. The ensemble average difference between the experimental kurtosis and the values obtained from Eq. 1 with the experimental skewness is plotted in Fig. 4(d). The agreement is good for fluctuations in the ”source-free” region. The mode region is characterized by double-humped PDF, with kurtosis lower than 3 (the value associated with the Gaussian distribution) and so experimental kurtosis are not perfectly fitted by Eq. 1. Nevertheless, the relationship between the skewness and the kurtosis for these signals is still parabolic (Fig.4(e)) and lies within the error bars provided by the 95% confidence bounds on the polynomial coefficients. pressure (m -3.eV)
2
< Kexp - (1.502 Sexp + 2.784) >
skewness
plasma potential
16
x 10 0
4
2
2
6
a)
6
0
12
b)
1
-1
c)
0
1
d)
z (cm)
10 0 -10 -20
0 r (cm) e)
-20
0
20 -20
TORPEX TCV
1 skewness
kurtosis
10
20
5
0 -1
0
20 -20
0
20 f)
Te Vpl n
0
-1 0
1 skewness
2
3
-10
0
r (cm)
10
20
Figure 4. 2D poloidal profiles of the time-averaged plasma pressure (a), plasma potential (b), density fluctuations skewness c) and d) difference beteween the experimental kurtosis and values from Eq.1 e). Kurtosis versus skewness for 2580 signals in the ”SOL like configuration” in TORPEX (squares) and for 962 signals measured in the TCV SOL. f) Radial profiles of the skewness estimated for n, Te and Vpl .
Statistical properties of electrostatic turbulence in toroidal magnetized plasmas
10
Figure 4(e) also shows the kurtosis versus the skewness for plasma density measurements taken with a reciprocating Langmuir probe at different radial locations in the edge/SOL of the TCV tokamak. The experimental values, corresponding to 24 L-mode diverted plasmas in different conditions (Ip ≷ 0, 3.2×10¹⁹ ≤ ne ≤ 12×1019 m−3 , gas: He, De) [16] are well fitted by Eq. (1). For SOL signals characterized by positive skewness, the Gamma distribution has been previously reported to be compatible with their PDF [17]. But indeed, for large parameters p and q, the Beta distribution is equivalent to FΓ (n) for positive skewness and to FΓ (2µ − n) for negative skewness, where µ is the mean value of the density n and ZFΓ is the Gamma distribution defined ∞
as fΓ (n; α, θ) = θ−α nα−1 e−n/θ /Γ(α) with Γ(α) =
tα−1 e−t dt is the Gamma function.
0
In a sense, this extends the previous results for TCV tokamak to negatively skewed PDFs mainly associated with signals measured inside the LCFS. Similarly to TORPEX plasmas described before, the interchange turbulence plays a prominant role at the edge/SOL boundary layer, confirmed by numerical simulations [18]. Finally, we address the question of statistical properties of quantities other than the plasma density. The radial profiles of the skewness of the electron temperature and of the plasma potential are shown in Fig. 4(f). The time evolution of Te and Vpl is measured using a triple probe [19]. The statistical properties of these quantities are much more gaussian than for the density fluctuations. This is due to the fact that, in this case, δTe /Te ' δVpl /Vpl ≤ 10% while 20% ≤ δn/n ≤ 60%. This suggests that there is some heat transport associated with a plasma blob but this loss channel is much less efficient than the heat transport associated with the electrons moving fast along the field lines [19]. 8. Conclusion and outlook We have analyzed electrostatic fluctuations measured over the entire cross-section of a simple toroidal magnetized plasma, including the source region for instabilities, regions where nonlinear mode coupling takes place and regions where the unstable modes are convected by the E × B flow [20]. For a subset of experimental data we have shown that double-humped distributions are localised at the same position as the trajectories and the largest amplitude of the coherent modes. This constitutes a first attempt of linking spectral features, spatio-temporal evolution and statistical properties of fluctuations in a toroidal plasma. Moreover, the single-humped PDFs of the density fluctuations at all locations are found to have a universal character, in the sense that a unique relation links the skewness and the kurtosis, and that it can be described by the same analytical distribution. This is a special case of the general Beta distribution Fβ (x), taking the form of the Gamma distribution FΓ , depending on the sign of the signal skewness. This specific Beta distribution can also reproduce density fluctuation signals, including those with negatively skewed PDF, measured in the SOL of tokamaks. These observations are consistent with the picture of a unique physical mechanism producing
Statistical properties of electrostatic turbulence in toroidal magnetized plasmas
11
events that would generate in the same region positive and negative density structures, corresponding to a local excess of density, and a density depletion, respectively [11, 21]. Both kinds of structures would carry along their motion the same PDF features, as they originate from the same local event. Only the fluctuations in the typical range of frequency associated with drift wave turbulence are necessary to assure that probability density functions can be described by this specific Beta distribution, ruling out an interpretation of the fluctuations statistical properties resulting from a fully developed turbulence. A more complete physical understanding of plasma turbulence in the present experiments requires extensive self-consistent numerical simulations of drift-interchange turbulence using nonlinear equations, e.g., based on the Hasegawa-Wakatani model. Such simulations are currently run for TORPEX plasmas. Nevertheless, the present results may have two consequences on the study of the underlying physics: the unique relation between moments of the plasma density PDF may lead to a low-order statistical closure of the chain of coupled equations [2]; the same global characterization of the statistical properties of various fluctuating fields, applied to numerical simulations outputs, may provide a valuable tool for the validation of the physical basis of the simulation model. Acknowledgments This work is partly funded by the Fonds National Suisse de la Recherche Scientifique. Fruitful discussions with Professor F. Skiff, Dr. R. Pitts and Dr. J. P. Graves are acknowledged. PR and JH are supported by a EURATOM Fusion fellowship. References [1] W. Horton 1990 Phys. Rep. 192 1 [2] J.A. Krommes 2002 Phys. Rep. 360 1 [3] U. Frisch 1995 Turbulence, The Legacy of A. N. Kolmogorov (Cambridge University Press, Cambridge, England) [4] B. Labit et al. 2007 Phys. Rev. Lett. 98 255002 [5] A. Fasoli et al. 2006 Phys. Plasmas 13 055903 [6] S. H. M¨ uller et al. 2004 Phys. Rev. Lett. 93 165003 [7] M. Podest`a et al. 2005 Plasma Phys. Control. Fusion 47, 1989; 2006 Plasma Phys. Control. Fusion 48 1053 [8] S.H. M¨ uller et al. 2005 Phys. Plasmas 12 090906 [9] F.M. Poli et al. 2006 Phys. Plasmas 13 102104 [10] B. Labit et al. 2006 Proceedings of the 33rd EPS Conference on Controlled Fusion and Plasma Physics, Rome, June 19-23, 2006, edited by F. De Marco and G. Vlad, ECA vol 30I, p1.143 uller et al. 2006 Phys. Plasmas 13 100701 [11] S.H. M¨ [12] J. A. Boedo et al. 2003 Phys. Plasmas 10 1670 [13] N.L. Johnson, S. Kotz, and N. Balakrishnan 1995 Continuous univariate distributions (John Wiley & Sons, New York) 2nd ed. ´ [14] S.H. M¨ uller 2006 Turbulence in basic toroidal plasmas PhD thesis No 3672 Ecole Polytechnique F´ed´erale de Lausanne http://library.epfl.ch/theses/?nr=3672
Statistical properties of electrostatic turbulence in toroidal magnetized plasmas
12
[15] I. Furno et al., Mechanism for plasma blob generation from drift-interchange waves submitted to Phys. Rev. Lett. [16] J. Horacek 2006 Measurements of edge electrostatic turbulence in the TCV tokamak ´ plasma boundary PhD thesis No 3524 Ecole Polytechnique F´ed´erale de Lausanne http://library.epfl.ch/theses/?nr=3524 [17] J. P. Graves et al 2005 Plasma Phys. Control. Fusion 47 L1 [18] Garcia, O.E. et al. 2006 Plasma Phys. Control. Fusion 48 L1 [19] M. Podest`a 2007 Plasma production and transport in a simple magnetised ´ toroidal plasma PhD thesis No 3765 Ecole Polytechnique F´ed´erale de Lausanne http://library.epfl.ch/theses/?nr=3765 [20] F. M. Poli, M. Podest`a and A. Fasoli 2007 Phys. Plasmas 14 052311 [21] T.A. Carter 2006 Phys. Plasmas 13 010701