Statistical relation between particle contaminations in ultra pure water and defects generated by process tools Faisal Walia, D. Martin Knotterb, Ronald Wortelboerb, and Auke Mudb a) University of Twente, b) NXP semiconductors Gerstweg 2 (FB 0.050), 6534 AE Nijmegen, The Netherlands Phone: +31 (0) 24 353 3212 Fax: +31 (0) 24 353 3323 E-mail:
[email protected]
Abstract—Ultra pure water supplied inside the Fab is used in different tools at different stages of processing. Data of the particles measured in ultra pure water was compared with the defect density on wafers processed on these tools and a statistical relation is found Keywords— Yield, defect density, particles, ultra-pure water
I. INTRODUCTION The focus of semiconductor industry is to increase yield and reduce size of technological features. Yield is defined as the average ratio of the number of usable devices that pass different tests after completing processes to the number of potentially usable devices before starting processes. By measuring all defects on the critical areas and determined the probability it causes a failure (so-called kill ratio), it is possible to predict yield. It is believed that a large part of the defects are due to the particle contamination coming on the wafer during different process steps [1, 2]. Due to the shrinkage of technological features into nano-scales, it is becoming more and more difficult to control the smaller particles contaminations. Most of these contaminations have been generated or coming from the environment around the Fab. We considered ultra pure water (UPW) as an important environmental factor to influence the particles contaminations. UPW has been used at different stages of processes. During processes, wafers have direct contact with water in wet etch and cleaning processes as well as litho tools. So it is essential to make the impact measurable in order to define improvement action
Manufacturing facilities employ some sort of wafer inspection scheme within the wafer fabrication area in order to detect particulate defects in the process line [3]. Most of inspection tools are based on the light scattering principle in which a laser beam is scanning the surface of the wafer and is scattered on the defect points [3, 4, 5]. In each Fab, there is a proper schedule established to detect the particle contaminations defects during the fabrication of IC’s. These detection procedures are consisted of two types. In one case, wafers were inspected during the production and it is called inline measurements. In second case some dummy wafers were processed in different tools and these wafers monitored afterwards to observe the defects generated by process tools, this is called offline measurements. In this study, we tried to establish a statistical relation between the particle concentration in UPW and defects generated on monitor wafers.
II. MATERIALS AND METHODS A. Method to analyses particles in UPW: In a wafer fab there is water treatment plant installed to provide the clean water required for IC-production. The amount of particles in UPW coming out of the installation is measured by using particle measurement tools. For this end, a M50 and UG50 are installed on two streams of water. These equipments are capable to detect the particles up to 50nm (Latex Sphere Equivalents). After every 15 minutes data has been collected and the
555
results in less opportunity to visualize data optically and try to establish some relation. 100000
100000
B. Method to analyses defects in Fab:
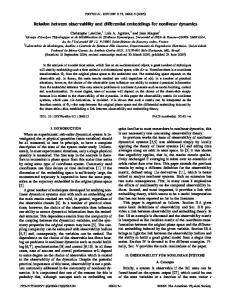
III. RESULTS AND DISCUSSIONS The amount of particles in UPW and defects generated inside Litho tool (Litho A) are plotted against the different dates of monitoring over the year. Results are shown in Figure 1. This figure shows that there is a fluctuation in the particles present in UPW and also fluctuations can be seen in Litho defects. Since a lot of peaks coincide it might indicate that the amount of particle contaminations increased in the UPW leads to increase defects inside Litho tool. Water analysis
100000
No. of particles in water
In the Fab metrology tools are dedicated to detect and analyze defects generated by different processes tools. A lot of tools in the Fab used UPW. In this study, we considered the example of the Litho track and cleaning tools. The defects generated by Litho tracks and cleaning tools are offline monitored on weekly basis. This has to be done by inserting the blank wafer in the tool and comparing the pre reading with the post readings.
100
100
10
10
50
100
150
200
250
1000
1000
100
100
10
10
0
20
40
60
80
1 100
Analysis days
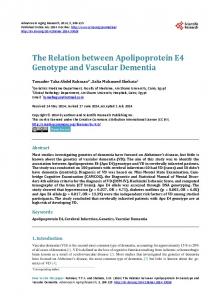
Figure 2: Relation between particles present in UPW and defects generated by WB_A
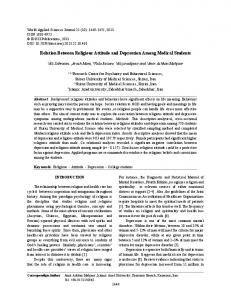
In figure 3, particles present in UPW are plotted against defects caused by Litho tools. The graph was divided in four regions. These four regions can be seen with A, B, C and D. We took the mean values of the Xaxis and Y-axis data without excursions. Then we calculated the standard deviations of the data and add three times the standard deviation with the mean values of both axis. These values are considered the minimum values to define an impact on both data. 200
1 300
Analysis date
Figure 1: Relation between particles present in UPW and defects generated by litho A
Similarly in figure 2, the amount of particles in UPW and defects generated inside cleaning tools (WB_A) are plotted against the different dates of monitoring over the year. Data of UPW was measured everyday over the year but the cleaning tools are checked only once or twice in a week. So in figure 2, it can be seen that less peaks appeared in UPW data compared to figure1. This
Defects in Litho tool
1000
No. of Defects generated by Litho tool
No. of particles in water
1000
0
10000
WB_A
x + 3δ
100000
10000
1
10000
1
Litho A
10000
water analysis
No. of defects caused by cleaning tools
mean value with standard deviation is measured for each day. All the data taken from these tools are placed in database.
150
B
100
A
50
y + 3δ
C
D 0 0
2000
4000
6000
8000
10000
Particles in UPW UP
Figure 3: Particles present in UPW Vs defects generated, graph has been divided in four regions with amount of the points present in each region
In the region A, the defects in litho tools are high that coincide with a large the number of particles in UPW. This region represents the one to one relation between the defects caused by Litho and the particles present in the UPW. In the region B, litho defects are higher but the number of the particles in UPW was at lower limit. In this case the defects are caused due to other process
556
variations. The region C represents that with higher amount of particles in UPW there is no increase in defects in the Litho tools. It is assumed that there are particles that have an impact on defects and particles that have not. The region D represents data where amount of particles in the UPW is less as well as the defects caused by Litho tools. This region also represents the one to one relation between the defects caused by Litho and the particles present in the UPW.
Further study required understanding the relation between the particle present in UPW and yield. It will be helpful to determine the specification limits and investigating that how particles are depositing?
In this case we cannot use the linear regression between particles present in UPW and defects generated by process tools. Linear regression can be established when we have to observe either both data are dependent on each other or not. In this particular case, we already know that defects generated in process tools can be due to some process problems as well. So we decided to use the different statistical approach. We performed the “1proportion test” that compares a proportion from a single sample of data against a known proportion in order to decide if they are different or not. “1-proportion test” is evaluated by p-value. The amount of p-value explained the signinficant relation between both datas. The lower the p-value, the better the relations. We consider p-value less than 0.1 to be significant. In this case, ratio of the excurstions appeared in UPW data over the normal readings is considered as “known proportion”. We compare the known proportion with the “data proportion” (A/A+B). The p value with “1-proportion test” for Litho A is 0.024. The p-value is sufficent low to show that the known proportion is statically different than the data proportion. This shows statistically that there is a relation between the particles present in UPW and the defects caused by process tools.
REFERENCES
V. ACKNOWLEDGEMENT Authors would like to acknowledge European MEDEA + program (2T102; HYMNE) for financial support.
[1] T. Kim and W. Kuo, “ Modeling manufacturing yield and reliability” IEEE, 1999, pages 485-491 [2] D. K. de Vries and P. J. Volf, ”Simplified implementation of the windowing method for systematic and random yield calculation” IEEE, 2004, pages 188-191 [3] F. Holsteyns, J. Roels, K. Kenis, Q. T. Le, and P. W. Mertens, “Monitoring and Qualification Using Comprehensive Surface Haze Information” IEE Proc.-Comput. Digit. Tech, 2003, pages 7803-7894 [4] User manual of Tencor Surfscan SP 6200 [5] User manual of KLA Tencor Surfscan SP1
Also other tools were tested and in all of 80% of the tools we found a significant relation
IV. CONCLUSIONS We showed statistically significant relation between the numbers of the defects generated by process tools and particle contaminations present in UPW. This work indicates that the water analysis data is important for measuring the efficiency of the tools inside the Fab. So it is highly recommended: Whenever Out of Control on defect is observed on any Litho track or cleaning tools, UPW data should be checked first
557