Statistical significance of a local sequence alignment depends not only on the ... real proteins formulas for assessing the statistical significance of ungapped ...
STATISTICAL
SIGNIFICANCE OF UNGAPPED SEQUENCE ALIGNMENTS N.N. ALEXANDROV, V.V. SOLOVYEV Amgen Inc, Thousand Oaks CA, USA
Statistical significance of a local sequence alignment depends not only on the similarity score and on the sequence lengths, but also on a length of the alignment. Dependence of the alignment significance on the length of the sequences has been analyzed earlier, and is based on the idea that the longer sequences have more chances to share a local similarity with a bigger score. To the best of our knowledge, a dependence of the statistical significance on the length of an alignment has not been used in selecting the best aligmments. We have applied to real proteins formulas for assessing the statistical significance of ungapped local alignments. Let L be a length of the alignment, then the expected value of a similarity score is Sexp = * L, where is the expected similarity between two randomly chosen residues. Value of can be calculated from a similarity (substitution) matrix M and amino acid frequencies P: =Lij pi*p/mij. The probability of observing a score S greater than or equal to x for an alignment of length L is given by the normal distribution: Prob(S ~ x) = I - f N«S-Sexp)/a)= I f N«S-*L)/am --JL),where am is a standard deviation of m. From these formula, we conclude, that we should select the best alignment using a normalized value of the similarity score as follows: S' = max{(S-*L)/ am--JL).The proposed normalization of the similarity score has been tested on the representative benchmark. To evaluate a performance of the normalization, we have calculated several measures of the recognition quality. Our normalization has improved all these measures. This procedure is important for choosing the correct alignment for homology modelling as well as for selecting distantly related sequences in databases.
1. Introduction Sequence comparison based on sequence alignment is the most powerful tool for inferring the biological function of a gene or the protein that it encodes (Pearson, 1996). A central question in sequence comparison is the statistical significance of the observed similarity. For local alignment without gaps this problem has been approached by several groups (Arratia et aL,1988; Karlin & Altschul, 1990). Local similarity scores are described by the extreme value distribution. The probability of finding a score S' > x can be calculated as: P(S'~x)
= l-exp(
-e-X), where S' is the
normalized similarity score S'=A*S-ln(K*m*n); m and n are the lengths of sequences; A and K are derived from the scoring matrix and the amino acid composition of sequences (Karlin & Altschul,1990; Altschul et aL,1994). Thus, in this theory the statistical significance of an alignment depends only on sequence lengths, letter distribution and scoring weights. In our work we show that it is necessary to include the length of alignment in such estimations. It is especially important when we try to recognize a short fragment (like a domain or EST encoded protein sequence interrupted by frame shift error) surrounded by unrelated sequences. Intuitively we can think that the match within such domain should be more 463
464
significant than a longer region when both of them have the same score, because a longer alignment can have bigger fluctuation of score values by chance. Using an appropriate random model, we present numerical formulas for normalizing a similarity score taking into account the length of alignment. Analysis of data base search results on a representative set of protein sequences has proved that the suggested normalization improve, in average, the quality of recognition. 2. Method We will consider the random sequence model where the elements of a sequence are chosen independently from an alphabet of a letters with respective probabilities Pi (i= I ,..,a). The pair of letters i of the first sequence and j of the second sequence occurs with probability Pi*Pj- Let the score for such a paring be mij. Usually the score matrix for aligning pairs of amino acids provides negative expected pair score =LijPiPjmij, that permits to apply extreme value distribution statistics (Karlin & Altschul, 1990). For example, Dayhoff's score matrix PAM-250 has =-0.79 and standard deviation of this score O"m=--Jv= --JLij(mU-)2PiPj is equal to 2.81. For an identity matrix, when all the elements are zeros, except the diagonal ones, which equal to 1:
= 0.058,
O"m
= 0.23.
For a given ungapped alignment of length L the expected aggregate score S of the alignment is S = *L. The score S, as the sum of many independent random variables (for large enough L) yields a normal distribution N with the expectation Sexpand the standard deviation 0".The variance V of N is the sum of variances v: V
= LL v = v*L
and thus s
= --JV= O"m *--JL.
The probability of observing a score S greater than or equal to x for an alignment of length L purely by chance is given by the formula: Prob(S ~ x)
= I - f N«S-Sexp)/O")= 1 - f N«S-*L)/O"m
--JL).
In other words, the significance of an alignment depends on its length and to rank the alignments properly, we should select the best alignment using normalized similarity score on a length of alignment: S'
= max
{(S-*L)/O"m
--JL}.
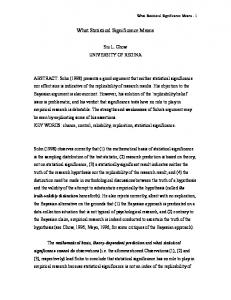
Notice that the alignment significance also depends on and O"m,i.e. on the scoring matrix and amino acid frequencies. Let us consider some interesting properties of such normalization. Fig. 1 shows behavior of the normalized score S' for several typical values of the raw score S. S' has a minimum S'min at the length Lmin, which is different for different S. We can see that for L< Lmin, the shorter the alignment, the greater its statistical significance, and the opposite is true for L>Lmin.
;
465
20 (!) 1-1
0 U
rJJ
15 S = 200
~
.-+--J 1-1 ro .......
.-
.-s rJJ "'0 (!) N
........ ro
S
"'...u
10
""-"-~ . " . . .~
-'.,
:::::~~::::
'.
"
"
..
,....
S=I50
----------
S=IOO
----------
S=50
5 ."----------------- ----------------
1-1
0
Z 0 0 0 ~
0 0 N
0 0 ('(')
0 0 ~
0 0 lr)
0 0 \D
0 0
r-
0 0
00
Length of alignment
Figure 1. Dependence of the normalized similarity score on the length of alignment. The dependence is particular important for short alignments. From this plot one can see, that short alignment with a raw score of 100 can be more statistically significance than a longer alignment with a raw score of 150.
The curves in figure 2 are steeper for the L < Lmin than they are past Lmin. In other words, the effect of normalization is greater for small fragments of sequences. Lmin could be calculated analytically that gives Lmin= -S/ (fig. 2). For reasonable sizes of the aligned fragments with L < Lmin, not unusual for natural
466
proteins (of about 100 amino acids), a raw similarity score underestimates the relative significance of these alignments, and can lead to errors in selecting the correct alignments, and, consequently, in detecting related sequences in databases.
300 250 200 .s:::
s
150
100 50 0 0 tn
0 0 ~
0 tn ~
0 0 N
0 tn N
Raw similarity score, S Figure 2. An expected length of the alignment (Lmin) is proportional to the raw similarity score. What is the threshold between significant alignments and random matches in terms of the percentage of the identical residues in the alignment? To compute an expected number of the identical residues we apply formula Sexp = *L. A level of the significance is expressed in the units of standart deviation Z. Thus alignment is significant if a number of the identical residues in it S ~ Sexp + Z* a = *L + Z*--JL*am, where = 0.058, am = 0.23. The same value, expressed as a percentage of identical residues is: I = 100*S/L = + Z*aml--JL.In Figu9Y3 we plot this threshold for several significance levels. A shape of the curv~ is very similar to the emperical plot derived by Sander&Schneider, 1991. /
467
60 50 40
9 sdt
... .
d200 a.a.) with 20% identity are significant. In this work we have applied the statistics for ungapped alignment, but we plan to extend the estimates for a general case as it was done for extreme value distribution statistics (Waterman & Vingron, 1994; Altschul & Gish, 1996; Pearson, 1996), which was initially devised for ungapped alignments. Ungapped alignments have clear practical value, being implemented in BLAST -- a widely used program for rapid sequence comparison (Altschul et aI., 1990).
3. Results We have tested the performance of our normalization scheme on a benchmark, used by Pearson to compare different methods for sequence comparison. The benchmark
468
consists of 67 family representatives and a database of about 12,000 amino acid sequences. Each family representative is compared with all the database sequences. A recognition quality is evaluated based on the discrimination of the related sequences from the others. An average recognition quality for all 67 sequences assesses a quality of the method. Because we are interested in detecting local similarities with variable alignment length, we have chosen this benchmark, in which query sequences contain only a fragment of the real protein sequence, whereas the rest of the sequence is random. Random parts of the sequences were generated according to the amino acid distribution in the whole database. 3.J Measuring the quality of recognition For each query sequences three measures of the recognition quality were used: (i) an equivalence number, (ii) a separation score (S-score), and (iii) an error score. Equivalence number has been used by Pearson in his benchmark and is the number of false positives ( or the number of false negatives) when the threshold value of the similarity score is chosen to make these numbers equal. In the case of perfect recognition, the equivalence number is zero, in the worst case, it equals to the size of a family. Separation score shows an overall separation between a family and the rest of the database sequences. it is computed as: S-score = «Sf> - )/0.5( O"f+ 0"0)' where and are average similarity scores for the family and the other sequences; O"fand 0"0are average standard deviations of the family and of the other sequences, respectively. The better is the separation between a family and the other proteins, the bigger is the S-score. While S-score characterizes the overall separation, an error score concentrates on a twiJight zone, where related and unrelated sequences are mixed together: E-score = «Zfp> - )/Zeq , where Zeq is a threshold of similarity score corresponding to the equivalence number; Zfp and Zen are sums of simiIarity scores of all false positives and of all false negatives. SimiIarity scores for this formula are expressed in the units of standard deviation (Z-scores). When all the family proteins are separated from the rest of the database, the E-score =0, a bad separation results in the large E-score. In Figure 4 we show two distributions for query sequence TISYO: one for raw and another for normalized similarity scores.
469 20
15 en