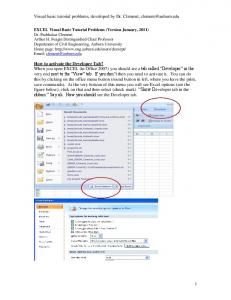
With Excel, they can be found by clicking on “Tools” on the toolbar and ... To
compare the results from the different members of the group we use ANOVA. First
...
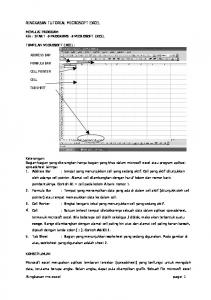
Using Microsoft® Excel to Analyze Data Entering and Formatting Data Open Excel. Set up the spreadsheet page (Sheet 1) so that anyone who reads it will understand the page. For the comparison of pipets: • • • •
Type a title in the cell in the upper lefthand corner, cell A1, for example “Comparison of Pipets Label column A as the data from diluting the dye with the 1 ml pipet Label column B as the data from diluting the dye with the 10 ml pipet Enter the appropriate data (absorbances) in the appropriate columns
Calculating the Mean and Standard Deviation You can calculate the mean and standard deviation for each column using the functions “=average( )” and “=stdev( )”, respectively (Fig 1). • The data for each column goes inside the parentheses and may be entered by leftclicking and dragging the mouse over the values after typing the open parenthesis. • Finish by typing the close parenthesis and hitting the “Enter” button. • Copy the functions (left-click and drag to select, right click and “Copy”) and paste them under the other columns (left-click and drag to select, right click and “Paste”).
Figure 1 The t-test The easiest way to perform statistical analyses with a spreadsheet is to use the built-in functions. With Excel, they can be found by clicking on “Tools” on the toolbar and selecting Data Analysis” (Fig. 2). If the “Data Analysis” selection is not listed it means that the functions haven’t been installed. To install them, you must have access to the installation program, either on CD or through a network.
1
Figure 2 • •
Select “Add-Ins” under the “Tools” menu (Fig. 2). When the “Add-Ins” menu comes up, choose “Analysis ToolPak” (Fig. 3) and click on “OK.”
Figure 3 When you select “Data Analysis” on the “Tools” menu (Fig. 2), the “Data Analysis” menu pops up (Fig. 4). • Scroll down and select “t-test: Two-Sample Assuming Equal Variances.” 2
•
After you click “OK,” the “t-test: Two-Sample Assuming Equal Variances” menu pops up (Fig. 4) and you need to select your data.
Figure 4 •
Click on the red arrow on the right side of the box next to the “Variable 1 Range:” label (Fig. 5).
Figure 5 •
A menu pops up for data input (Fig. 6).
Figure 6
3
•
• • • •
Enter data by dragging the mouse over the values in the appropriate column, for example Column A. Hit “Enter” when done. This will input the values for the absorbencies for dilutions with the 1 ml pipet. Repeat this process, clicking on the arrow for “Variable 2 Range:” and entering the data from dilutions with the 10 ml pipet.. Leave the “Hypothesized Mean Difference” selection blank, check the “Labels” box, and leave “Alpha” at 0.05. Select a cell on the spreadsheet, for example F3, where you want the results of the t-test to be placed. The completed “t-test: Two-Sample Assuming Equal Variances” menu should look similar to Figure 7.
Figure 7
• •
Click on “OK” and the table of information for the t-test should appear, beginning in cell F3. Move the cursor to the right hand border of the Column F label so that the column resize cursor appears (Fig. 8).
4
Figure 8
•
Drag the column to the right until the labels can be read (Fig. 9).
Figure 9 •
Once upon a time, we needed to compare the calculated t value with the critical t value, determined for the alpha value and the degrees of freedom. If the absolute value of the the calculated value is greater than the critical value, the null hypothesis is rejected. This is the case in Figure 9. Nowadays, the ease of calculating an P value allows us to use that to determine whether to reject or accept the null hypothesis. In Figure 9, the P value for the two-tail test is0.024345. Since this is less than our alpha of 0.05, we reject the null hypothesis.
5
ANOVA To compare the results from the different members of the group we use ANOVA. First, set up the spreadsheet so that the data from the 1 ml pipet dilutions are in four adjacent columns. Do the same with the data from the 10 ml pipets. Calculate means and standard deviations, if desired. For ANOVA, use the “Data Analysis” menu under the “Tools” menu. • Click on “Tools” on the toolbar • Select “Data Analysis” (Fig. 2) • Choose “ANOVA: Single Factor” (Fig. 10).
Figure 10
• • • • • •
For “Input Range:” select the data in all four columns, including the headings if you used them. Make sure that “Columns” is selected in “Grouped By:.” Select “Labels in First Row.” “Alpha:” should be 0.05. For “Output Range” select a cell near the data. (In this example, F3.) When complete, the “ANOVA: Single Factor” menu should look like Figure 11. Click “OK” and a table will be generated, starting with Cell F3 (Fig. 12).
6
Figure 11 •
Adjust column widths so that the table looks like Figure 15.
Figure 12 •
Like the t-test, we can compare a calculated value with a critical value, in this case for the F test. Once again, if the magnitude of the absolute value of the calculated value exceeds the critical value, the null hypothesis is rejected. Or, we can simply use the calculated value for P. In Figure 12, the P value is 0.548441, so the null hypothesis is accepted.
The t-test is a powerful and robust test for determining if two populations have different means 7
when samples are independent and random and the measured variable is continuous and normally distributed. ANOVA (analysis of variance) is more appropriate (and less error prone) than running multiple t-tests when there are more than two samples to compare. In ANOVA there are two types of variance to consider: error variance (within-groups variance) and between-groups variance (treatment variance). Since the dilutions being made by each group member are the same, the within-groups variance should be the same. Therefore, any difference between the variances of the measurements would be due to the treatment (in this activity, the individual making the dilution). ANOVA can indicate a difference between the treatments but additional tests are necessary to find which treatments are significantly different. An alpha value of 0.05 was used for all analyses. This is the level usually selected as it offers a good compromise to avoid Type I (rejecting a null hypothesis that is true) or Type II (not rejecting a null hypothesis that is false) errors.
8