the primary visual cortex is such that a much wider area receives afferents from the ... point checkerboard frequencies will be given in terms of alternation rate, ...
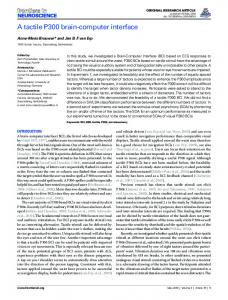
Steady-state VEP-based Brain Computer Interface Control in an Immersive 3-D Gaming Environment E. Lalor1,2, S. P. Kelly1, C. Finucane1, R. Burke2, R. Smith1, R. B. Reilly1, G. McDarby2 1
Electronic and Electrical Engineering, National University of Ireland, Dublin, Ireland 2
Media Lab Europe, Dublin, Ireland.
Abstract: This paper presents an application of an effective EEG-based Brain Computer Interface design as the control mechanism for an immersive 3-D game. The BCI uses the steady-state visual evoked potential (SSVEP) generated in response to phase-reversing checkerboard patterns. Real-time game control and signal processing is facilitated by a combined graphics/DSP/network communications framework. Three methods of feature extraction are compared in a series of offline classification tests. It is found that autoregressive modelling of the EEG trials performs better than more intuitive power spectrum estimation, giving best accuracy of 89%. Two power spectrum estimation methods are also compared during realtime game play. Despite the relatively uncontrolled environment in which the game was played, the performance of the BCI control was robust and relatively consistent across all subjects with 41 of 48 games successfully completed. Performance while playing the game is found to be an improvement on performance in the offline tests, the cause of which is attributed to the goal-driven nature of the game. The potential impact of such an immersive gaming system on the rehabilitation of neurological disorders such as Attention Deficit/Hyperactivity Disorder is discussed. Keywords: EEG, BCI, SSVEP, online classification, overt attention, rehabilitation.
I INTRODUCTION The concept of a Brain Computer Interface (BCI) stems from a need for alternative communication and control options for individuals with severe disabilities (e.g. amyotropic lateral sclerosis), though its potential uses extend to rehabilitation of neurological disorders, brain-state monitoring and gaming [1]. The most practical and widely applicable BCI solutions are those based on non-invasive electroencephalogram (EEG) measurements recorded from the scalp. These generally utilise either reliably electrical responses such as event-related potentials (ERPs) and variations in cortical rhythms [2, 3, 4, 5], or selfregulatory activity such as slow cortical potentials [6]. The former design, being reliant on natural involuntary responses has the advantage of requiring no training, whereas the latter
1
design normally demonstrates effectiveness only after periods of biofeedback training, wherein the subject learns to regulate the relevant activity in a controlled way. Performance of a BCI is normally assessed in terms of information transfer rate, which incorporates both speed and accuracy. One BCI solution that has seen considerable success in optimising this performance measure relies on steady-state visual evoked potentials (SSVEPs), a periodic response elicited by the repetitive presentation of a visual stimulus at a rate of 6-8Hz or more [7]. SSVEPs have been successfully utilised in both above-mentioned BCI designs – gaze direction within a matrix of flickering stimuli is uniquely manifest in the evoked SSVEP through its matched periodicity [8,9], and also the self-regulation of SSVEP amplitude has been reported as feasible with appropriate feedback [10]. The effectiveness of SSVEP-based BCI designs is due to several factors: The signal itself is measurable in as large a population as the transient VEP - very few fail to exhibit this type of response [11]. The task of feature extraction is reduced to simple frequency component extraction, as there is only a certain number of separate target frequencies, usually one for each choice offered in the BCI. Artifacts cause little performance degradation; removal methods in most cases need not be employed, due to the source location of the most serious potential contaminant, ocular artifacts (blinks, eye movements), on the opposite side of the head to the visual cortex over which the SSVEP is measured. Also blink, movement and electrocardiographic artifacts are confined to lower frequencies and so present no problem to accurate feature extraction. The final factor attributable to the success of this BCI strategy is the exceptional robustness of the SSVEP signal. The topographic organisation of the primary visual cortex is such that a much wider area receives afferents from the central or fovial region of the visual field, and thus directing one’s gaze at a desired repetitive stimulus produces an SSVEP response to which all other responses to competing stimuli are small in comparison. The reason why this BCI design has not been actively employed in alternative communication for the disabled is that for successful operation the subject’s ocular motor control must be fully intact to make selections by shifting gaze direction. Given the extensive range of accessibility options available for the disabled, it is only in very extreme cases, such as those where reliable eye movement is impossible, that a communication medium driven by EEG generated by the brain itself is really necessary. Sophisticated camera-based gazetracking apparatus now available, or electrooculographic eye-tracking, renders this type of “dependent BCI” somewhat redundant in its applicability for the disabled. In this paper the authors wish to address the novel application of the SSVEP-based BCI design to a real-time gaming framework. It is proposed that performance on the BCI
2
game detailed below will be sensitive to neurological disorders such as Attention Deficit/Hyperactivity Disorder and thus may aid in its rehabilitation. Presented here is the performance of the real-time BCI game “MindBalance” when played by normal subjects. The design of the MindBalance game was split into two parts. First a preliminary offline analysis was conducted to determine the most favourable signal processing methodology and choose suitable frequencies. Once satisfactory offline analysis results were obtained, the full real-time game was implemented and tested in a separate location.
II PRELIMINARY ANALYSIS Methods A. Subjects Five male subjects, aged between 23 and 27, participated in the preliminary study. All subjects had normal or correct-to-normal vision. B. Experimental Setup Subjects were seated 70cm from a 17” computer monitor. EEG was acquired in a shielded room from two Ag-AgCl scalp electrodes placed at sites O1 and O2, according to the 10-20 International electrode-positioning standard [12], situated over the left and right hemisphere of the primary visual cortex respectively. Skin-electrode junction impedances were maintained below 5k. Each channel, referenced to the right ear lobe on bipolar leads, was amplified (20K), 50Hz line filtered and band-pass filtered over the range 0.01-100Hz by Grass Telefactor P511 rack amplifiers. Assuming that eye movement and blink artifacts did not threaten signal integrity at frequencies of interest, neither horizontal nor vertical EOG signals was recorded. Subjects were monitored visually throughout for continued compliance. Signals were digitised at a sampling frequency of 256Hz. Initial testing of the experimental set-up involved acquiring data from two subjects while gazing at either a circular yellow flicker stimulus on black background or a similarly sized rectangular black and white checkerboard pattern, modulated at several test frequencies between 6Hz and 25Hz. On visual inspection of power spectra it was found that the checkerboard pattern produced a more pronounced SSVEP than a flicker stimulus modulated at the same frequency. Furthermore, it has been found that to elicit an SSVEP signal at a certain frequency a flicker stimulus must be modulated at that frequency, while a checkerboard pattern need only be modulated at half that frequency, as the SSVEP is produced at its rate of phase reversal or alternation rate [13]. This is an important consideration when using a standard monitor with refresh rate of 100Hz. Hence checkerboard
3
patterns were chosen as stimuli in the following preliminary tests and BCI game. From this point checkerboard frequencies will be given in terms of alternation rate, equivalent to the frequency of the SSVEP produced. 25 seconds of eyes-closed data were first acquired for each subject to accurately locate alpha frequency. Testing then proceeded with several 25-second trials during which the subject viewed a full screen checkerboard pattern at frequencies between 6Hz and 25Hz. Power spectra for these data were inspected and two strong SSVEP frequencies were selected. The subject then underwent 25-second trials in which he viewed each one of two bilateral checkerboard patterns phase-reversing at the two selected frequencies and this was repeated with positions reversed, giving a total of 4 trials. Each 4x4 checkerboard pattern’s medial edge was situated 4.9° bilateral to a central cross, centered on the horizontal meridian, and subtended a visual angle of 6.5° vertically and 7.2° horizontally. These dimensions were determined empirically. C. Feature Extraction Three feature extraction methods were employed for comparison in the preliminary data. Each was aimed at utilising the separable aspects of the SSVEP signals. For all methods, each 25-second trial was divided into approximately 50 overlapping segments, each of which counts as a single case for which the feature(s) is derived. Both 1-second and 2-second segments were used for comparison, with a view to assessing speed achievable by using each method in real time. Method 1: Squared 4-s FFT In this method each one- or two-second segment was zero-padded to 1024 samples (4s), and the Fast Fourier Transform (FFT) was calculated and squared, giving a measure equivalent to Welsch’s power spectral density estimate. A single feature was extracted for each segment:
X ( f 1) , F1(n) = log n X n ( f 2) where
X n = mean 2 (FFT ( x n (t ) ) O1 , FFT ( x n (t ) ) O 2 ) , i.e. the square of the FFT averaged over electrode sites O1 and O2, of the nth segment
x n (t ) , and f1 and f2 are the chosen checkerboard frequencies. Method 2: FFT of Autocorrelation
4
This method is equivalent to method 1 in that it also corresponds to calculating a PSD estimate. In this case, the autocorrelation function is calculated for each segment followed by the FFT:
Y ( f 1) , F 2(n) = log n Yn ( f 2) where
(
( )
Yn = mean FFT R xx
n
O1
( ) )
, FFT R xx
n
O2
and n
R xx (t ) = E{x n (t 0 ) x n (t 0 − t )} , the autocorrelation function of the nth segment x n (t ) . This method of PSD estimation is more resilient to noise due to the fact that the autocorrelation of white noise is zero at all non-zero latencies. Method 3: Autoregressive model parameters In this method each segment is fitted with an Autoregressive (AR) model. This all-pole model lends itself well to producing the dominant frequencies occurring in the EEG [14]. The AR model can be intuitively rephrased in the frequency domain as a white noise source driving a spectral shaping network, as illustrated in Figure 1.
n(t)
A-1(z)
y(t)
Figure 1: AR model In this case the coefficients a1, a2, … of the AR model are used as features. A model order of 5 was empirically chosen in order to sufficiently fit frequencies of interest in the time series while maintaining low complexity The AR parameters were calculated by solving the YuleWalker equations [14].
D. Classification Linear discriminants were used as the classifier model for this study, providing a parametric approximation to Bayes’ rule [15]. In the case of feature extraction methods 1 and 2 this corresponds to calculating a threshold in one dimension, while for method 3 the five-dimensional feature space was partitioned into the different classes using a set of hyper-planes. Optimisation of the linear discriminant model is 5
achieved through direct calculation and is very efficient thus lending itself well to real-time applications. Performance of the LDA classifier was assessed on the preliminary data using 10-fold cross validation [15]. This scheme randomly divides the available data into 10 approximately equal sized, mutually exclusive "folds". For a 10-fold cross validation run, 10 classifiers are trained with a different fold used each time as the testing-set, while the other 9 folds are used for the training data. Cross validation estimates are generally pessimistically biased, as training is performed using a sub-sample of the available data. Results
All subjects during preliminary testing were reported to be fully compliant in following given directions. Analysis of power spectra during full screen checkerboard trials resulted in the selection of 17Hz and 20Hz as the bilateral checkerboard frequencies. These frequencies were employed in each of the four test trials for all subjects. Power spectra for full screen checkerboard trials for a representative subject is shown in figure 2. 1
17Hz 20Hz
0.9
0.8
Normalised PSD
0.7
0.6
0.5
0.4
0.3
0.2
0.1
0 5
6
7
8
9 10 11 12 13 14 15 16 17 18 19 20 21 22 23 24 25 26 27 28 29 30 31 32 33 34 35 36 37 38 39 40 Frequency (Hz)
Figure 2: Power spectra for full screen checkerboard trials at 17 and 20
Hz for subject 1 Note that peaks exist at both the frequency of modulation of each constituent square of the checkerboard (henceforth referred to as the 1st harmonic) and the alternation rate (2nd harmonic). Both the flicker stimulus and checkerboard SSVEP frequency effects described above are exhibited in the spectrum due to the large size of the constituent squares of the full
6
screen checkerboard pattern. As expected, the 2nd harmonic was more dominant once the checkerboards were made smaller such that the pattern as a whole could be viewed in the subjects’ fovial vision. 1 left (20Hz) right (17Hz) 0.9
0.8
Normalised PSD
0.7
0.6
0.5
0.4
0.3
0.2
0.1
5
10
15
20 25 Frequency
30
35
Figure 3: Power spectra for left and right gaze direction for subject 4. The power spectra for left and right gaze direction for a representative subject are shown in figure 3. Each subject’s alpha rhythm caused little contamination of the spectra, being of low amplitude during testing - rapid stimulus presentation results in very little cortical idling in the visual cortex, and short trial length prevents arousal effects known also to affect alpha [16]. The classification accuracy for all five subjects using the three feature extraction methods are listed in tables 1 through 3. Performance was assessed using both 1- and 2second segments, and for methods 1 and 2 the question of whether inclusion (by averaging) of the 1st harmonic in the feature had any effect was addressed. This results in the augmented feature
f1 mean X n ( f 1), X n ( ) 2 F1' (n) = log f 2 mean X n ( f 2), X n ( ) 2 for method 1 and similarly for method 2.
7
Subject 1 Subject 2 Subject 3 Subject 4 Subject 5 Average across subjects
2nd harmonic only 1s window 2s window 88.4% 92.2% 72.2% 79.0% 58.7% 62.0% 75.7% 81.4% 57.0% 54.2% 70.4%
74.4%
1st + 2nd harmonic 1s window 2s window 79.3% 88.2% 70.4% 74.3% 62.4% 69.3% 67.4% 72.9% 52.1% 50.8% 66.3%
71.1%
Table 1: Offline performance for method 1 averaged over two checkerboard configurations.
Subject 1 Subject 2 Subject 3 Subject 4 Subject 5 Average across subjects
2nd harmonic only 1s window 2s window 89.8% 96.1% 71.0% 80.4% 61.7% 65.8% 80.1% 82.3% 59.5% 62.0% 72.4%
77.3%
1st + 2nd harmonic 1s window 2s window 82.9% 89.1% 73.2% 80.8% 62.7% 73.5% 71.9% 78.9% 59.4% 55.0% 70.0%
75.5%
Table 2: Offline performance for method 2 averaged over two checkerboard configurations.
Subject 1 Subject 2 Subject 3 Subject 4 Subject 5 Average across subjects
AR order 5 1s window 2s window 82.7% 94.0% 83.5% 89.7% 71.0% 78.7% 83.3% 89.0% 88.4% 93.9% 81.8%
89.1%
Table 3: Offline performance for method 3 averaged over two checkerboard configurations. For all methods, using 2s segments is shown to perform better than 1s segments. For methods 1 and 2 it was seen that inclusion of the 1st harmonic in the augmented feature in fact degraded performance slightly. Performance of these two methods were comparable, with the more noise-resilient autocorrelation method performing marginally better as expected.
8
Method 3 performed better than all other methods, on average giving an accuracy of 89.1% for 2s segments. Individually, the improvement is most dramatic in subjects 2,3 and especially 5.
III REAL-TIME BCI GAME Methods A. MindBalance – the Game
The object of the MindBalance game is to control the balance of an animated character on a tightrope using only the player’s EEG. A checkerboard is positioned on either side of the character. These are phase-reversed at two selected distinct frequencies, F1 and F2. A game begins with a brief training period. This requires the subject to attend to the left or right checkerboards as indicated by arrows for a period of 15 seconds. This process is repeated three times (Figure 4). During this training the player is given audio feedback in the form of a chirp noise, the pitch of which is linearly related to the decision metric.
Figure 4: The training sequence.
In the game the tightrope walking character, walks towards the participant and stumbles every 1.5-5.0 seconds to one side. The participant must intervene to shift the character’s balance so that it remains stable on the tightrope. To do this, the user must direct his gaze and focus on the checkerboard on the opposite side of the screen to which the character is losing balance (Figure 5). The character’s off-balance animation lasts for 3 seconds. This duration was chosen to give the player time to realise which checkerboard required fixation to elicit the required SSVEPs and help
9
the character regain his balance. At the end of the 3s animation a decision based on the most recent 1 or 2 seconds of EEG is obtained. To allow for better game play a second more pronounced off-balance 3s animation was used in order to give a player a second chance in the case where an incorrect decision was obtained from the EEG. The side to which the character loses balance is also based on the player’s EEG. In fact, it is a function of the time since the last loss of balance and the distance of the EEG feature value from the threshold. This function is such that the character will never walk for more then 5s without losing balance and it is possible through focusing on one of the two checkerboard patterns to determine the side to which this loss of balance will occur. There was also an optional play mode where an EEG feature value within a certain range of the decision threshold, when detected at the end of the offbalance animation, resulted in no decision being taken and the original 3s off-balance animation being simply replayed. This dead-zone was removed during our on-line tests.
Figure 5: The character loses balance during the game
10
B. Signal Processing and the C# Engine.
Figure 6: Flow chart of signal processing stages employed in real-time BCI game
The overall system structure is shown in figure 6. In order to carry out this study, a programming engine and platform was required, capable of rendering detailed 3-D graphics while at the same time processing continuous EEG data to control a sprite within the game. This was accomplished using a combined graphics, signal processing and network communications engine implemented in C#1. One machine is dedicated to the rendering of the 3-D graphics while a second machine was dedicated to the real-time data acquisition and signal processing of the EEG data. This signal processing engine allows the user to select the signal processing functions and parameters as objects and to insert them into a chain of signal processing blocks to perform the required processing. (Figure 7). Whenever a decision on the fate of the animated character is required, a request in the form of a UDP packet is sent over the local area network to the signal processing machine which sends back a decision based on the most recent feature extracted from the EEG.
Figure 7: The C# Signal Processing Interface. 1
Implemented by the Mindgames group at Media Lab Europe
11
C. Interface Equipment of Game Control The set up for the real-time BCI game was similar to that used in the preliminary analysis, the only difference being in the amplification stage in which Biopac biopotential amplifiers were used. The subject was seated in front of a large screen on which a 140x110 cm image was projected. Within the game pictured in figures 4 and 5, each 4x4 Checkerboard pattern’s medial edge was situated 8.5° bilateral to the tightrope, centered on the horizontal meridian and subtended a visual angle of 11.4° vertically and 11.8° horizontally.
D. Subjects and test protocol Six male subjects aged between 24 and 34 participated in the following test procedure to assess performance of the real-time BCI game. All subjects had normal or correct-to-normal vision.
Each subject was asked to play the game eight times. Four of the games were played where the EEG was analysed by the FFT method described above as method 1 for the offline data. In two of these games the decision on the fate of the tightrope walking character was based on a 1s window of EEG data, and in the other two games the decision was based on a 2s window. The other four games were played using EEG analysed by method 2, the autocorrelation followed by FFT method. Again two games used 1s segments of EEG data and two games used 2s segments. On average there were eight trials per game. This varied from game to game as a result of the random number of steps taken by the character between losses of balance and the fact that in seven of the 48 games played two consecutive errors occurred resulting in the character falling from the tightrope and the end of the game. Results
Tables 4 and 5 list the percentage of correct decisions resulting in the desired regain of balance on the tightrope. In seven of the 48 games played, two consecutive errors occurred resulting in the character falling from the tightrope, causing the game to end. Three of the six subjects did not allow the character to fall off the tightrope in any of the eight games.
12
Subject 1 Subject 2 Subject 3 Subject 4 Subject 5 Subject 6 Average across subjects
1s window 75.0% 72.7% 75.0% 69.2% 87.5% 100%
2s window 100% 100% 70.6% 100% 78.2% 88.2%
79.9%
89.5%
Table 4: Percentage of correct decisions in real-time game play, using method 1 with 2nd SSVEP harmonic only.
Subject 1 Subject 2 Subject 3 Subject 4 Subject 5 Subject 6 Average across subjects
1s window 87.5% 50.0% 85.7% 85.7% 63.6% 87.5%
2s window 91.7% 58.3% 46.2% 75.0% 100% 92.3%
76.7%
77.3%
Table 5: Percentage of correct decisions in real-time game play, using method 2 with 2nd SSVEP harmonic only.
IV Discussion Phase-reversing checkerboard patterns were found to elicit distinct SSVEP responses and were successfully used to make binary decisions in a Brain Computer Interface-controlled game. Results imply advantages in set-up and signal processing brought by a) using checkerboards rather than flicker stimluli b) using higher stimulus frequencies (17Hz and 20Hz) less contaminable by artifacts, etc. c) using 2s segments - this is specific to the MindBalance game, in which levels of imbalance last for a fixed amount of time. In other cases the speed of the BCI may be compromised. d) using the autocorrelation method of PSD estimation rather than squared FFT. This introduces negligible additional delay in the real-time system. e) using autoregressive model parameters rather than PSD estimation.
13
The advantage brought by AR modelling is particularly interesting in that these features relate less directly to the physiological mechanisms involved. While PSD estimation is the most intuitive method given the SSVEP signal properties, it can be concluded in this study that the AR coefficients, which depend on the overall spectrum of the EEG signals, better discriminates between gaze direction when stimuli are modulated at distinct frequencies. This may suggest effects of foviation on repetitive visual stimuli at frequencies other than those at which the stimuli are set. To test whether this is simply a result of pronounced harmonics in the spectrum, the augmented PSD estimation features were used as detailed above. Increased discriminability afforded by the inclusion of the most prominent additional harmonic is not apparent. Two additional interesting observations were made during both the offline and online testing. Most notably, the two investigators who themselves participated as subjects in the study achieved better performance both in terms of accuracy in the offline analysis and in terms of success in completing the game. This implies that either practice, or a goal-driven approach to stimulus fixation results in a more pronounced visual response. This may be thought of in terms of visual attention. Endogenous modulation of SSVEP response has been reported as possible in relation to both fovial fixated stimuli [10] and covertly attended stimuli in peripheral vision [17]. The improved discriminability of the SSVEP with increased perceived conscious effort may be related to the ability of the subject to focus selective attention on the fixated stimulus, as well as the ability to inhibit early processing of distractors in the peripheral visual field. In post-experiment debriefing, subjects reported that feedback, particularly audio feedback during training, aided in the successful sustained fixation on a particular stimulus, and the inhibition of responses to distractions. Also, in the case of an error causing the character to drop to the second level of imbalance, subjects found it possible to adjust their fixation strategy, most notably through observing the checkerboard as a whole rather than specifically fixating on any individual elements or allowing perception of the phase reversal as a moving pattern. In general, subjects performed better while playing the game than in the off-line tests. This may be due to the greater length of trials in the offline tests, during which habituation to the visual stimuli without any perceived salience becomes an issue. It is also believed that feedback is a major factor in the degree of conscious compliance.
14
V Conclusions and further work Results of the study indicate that successful binary control using Steady State Visual Evoked Potentials is possible in an uncontrolled environment and is resilient to any ill effects potentially incurred by a rich detailed visual environment as in the MindBalance game. This is reinforced by the fact that subjects were allowed to speak and rotate in a swivel chair whilst playing. Observations and subject reports during the study suggest the application of the BCI game in rehabilitation of disorders in which attentional capabilities are impaired. Thus it is expected that successful performance on the game will be sensitive to patient groups such as Attention Deficit/Hyperactivity Disorder (ADHD) and Traumatic Brain Injury (TBI). Further testing will explore this idea. Currently, the authors are implementing and testing the AR methodology in the Realtime BCI game. The authors also propose to extend the results of the preliminary results of this study to covert visual attention, in which subjects direct attention to one of two bilateral stimuli without eye movement.
Acknowledgements We wish to acknowledge Phil McDarby for his assistance in designing the gaming environment. We would also like to thank the subjects who participated in the experimental sessions.
References [1] Wolpaw, J. R., Birbaumer, N., McFarland, D. J., Pfurtscheller, G., and Vaughan, T. M. "BrainComputer Interfaces for Communication and Control." Clinical Neurophysiology, Vol. 113, Iss. 6, pp. 767-791. (2002). [2] Farwell, L. A. and Donchin, E. "Talking off the top of your head: toward a mental prosthesis utilizing event-related brain potentials." Electroencephalography and Clinical Neurophysiology, Vol. 70, Iss. 6, pp. 510-523. (1988). [3] Pfurtscheller, G. and Lopes da Silva, F. H. "Event-related EEG/MEG synchronization and desynchronization: basic principles." Clinical Neurophysiology, Vol. 110, Iss. 11, pp. 1842-1857. (1999). [4] Pfurtscheller, G. and Neuper, C. "Motor imagery and direct brain-computer communication." Proceedings of the IEEE, Vol. 89, Iss. 7, pp. 1123-1134. (2001).
15
[5] Kelly, S., Burke, D., deChazal, P., and Reilly, R. "Parametric Models and spectral analysis for Classification in Brain-Computer Interfaces." Proc of the 14th International Conference on Digital Signal Processing, DSP2002, Vol. 1, pp 307-310, Santorini (2002). [6] Birbaumer, N., Kubler, A., Ghanayim, N., Hinterberger, T., Perelmouter, J., Kaiser, J., Iversen, I., Kotchoubey, B., Neumann, N., and Flor, H. "The thought translation device (TTD) for completely paralyzed patients." Neural Systems and Rehabilitation Engineering, IEEE Transactions on, Vol. 8, No. 2, pp. 190-193. (2000). [7] Müller, M. M., Hillyard, S. "Concurrent recording of steady-state and transient event-related potentials as indices of visual-spatial selective attention." Clinical Neurophysiology, Vol. 111, Iss. 9, pp. 1544-1552 (2000). [8] Sutter, E. E. "The visual evoked response as a communication channel." Proc. of the IEEE / NSF Symp.on Biosensors, pp. 95-100. (1984). [9] Ming, C., Xiaorong, G., Shangkai, G., and Dingfeng, X. "Design and implementation of a braincomputer interface with high transfer rates." Biomedical Engineering, IEEE Transactions on, Vol. 49, No. 10, pp. 1181-1186. (2002). [10] Middendorf, M., McMillan, G. R., Calhoun, G. L., and Jones, K. S. "Brain-computer interfaces based on the steady-state visual-evoked response." Neural Systems and Rehabilitation Engineering, IEEE Transactions on, Vol. 8, No. 2, pp. 211-214. (2000). [11] Misulis, K. E.: “Spehlmann’s Evoked Potential Primer”, Butterworth-Heinemann, MA (1994). [12] American Electroencephalographic Society "Guidelines for Standard Electrode Position Nomenclature", J. Clin. Neurophysiol., 8(2): 200-202, (1991). [13] Burkitt, G. R., Silberstein, R. B., Cadusch, P. J., and Wood, A. W. "Steady-state visual evoked potentials and travelling waves." Clinical Neurophysiology, Vol. 111, Iss. 2, pp. 246-258. (2000). [14] Pardey, J., Roberts, S., and Tarassenko, L. "A review of parametric modelling techniques for EEG analysis." Medical Engineering & Physics, Vol. 18, No. 1, pp. 2-11. (1996). [15] B.D. Ripley. Pattern Recognition and Neural Networks. Cambridge University Press. 1996. [16] Klimesch, W. "EEG alpha and theta oscillations reflect cognitive and memory performance: a review and analysis." Brain Research Reviews, Vol. 29, Iss. 2-3, pp. 169-195. (1999). [17] Morgan, S. T., Hansen, J. C., and Hillyard, S. A. "Selective attention to stimulus location modulates the steady-state visual evoked potential." Proceedings of the National Academy of Sciences, Vol. 93, Iss. 10, pp. 4770-4774. (1996).
16