in string error rate (SER) for digit recognition in the car, and in about 10% relative improvement in word error rate (WER), when applied in conjunction with ...
STEREO-BASED STOCHASTIC MAPPING FOR ROBUST SPEECH RECOGNITION Mohamed Aſfy, Xiaodong Cui, and Yuqing Gao IBM T.J. Watson Research Center 1101 Old Kitchawan Road, Yorktown Heights, NY, 10598 ABSTRACT We present a stochastic mapping technique for robust speech recognition that uses stereo data. The idea is based on building a GMM for the joint distribution of the clean and noisy channels during training and using an iterative compensation algorithm during testing. The proposed mapping was also interpreted as a mixture of linear transforms that are estimated in a special way using stereo data. The proposed method results in 28% relative improvement in string error rate (SER) for digit recognition in the car, and in about 10% relative improvement in word error rate (WER), when applied in conjunction with multi-style training (MST), for large vocabulary English speech recognition. Index Terms: Noise robustness, speech recognition, non-linear mapping, stereo-data. 1. INTRODUCTION Building speech recognition systems that are robust to environmental changes is important, especially when these systems are to be deployed in the ſeld. In this paper we introduce a stochatic mapping algorithm that is built using stereo data, i.e. data that consists of simulataneous recordings of both the clean and noisy speech. We will refer to this mapping as stereo-based stochastic mapping (SSM). While it is generally difſcult to obtain stereo data, it can be relatively easy to collect for certain scenarios, e.g. speech recognition in the car. In some other applications of speech recognition, e.g. our recent work on a speech-to-speech translation system [2], all we have available is a set of noise samples of mismatch situations that will be possibly encountered in ſeld deployment of the system. In these cases stereo-data can also be easily generated by adding the example noise sources to the existing “clean” training data. The basic idea of the algorithm is to stack both the clean and noisy channels to form a large augmented space and to build a statistical model in this new space. We use a Gaussian mixture model (GMM) in this work. During testing, both the observed noisy speech and the augmented statistical model are used to predict the clean speech. This can be viewed as some form of nonlinear mapping between the noisy and clean feature spaces that is learned by the GMM. We point out the relationship between the proposed mapping method and the SPLICE algorithm which uses stereo data [1]. In addition, we show that the mapping effectively results in a mixture of linear feature space transforms commonly known as FMLLR [5]. This is similar in spirit to some recently proposed mixture of linear transforms as in [3, 6]. All these linear transform mixtures, including the proposed method, differ in their details. The resulting mapping can be used on its own, as a front-end to a clean speech model, and also in conjunction with
1424407281/07/$20.00 ©2007 IEEE
multistyle training (MST). Both scenarios will be discussed in the paper. The paper is organized as follows. We formulate the compensation algorithm in Section 2. Experimental results are given in Section 3. We ſrst test several variants of the algorithm and compare it to SPLICE for digit recognition in the car environment. Then we give results when the algorithm is applied in conjunction with multistyle training (MST) for large vocabulary English speech recognition. In both cases the proposed technique shows signiſcant gain over the baseline. Finally we summarize our ſndings in Section 4. 2. ALGORITHM FORMULATION Assume we have a set of stereo data {(xi , yi )}, where x is the clean (matched) feature representation of speech, and y is the corresponding noisy (mismatched) feature representation. Let N be the number of these feature vectors, i.e 1 ≤ i ≤ N . The data itself is an M-dimensional vector which corresponds to any reasonable parametrization of the speech, e.g. cepstrum coefſcients. In a direct extension the y can be viewed as a concatenation of several noisy speech vectors that are used to predict the clean speech. Deſne z ≡ (x, y) as the concatenation of the two channels. The ſrst step in constructing the mapping is training the joint probability model for p(z). We use Gaussian mixtures for this purpose, and hence write K
p(z) =
ck N (z; μz,k , Σzz,k )
(1)
k=1
where K is the number of mixture components, ck , μz,k , and Σzz,k , are the mixture weights, means, and covariances of each component, respectively. In the most general case where Ln noisy vectors are used to predict Lc clean vectors, and the original parameter space is M-dimensional, z will be of size M (Lc + Ln ), and accordingly the mean μz will be of dimension M (Lc + Ln ) and the covariance Σzz will be of size M (Lc +Ln )×M (Lc +Ln ). Also both the mean and covariance can be partitioned as μz,k = Σzz,k =
�
� � μx,k μy,k
Σxx,k Σyx,k
Σxy,k Σyy,k
�
(2) (3)
where subscripts x and y indicate the clean and noisy speech respectively. The mixture model in Equation (1) can be estimated in a classical way using the expectation-maximization (EM) algorithm. Once
IV 377
ICASSP 2007
this model is constructed it can be used during testing to estimate the clean speech given the noisy observations. This can be formulated as: x ˆ = argmax p(x|y) (4) x
Now the estimation in Equation (4) can be further decomposed as x ˆ
= =
argmax p(x|y) = argmax x
x
argmax
p(x, k|y) k
k
p(k|y)p(x|k, y)
x
SPLICE[1] uses a similar GMM setting but only estimates component dependent biases for the compensation. From this point of view, SPLICE assumes perfect correlation between the clean and noisy channels. Another interesting special case exists that relates the proposed mapping to linear feature space transforms as FMLLR [5]. The mapping in Equations (7)-(9) can be simpliſed as x ˆ= p(k|¯ x, y)(Ak y + bk ) (11)
(5)
k
C=
The problem of estimating x in Equation (5) looks like a mixture estimation problem. Hence, we will iteratively optimize an EM objective function given by x ˆ
=
argmax
=
argmax
≡ ≡
x
x
x
p(k|¯ x, y)[log p(k|y) + log p(x|k, y)] k
argmax x
−1 2
�
(6)
where x ¯ is the value of x from previous iteration, and x|y is used to indicate the statistics of the conditional distribution p(x|y). By differentiating Equation (6) with respect to x, setting the resulting derivative to zero, and solving for x, we arrive at the clean speech estimate given by p(k|¯ x, y)Σ−1 ˆ= x|y,k x k
p(k|¯ x, y)Σ−1 x|y,k μx|y,k
(7)
k
which is basically a solution of a linear system of equations. p(k|¯ x, y) are the usual posterior probabilities that can be calculated using the original mixture model and Bayes rule, and the conditional statistics are known to be μx|y,k = μx,k + Σxy,k Σ−1 yy,k (y − μy,k )
(8)
Σx|y,k = Σxx,k − Σxy,k Σ−1 yy,k Σyx,k
(9)
Both can be calculated from the joint distribution p(z) using the partitioning in Equations (2) and (3). A reasonable initialization is to set x ¯ = y, i.e. initialize the clean speech with the noisy speech. An interesting special case arises when x is a scalar. This could correspond to using the ith noisy coefſcient to predict the ith clean coefſcient or alternatively using a time window around the ith noisy coefſcient to predict the ith clean coefſcient. In this case, the solution of the linear system in Equation (7) reduces to the following simple calculation for every vector dimension.
�
�
k
2 p(k|¯ x, y)μx|y,k /σx|y,k 2 x, y)/σx|y,k k p(k|¯
�
(12) (13) (14)
3. EXPERIMENTAL EVALUATION
p(k|¯ x, y) log |Σx|y,k |+ k
(x − μx|y,k )T Σ−1 x|y,k (x − μx|y,k )
x ˆ=
−1 ek = Σ−1 x|y,k μx,k − Σyy,k Σxy,k μy,k
p(k|¯ x, y) log p(x|k, y)
�
�
k
When the dimensions of x and y equal the original parameter space dimension the mapping in Equation (11) is a mixture of linear FMLLR transforms weighted by component posteriors.
k
k
�
−1
p(k|¯ x, y)Σ−1 x|y,k
−1 Dk = Σ−1 x|y,k Σyy,k Σxy,k
p(k|¯ x, y) log p(k|y)p(x|k, y)
argmax
�
where Ak = CDk , bk = Cek , and
(10)
2 is used instead of Σx|y,k to indicate that it is a scalar. where σx|y,k This simpliſcation will be used in the experiments.
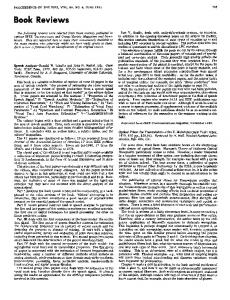
In the ſrst part of this section we give results for digit recognition in the car environment and compare the proposed method to SPLICE. In the second part, we provide results when the proposed technique is applied in conjunction with multi-style training (MST) for large vocabulary English speech recognition. 3.1. Experiments for digit recognition in the car The proposed method was tested for digit recognition in the car. The database called CARVUI has two channels simultaneously collected using close talking (CT) and hands-free (HF) microphones. The data was collected in Bell Labs. The evaluation is limited to the digit part of the database. There are about 7000 utterances for training and 800 utterances for testing. Twelve (10 digits+oh+sil) HMMs are built. Each model has six states and 8 Gaussians/state. The feature space has 39 dimensions consisting of 13 cepstrum coefſcients including C0 and their ſrst and second derivatives. Cepstral mean normalization is applied during training and testing. The recognition network is a simple loop grammar over the models. Training and recognition is done using HTK. A baseline set of results for this task are given in Table 1. Condition clean/clean clean/noisy noisy/noisy clean/VTS
SER 12.9 31.7 16.8 28.6
Table 1: Baseline sentence error rate (SER) results (in %) of the close-talking (CT) microphone data and Hands-Free (HF) data. The ſrst three lines refer to train/test conditions where the clean refers to the CT and noisy to the HF. The fourth line corresponds to using clean training and noisy test data that is compensated using conventional ſrst order vector Taylor series (VTS) [4]. It can be observed from the table that the perofrmance is clearly
IV 378
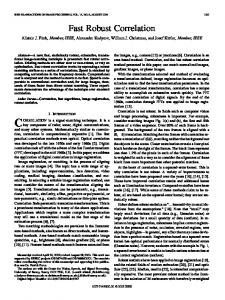
effected, as expected, by the addition of noise. Using noisy data for training improves the result considerably but not to the level of clean speech performance. VTS gives a slight improvement over the baseline. The mapping is applied to the MFCC coefſcients before CMN. After applying the compensation, CMN is performed followed by calculating the delta and delta-delta. Two methods were tested for constructing the mapping. In the ſrst, a map is constructed between the same MFCC coefſcient for the clean and noisy channels. In the second, a time window, including the current frame and its left and right contexts, around the ith MFCC noisy coefſcient is used to calculate the ith clean MFCC coefſcient. We tested windows of size three and ſve respectively. Thus we have mappings of dimensions 1 × 1, 3 × 1, and 5 × 1 for each cepstral dimension. These mappings are calculated according to Equation (10). In all cases, the joint Gaussian mixture model p(z) is initialized by building a codebook on the stacked cepstrum vectors, i.e. by concatenation of the cepstra of the clean and noisy speech. This is followed by running three iterations of EM training. Similar initialization and training setup is also used for SPLICE. Only one iteration of the compensation algorithm is applied during testing. It was found in initial experiments that more iterations improve the likelihood, as measured by the mapping GMM, but slightly increase the WER. In the ſrst set of experiments we compare between SPLICE and SSM without a time window, referred to as SSM-1, for different GMM sizes. These results are shown in Table 2. It can be observed that the proposed mapping outperforms SPLICE for all GMM sizes with the difference decreasing with increasing the GMM size. This makes sense because with increasing the number of Gaussian components, and accordingly the biases used in SPLICE, we can theoretically approximate any type of mismatch. Both methods are considerably better than the VTS result in the last row of Table 1
SPLICE SSM-1
16 27.0 24.5
64 26.2 24.5
256 25.5 24.0
Table 2: Sentence error rate results (in %) of Hands-Free (HF) data using the proposed mapping (SSM-1) and SPLICE for different GMM sizes. Finally Table 3 compares the SSM with and without the time window. We test windows of size 3 and 5. The size of the GMM used is 256. Using a time window gives an improvement over the baseline SSM with a slight cost during runtime. These results are not given for SPLICE because using biases requires that both the input and output spaces have the same dimensions, while the proposed mapping can be also viewed as a projection. The best SSM conſguration, namely SSM-3, results in about 28% relative reduction in SER over the uncompensated baseline. 3.2. Experiments for large vocabulary speech recognition In this set of experiments the proposed mapping is applied in conjunction with MST for English large vocabulary speech recognition. The reason for using the technique with MST, rather than with the clean speech model, is that MST brings considerable improvement in performance in our experiments. Hence, we would
SSM-1 SSM-3 SSM-5
SER 24.0 22.8 23.0
Table 3: Sentence error rate results (in %) of Hands-Free (HF) data using three different conſgurations of the proposed mapping (SSM) for 256 GMM size.
like to explore the potential of the proposed method to obtain further improvements on top of MST. This is in the same spirit of using speaker-adaptive training (SAT) scheme, where some adaptation or compensation method is used in both training and decoding. The speech recognition system is based on the IBM Via-Voice product engine. The feature space is formed as follows. First, 24 dimensional mel frequency cepstrum coefſcients (MFCC) including energy are calculated. The MFCC features are then mean and energy normalized. 9 vectors are stacked leading to a 216dimensional parameter space. The feature space is ſnally reduced to 40 dimensions using a combination of linear discriminant analysis (LDA), and maximum likelihood linear transformation (MLLT). This 40-dimensional space is used for both training and decoding. The acoustic model uses Gaussian mixture models associated to the leaves of a decision tree. The tree clustering is done by asking questions about phoneme context. The phoneme inventory has 54 phonemes for American English, and each phoneme is represented by 3 states. After aligning feature vectors to leaves, the GMMs for the leaves are ſrst initialized, and then they are reſned by running four iterations of the FB algorithm. Rank distributions for each leaf are calculated using the resulting Gaussian mixture models. These discrete rank distributions are used to calculate acoustic scores in the decoding stage. The search uses a stack decoder which employs the rank distributions and trigram language models to ſnd the most likely spoken utterance. For clean acoustic model, the training data have about 150 hours of speech which leads to about 43K Gaussians. Testing using the clean model is referred to as the clean results. The multistyle data are generated by adding noise to the clean data. We tried several types of noise. In the results below we use “humvee+tank +babble” noise at different signal-to-noise ratios. Samples of the “humvee”, “tank” and “babble” noise are added at random to different parts of the utterance. This is in anticipation for the kind of noise that the system might encounter in ſeld deployment. For the multi-style training, the training data have about 330 hours of speech and this results in about 55K Gaussians in the model. Testing using the MST model is referred to as MST results. The models are gender dependent, i.e. separate male and female models. Since in our test set there are far more male speakers than female speakers, the experimental results reported below were obtained on male speakers evaluated using male models. The ſrst test set uses test data collected in the context of the Babylon project. It has 5 male speakers with 150 utterances from each. Therefore, there are 750 utterances in total for each test condition (clean, 15dB and 10dB). For simplicity, we considered building the mapping between the same coefſcient in the clean and noisy channels, i.e. no time window is considered as discussed in the previous subsection. Mappings are initialized by binary splitting of lower order maps, and
IV 379
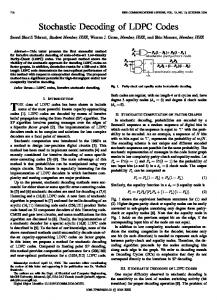
an initial map of size 256 was initialized by picking some vectors randomly from the training data. The multi-style data are also used as stereo data in training the mapping. A map is built for each noise condition and is used to compensate the training data used in MST training. This is acceptable during training because the condition is known. Training data compensated using the mapping are pooled and used to build another model the same way as above. During testing the SNR-speciſc map is used. This might not be a realistic assumption, because the true condition is not supposed to be known during testing. However, we believe that using an environment classiſer will be able to identify the condition with sufſcient accuracy. To assess this point we used a GMM based environment classiſer in the results of Table 5. This scenario is referred to as the MST+SSM. Different mapping sizes are used and are indicated between brackets in Table 4. Condition Clean MST MST+SSM(512) MST+SSM(1024) MST+SSM(2048)
Clean 7.64 4.07 3.71 3.80 3.96
15 dB 10.33 5.96 5.92 5.48 5.39
10 dB 31.47 14.06 13.88 12.74 13.45
The results in Table 4 indicate that SSM brings considerable improvement over MST even in the clean speech condition. A 1K map looks like a good compromise between size and WER improvement. Maps in Table 4 are constructed in the cepstrum domain, i.e. between the MFCC coefſcients of clean and noisy speech. In Table 5 we compare between 1K maps built in both cepstrum and after LDA+MLLT transforms. In the table the number between brackets refers to the size of the feature space. Building maps for the ſnal feature space (after LDA and MLLT) looks to be slightly better than the original cepstral space. In Table 5, We also tested using a GMM based environment classiſer to select the required map during testing. This result is shown in the third row. The performance yielded this way is almost the same as that of assuming we know the environmental mapping for each utterance. Clean 3.80 3.57 3.57
15 dB 5.48 4.76 4.75
Condition Clean Model MST MST+SSM(40)
Clean 13.96 11.50 11.64
15 dB 29.45 22.39 18.95
10 dB 38.30 28.92 24.63
Table 6: Word error rate (WER) for SSM constructed after LDA+MLLT transform for the same conditions of Table 4 but for a new more difſcult test set. 4. SUMMARY AND EXTENSIONS
Table 4: Word error rate (WER) for different testing scenarios including the Clean model, MST model, and SSM of different size applied in conjunction with MST.
Condition MST+SSM(24) MST+SSM(40) MST+SSM(40)+Detect.
It has considerably higher difſculty than the above Babylon test set which manifests in a signiſcantly higher WER. The trend of the results on the transtac data in Table 6 follows that of the previous experiments on the Babylon data. In particular, a map of size 1024 that is constructed in the ſnal 40dimensional feature space after LDA and MLLT results in considerable improvements over MST.
10 dB 12.74 12.79 12.85
Table 5: Word error rate (WER) for SSM constructed for cepstrum and after LDA+MLLT transform for the same conditions of Table 4. In the third row, “Detect” means using a GMM based classiſer to select environment during testing. Finally we give the results for a new test set collected in the transtac program. This test set has 11 male speakers and 2070 utterances in total for each test condition (clean, 15dB and 10dB).
We have presented a stochastic mapping technique for robust speech recognition that uses stereo data. The idea is based on building a GMM for the joint distribution of the clean and noisy channels during training and using an iterative compensation algorithm during testing. The proposed mapping was also interpreted as a mixture of linear transforms that are estimated in a special way using stereo data. It was found that the proposed method provides signiſcant improvement in performance when tested with the clean speech model for speech recognition in the car and in conjunction with multi-style training (MST) for large vocabulary speech recognition. One interesting extension of the proposed method, based on the view that the map is a GMM, is adapting the map using linear transformations and hence obtaining ſner transformation capability than the static map that is built from training data. 5. REFERENCES [1] J. Droppo, L. Deng, and A. Acero, ”Evaluation of the SPLICE Algorithm on the AURORA 2 Database,” in Proc. Eurospeech’01, Aalborg, Denmark, September, 2001. [2] Y. Gao, B. Zhou, L. Gu, R. Sarikaya, H.-K. Kuo. A.-V.I. Rosti, M. Aſfy, W. Zhu, ”IBM MASTOR: Multilingual automatic speech-to-speech translator,” Proc. ICASSP’06, Tolouse, France, 2006. [3] Q. Huo, and D. Zhu, ”A maximum likelihood training approach to irrelevant variability compensation based on piecewise linear transformations,” in Proc. Interspeech’06, Pittsburgh, Pennsylvania, September, 2006. [4] P.J. Moreno, B. Raj, and R.M. Stern, “A vector Taylor series approach for environment-independent speech recognition,” in Proc. ICASSP, Atlanta, GA, May 1996, pp.733-736. [5] G. Saon, G. Zweig, and M. Padmanabhan, ”Linear feature space projections for speaker adaptation,” in Proc. ICASSP’01, Salt lake City,Utah, April, 2001. [6] B. Zhang, S. Matsoukas, R. Scwartz, ”Recent progress on the discriminative region-dependent transform for speech feature extraction,” in Proc. Interspeech’06, Pittsburgh, Pennsylvania, September, 2006.
IV 380