has the use of reusable industry-textiles increased steadily. More than one ... dropped stitches, press-offs or other defects as they are defined by the textile in- ..... Zeng, K., Wu, N., Wang, L., Yen, K.K.: Local visual feature detection and descrip-.
Stereo-Image Normalization of Voluminous Objects improves Textile Defect Recognition Dirk Siegmund, Arjan Kuijper, and Andreas Braun Fraunhofer Institute for Computer Graphics Research (IGD) Fraunhoferstrasse 5, 64283 Darmstadt, Germany {dirk.siegmund,arjan.kuijper,andreas.braun}@igd.fraunhofer.de
Abstract. The visual detection of defects in textiles is an important application in the textile industry. Existing systems require textiles to be spread flat so they appear as 2D surfaces, in order to detect defects. In contrast, we show classification of textiles and textile feature extraction methods, which can be used when textiles are in inhomogeneous, voluminous shape. We present a novel approach on image normalization to be used in stain-defect recognition. The acquired database consist of images of piles of textiles, taken using stereo vision. The results show that a simple classifier using normalized images outperforms other approaches using machine learning in classification accuracy.
1
Introduction
Under the inuence of increasing environmental awareness and cost reduction, has the use of reusable industry-textiles increased steadily. More than one billion cleaning textiles in Europe get nowadays leased and reused per year. Although, quality assurance of used textiles is still a mostly manually operated task. Compared to humans, automated systems can have several advantages, such as lower costs reliability and constancy. A lower price for cleaning may also encourage more companies to increasingly start using reusable textiles. If applied on clothing it can contribute to fulll requirements like they exist in case of reective clothing. Automatic fabric defect detection has therefore become one of the most relevant areas in this domain. Recent work in the field of textile inspection deals with continuous 2D textures. This is reasoned because manufacturer inspect their fabric mostly in production and usually during the furling process. Compared to that, cleaning industries handle textiles individually in an assembly-line workow. Due to the sowing patterns and the high ow rates of textiles in quality assurance systems, an automatized mechanism has not yet been invented, though. In this paper we thus focus on an inspection of stains in a pile-like arrangement, where every item is dealt with separately on an assemblyline. The uneven surface, varying colors and weaving of different textile fibers are some of the challenges in this task. Textiles differ furthermore in the composition of fibers which includes cotton, linen, polyester or compositions. Most previous research in fabric classification was carried out on un-spread fabrics. The results can therefore be used as a baseline for further investigation. Textiles can show
2
Lecture Notes in Computer Science: Authors’ Instructions
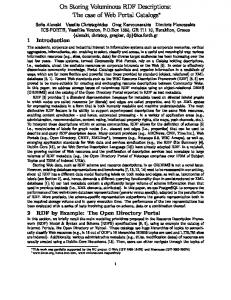
different kinds of defects like stains, bonding, silicon relics, holes, enclosures, dropped stitches, press-offs or other defects as they are defined by the textile industry [1]. Because some textiles may have been washed more than one time, the fiber can also change its color and appearance (see Figure 5). The voluminous shape, folds, edges and borders are some of the diculties machine vision need to find a solution for. Especially folds, overlapping borders and ambient occlusion could have an negative impact on correct detection of stain defects using standard methods. The three dimensional (inhomogeneous) shapes of textiles tend to show fibers as nearer or further away. There are furthermore differences in stains between onlaying and absorbed color defects as shown in Figure 1b and c. Shadows caused by folds and overlapping borders show different gradients but have a certain similarity to stains as shown in Figure 1a.
Fig. 1: (a) Shadow (b) Absorbed stain (c) On-laying stain.
In view of addressing the mentioned problems of the voluminous shape, we present in chapter 3 a stereoscopic normalization approach that is evaluated in a recognition pipeline of stain defects. As we incorporate processing of CMOSsensor images with depth channel information, shades and fold can be excluded from that texture. This approach is invariant to different fiber-weavings and fulfills the requirements of compatibility with different uniform colored textiles. As major advantage, the computational costs are low. In our experiments in Section 4 we implemented and integrated it with several object recognition techniques used in that field. The effectiveness of our method is shown in tests given in Section 5.
2
Related Work
A lot of research effort was spent on fabric web inspection of spread fabrics, carried out during manufacturing process. Most of them focused on defect detection and classification. Textiles can be categorized into uniform and different kinds of textured materials (uniform, random or patterned)[2]. Mishra et al. [3] distinguishes woven, knitted and dyeing/finishing defects which occur during spooning or weaving. For detection of defects on uniform textured fabrics, three defect-detection techniques exit: statistical, spectral and model-based [4]. Neural Networks (NN) AdaBoost [5] and Support Vector Machines (SVM)[6] are notable machine learning techniques that were used in a number of articles is
Title Suppressed Due to Excessive Length
3
that field. Some approaches on flat, and spread-out 2D surface achieve success rates in fabric defects detection higher than 90% [4, 7, 8]. Compared to that, humans achieve detection rates of only 60-75% [9]. Supervised learning strategies achieved a good performance using a counter-propagation NN, trained by a resilient back-propagation algorithm [10]. As several NN suffer from a high sensibility and require a lot of training image samples, we decided to use other machine learning techniques. In the work of Sun and Zhou [11], a threshold segmentation method was used to recognize defects in the fabric. An adoption of image-based features recognized oil stains and holes. The classification of the fabric defects was based on local features and training. In case of un-spread (inhomogeneous) textile classification, Siegmund et Al.[12] proposed a textile fiber classification system using LBP-features and local-interest points. They evaluated the use of a pre-selection of image patches in order to reduce computational costs in the textile classification using SVM and AdaBoost. A problem which occurs in fabric classification is shadow, which impairs the classification quality. A normalization technique using color information to classify the physical nature of edges in images was presented in [13]. Parameter-free edge classifier for shadow-geometry can be calculated but hardly differentiates between stains and shadows. Kumar assumed in his work [2] that the image quality is highly affected by the type and level of illumination in industrial textile inspection. A comprehensive study of various lighting schemes for automated visual inspection was carried out in [14]. Their results on elimination of shadow and glare effects using back-lighting inuenced the setting of the capturing environment in this work.
3
Normalization Approach using Stereo-Vision
As discussed in the previous sections, competitive methods perform well on homogenous (spreaded-out) fabric, but lack in case of shadows caused by ambient occlusion, which look similar to stains. We propose a novel approach using a disparity map image for finding and normalizing these areas. It contains 1. the calculation of the disparity-map (see Section 3).1, 2. the recognition of folds (see Section 3.2), 3. the normalization of shadow around folds in these areas (see Section 3.3), 4. the definition of the fiber mean color (see Section 3.4) and 5. the shadow classification and normalization (see Section 3.5). 3.1
Calculation of Disparity Maps
A disparity map contains depth information from two dimensional images. Stereo geometric images without radial and tangential distortions on the same camera scan-lines with corresponding epipolar lines were used to create a disparity map. The intrinsic and extrinsic parameters were defined by using a calibration pattern and basic geometrical equations. The disparity d is calculated as follows: d=
f ·b = |x1 − x2 | Z
(1)
4
Lecture Notes in Computer Science: Authors’ Instructions
Fig. 2: (a) Disparity map (b) Background Mask.
x1 und x2 are points on the image plane corresponding to a scene point in 3D, b is the baseline (distance) of the cameras, Z is the depth of a point and f is the focal length of the cameras. Equation 1 shows that disparity values are inverse proportional to the depth of a point Z. The far points have low disparity and the close points have a high disparity. Furthermore, the disparity is proportional to the baseline b. A larger baseline results in a higher disparity. The image resolution used, allowed sufficient accurate disparity measurements. For the calculation of the disparity map, we use the non-parametric rank transform [15] and semi-global matching [15] was also used. These stereo matching methods outperformed local methods in terms of disparity map quality. We used simple median filtering to remove salt-and-pepper noise from the disparity map images.
3.2
Fold Recognition
The disparity map and the corresponding rectified image were used in the following process (see Figures 5 and 2a). We segmented the background using the chroma-keying method on the rectified image for masking. The morphological operators erosion and dilation were used to exclude smaller artifacts in the background from the foreground. The foreground and background separating mask was applied on the disparity image.
Fig. 3: Pipeline showing stain recognition and shadow reduction.
Title Suppressed Due to Excessive Length
5
Folds are the only source of shadow in the image but not all folds can be seen as edges on the disparity map image. In deep and wide valley like folds (see Figure 3C) of piled fabric inparticular, the shadow size is difficult to estimate. Some shadows also occur on fluent gradients along heights (see Figure 3C). Edge detectors like Canny and Sobel are therefore not sufficient to detect shadow reliably. Other approaches discussed in literature either require a 3D mesh for shadow simulation or are too general to be applied on disparity maps. Instead the following method based on color quantization is proposed to detect shadowed folds in disparity maps. K-means clustering was used to reduce the number of colors in the image. Following the approach of Arthur and Vassilvitskii [16], centroid values were used for each color channel. These were applied to all pixels of a reshaped image array of Mx3 size (M = # of pixels). After reshaping it back to the shape of the original image, that resulting image had a specified number of colors. Experiments showed that the transitions of five colors within the defined range of false-colors (and their corresponding disparities) are highlighting edges with folds more accurately than by applying common edge detectors. To identify transitions that do not result in shadows: a) Their corresponding color in the rectified image was compared to the most common color of the textile (which is assumed to be not a defect) using the invariant color model c1c2c3 [17] which has shown good results in shadow identification [18]. b) The difference in altitude within a certain region along a transition was defined and used for thresholding.
3.3
Normalization of Shadow around Folds
The clustered disparity map A (see Figure 3A) is used to detect edges by applying the Canny edge detector on the color clustered disparity map. Borders in the resulting binary image B (see Figure 3B) have a line width of 1 pixel. The outer contour edge of the textile was removed from B by calculating and subtracting the bit-wise conjunction of the inverted background mask (see Figure 2b). Image B containing the remaining edges of the disparity map was used as indicator of folds two times: a) To define the mean color of the fiber by using B in pre-processing. b) To verify if regions along folds show shadow. 3.4
Definition of the fiber mean color
For the definition of the mean fiber color representative, areas of the image need to be found and analyzed. Shadow and other defects interfere with the calculation of the mean fiber color. To reduce the negative impact of these, edges in the disparity map were used to exclude these areas extensively. Morphological
6
Lecture Notes in Computer Science: Authors’ Instructions
operator dilate with a rectangle as structuring element and a factor of 12 was used to broaden the line in the binary image (see Figure 3B). The pixels with positive color values in B were removed in the corresponding rectified image (see Figure 3C) by using inverted bit-wise conjunction (bit-wise and) between B and the rectified image. Thus, the resulting image does not contain any edges. Then on that image k-mean color quantization was used to define the color which pccured most often δ. It is assumed that the color value δ is the non defect color of the fabric.
3.5
Shadow Classification
In order to verify if regions along folds show shadow, image B gets transformed into a vector of coordinates using topological structure analysis. By following the coordinates of the lines stepwise, square bounding boxes representing the region of interest r (see Figure 3A-C) with side length of l were created using the line coordinate as the centerpoint. The coordinates of the line within r were stored in a vector v.
Fig. 4: E: Result of Shadow-Normalization, F: Result of Color-Range Threshold, b1 -b4 : Pipeline to verify that a ROI shows a certain amount of Depth and Darkness in order to classify it as Shadow.
The line coordinates v were then used to extract Image c1 from the rectified image (see Figure 4c1 ). The color α of the image c1 was compared with the previously calculated color δ that occurred most often in the image. The deviation between the two colors needed to be higher than a threshold θ in order to classify C1 a shadow. α < (δ+θ)
(2)
The difference in altitude within the region of interest r of the fabric is a second requirement for shadow. The corresponding regions of r were extracted from B into a new matrice b1 (see Figure 4b1 ). On this resulting binary image, the morphological operation dilation with a rectangle as a structure element and a factor of 3 was applied (see Figure 4b2 ). Then the image was inverted bit-wise
Title Suppressed Due to Excessive Length
7
so that two areas with positive binary values arose (illustrated in white color shwon in Figure 4b3 ). These two areas represent both sides across a fold. The coordinates of the two areas of binary value 1 were now individually stored as vectors a1 and a2 . The inverted edge mask image b3 was then applied via the ’bitwise-and’ operation on the corresponding region in the unclustered disparity map (see Figure 4d1 ). The difference between the mean color value of a1 and a2 η (using the H channel of the HSV color space) represent the difference in altitude between both sides across the edge (see Figure 4b4 ). X X k a1 a2 k < η (3) i
i
Experiments showed that η higher than 10 is adequate. In order to threshold stain defects in the rectified image, image C was converted to gray-scale. The morphological operator dilate with a rectangle as structuring element and a factor of 12 were used to stretch the positive values in the binary image B. Positive values were then replaced by the mean color α and used as mask on image C where pixel color values of B are 6= 0 (see Figure 4E).
4
Experiments
We tested our novel approach on an image database of woven cotton textiles and evaluated through our database with methods used in the state of the art.
Fig. 5: (a) Textile after first washing (b) Used textile with stains.
4.1
Capturing Environment and Database
In the image acquisition a whitebox with homogeneous illumination was used to guarantee a controlled image capturing process with reduced formation of shades. For image recording, two synchronized CMOS color cameras with a CMOS 1/1.8” sensor and a resolution of 1280 x 1003 pixels were used. The database contains 2x606 images of 174 different textiles with and without varying
8
Lecture Notes in Computer Science: Authors’ Instructions
defects. Non-overlapping patches of images were used to reduce the complexity of the analyzed pattern. These textile patterns contained different characteristics such as holes and stains and texture properties like: shadows, different kinds of edges, cuts, open ends, folds etc.. The examined textiles were in clean and dry, but used condition, therefore fibers show different levels of brightness (see Figure 5). Patches belonging to the background were rejected using their entropy value. Every patch was labeled manually by assigning them to the class stain or other. Images were captured from a top-view perspective, therefore, some stains might be hidden (e.g. if they are in a fold or on the bottom side). Iterations in which the textile is physically moved into a different position and then classified again could solve this problem. 4.2
Feature Extraction
Following features were used in the evaluation of the described application: LBP Local binary Patterns (LBP) features have shown their performance in previous work dealing with textile fiber classification tasks [12]. The used LBP type [19] is invariant against rotation and gray-scale and shows a relationship between pixel and its surrounding. It fulfills the requirements in aspects of computational costs compared to other scale-invariant LBP variants[20]. Experiments on a subset of the database showed that a radius of 3 and a block size of 32 pixels is ideal for the used database. A histogram of rotation-invariant binary patterns for blocks of 32 pixels was calculated and concatenated to a feature vector. To reduce the dimensionality of the feature vector, Principal Component Analysis (PCA) was applied to a subset of the data set. Experiments have shown that reducing the data set to 300components gives the best results. Color Histogram A color histogram represents the distribution of colors in an image. The optimal discretization of the colors into bins was calculated iteratively and evaluated with 4-fold cross validation. A histogram was calculated on the HSV color model for every channel and then concatenated with each other. The evaluation showed that the usage of 130 bins gives the best results for the data-set used. LBP + Color Histogram The histogram was calculated using 130 bins for each HSV channel, concatenated with each other and the LBP features vector. SIFT/SURF Bag of Words The local interest point descriptors SIFT and SURF [21] have shown in many applications their effectiveness as local feature detectors and descriptors for non-rigid 3D objects [22]. They are scale-invariant and robust against rotation, translation and changing lighting conditions. A set
Title Suppressed Due to Excessive Length
9
of interest points was extracted following the Bag of Words (BOW) approach of Siegmund et al.[12].
SIFT/SURF BOW + Color Histogram As local interest points do not include any color information, a color histogram using 130 bins was computed and concatenated to the SIFT/SURF feature vector.
Color Threshold Since stains defects on the given textiles contain other color than the fabric mean color, a simple binary threshold approach using a threshold on the gray-scale color value of each pixel was used. The amount of black pixels in each patch classifies them, instead of a machine learning classifier.
4.3
Classification
In the experiments using machine-learning, SVM and AdaBoost performed best among the classifiers: SVM, Random Forrest, AdaBoost and JRIP. Therefore, SVM with the SMO (Sequential Minimal Optimization) extension and AdaBoost were chosen in the experiments as classifiers. The SVM parameters were defined using a model, choosing the optimal parameters C, gamma, p, nu, coef0 and degree with cross-validation. The REAL boosting method was chosen for AdaBoost which utilizes confidence-rated predictions and was expected to work well with the categorical feature vectors. All features and classifiers were evaluated with-and without use of the proposed shadow normalization method. In the color threshold approach, a color range around the mean-color: α was specified to define the texture color. Pixels with a gray-scale color value higher or lower than the range where considered to be defects (see Figure 4F ).
Table 1: Equal Error Rates in Stain Defect Recognition. Methodology
SVM w/o AdaBoost Color Th AdaBoost with norm. w/o norm. w/o norm. normalization
Color Histogram LBP + PCA LBP + PCA + ColorHist. SURF BOW SURF BOW + ColorHist. SIFT BOW SIFT BOW + ColorHist. Full Image
40.15 39.51 37.14 32.56 40.02 28.56 35.36 -
15.77 30.54 19.68 20.11 16.15 18.35 15.03 -
18.74
13.54 28.14 15.05 25.32 20.91 20.46 10.90 5.68
10
Lecture Notes in Computer Science: Authors’ Instructions
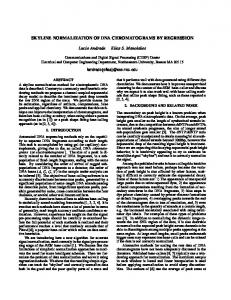
Fig. 6: ROC-Curve Showing Results of Classification with Normalization and AdaBoost Classifier.
5
Results
As shown in Table 1, almost random classification results were archived using LBP features with SVM and AdaBoost. This approach showed poor performance when distinguishing between stain characteristics and others regular texture properties like folds and shadow. In the feature extraction process of the LBP approach the selection of an adequate radius is furthermore error-prone, as the selection is very sensitive to the image quality. The local interest points SURF and SIFT are rotation and scale invariant but contain no color information. The combination with a extracted color-histogram tended to show better results in all approaches. The results indicate that local interest points features are not able to distinguish between shadow and stain defects (see Figure 1). The results of the approach using a simple color-range threshold via gray-scale conversion on the not-normalized textiles confirms that assumption. The classifiers SVM and AdaBoost achieved different error-rates using the same input data. For
Title Suppressed Due to Excessive Length
11
the calculation of the results using the proposed normalization as input data, only AdaBoost training was used. The scores using normalized textile images as in-put showed better results for all examined feature and classification methods. The approach using color-range thresholding resulted in the lowest error rate of 5.68%. A proportion of positives that are correctly identified of 95,28% (TPR) and a FPR of 4% were achieved using this approach. The ROC (Receiving Operator Characteristic) curve in Figure 6 shows the metrics TPR and FPR in relation to the threshold using the presented normalization technique and AdaBoost classifier. All approaches were evaluated using 4-fold cross validation. The Equal Error Rates (EER) per approach were defined by calculating the mean of all individual classifiers EERs.
6
Conclusion
We presented a novel approach for normalization of textiles arranged in piles, towards their classification regarding stain defects. Competitive approaches deployed on at, and spread-out 2D textile surfaces were selected for an evaluation of this novel computer-vision application. The new database shows textiles in a pile-like arrangement, recorded with a stereo vision camera setup. For detection of stains in the textiles, machine learning as well as a color-range thresholding classifiers were used. We showed that all evaluated features have disadvantages when distinguishing between defect characteristics and regular textures of textiles arranged in piles. The presented normalization methods resulted in better classification results for all examined feature types. Nevertheless, best results were achieved using a simple color-range threshold on the normalized fabrics. We described underlying assumption in Sections 3 and 5 and proved their relevance towards a robust classification of voluminous textiles. The novel approach uses stereo vision images to mask out image areas folds or shadow and will be evaluated in the classification of other inhomogeneous objects in future work.
References 1. Council, H.K.P.: Textile Handbook 2000. The Hong Kong Cotton Spinners Association (2000) 2. Kumar, A.: Computer-vision-based fabric defect detection: a survey. Industrial Electronics, IEEE Transactions on 55 (2008) 348–363 3. Mishra, D.: A survey-defect detection and classification for fabric texture defects in textile industry. International Journal of Computer Science and Information Security 13 (2015) 48 4. Ngan, H.Y., Pang, G.K., Yung, N.H.: Automated fabric defect detectiona review. Image and Vision Computing 29 (2011) 442 – 458 5. Borghese, N.A., Fomasi, M.: Automatic defect classification on a production line. Intelligent Industrial Systems 1 (2015) 373–393 6. Murino, V., Bicego, M., Rossi, I.A.: Statistical classification of raw textile defects. In: in ICPR, 2004. (2004) 311–314
12
Lecture Notes in Computer Science: Authors’ Instructions
7. Rebhi, A., Benmhammed, I., Abid, S., Fnaiech, F.: Fabric defect detection using local homogeneity analysis and neural network. Journal of Photonics 2015 (2015) 8. Abou-Taleb, H.A., Sallam, A.T.M.: On-line fabric defect detection and full control in a circular knitting machine. AUTEX Research Journal 8 (2008) 9. Schicktanz, K.: Automatic fault detection possibilities on nonwoven fabrics. Melliand Textilberichte 74 (1993) 294295 10. Islam, M.A., Akhter, S., Mursalin, T.E., Amin, M.A. In: A Suitable Neural Network to Detect Textile Defects. Springer Berlin Heidelberg, Berlin, Heidelberg (2006) 430–438 11. Sun, J., Zhou, Z.: Fabric defect detection based on computer vision. In: Artificial Intelligence and Computational Intelligence. Springer (2011) 86–91 12. Siegmund, D., Kaehm, O., Handtke, D.: Rapid classification of textile fabrics arranged in piles. In: SIGMAP 2016 - Proceedings of the 13th International Conference on Signal Processing and Multimedia Applications, Lisbon, Portugal, 26-28 July, 2016, SciTePress (2016) 13. Gevers, T., Stokman, H.: Classifying color edges in video into shadow-geometry, highlight, or material transitions. Multimedia, IEEE Transactions on 5 (2003) 237–243 14. Batchelor, B.G.: Lighting and viewing techniques. Automated Visual Inspection (1985) 15. Hirschm¨ uller, H.: Accurate and efficient stereo processing by semi-global matching and mutual information. In: Computer Vision and Pattern Recognition, 2005. CVPR 2005. IEEE Computer Society Conference on. Volume 2., IEEE (2005) 807–814 16. Arthur, D., Vassilvitskii, S.: k-means++: The advantages of careful seeding. In: Proceedings of the eighteenth annual ACM-SIAM symposium on Discrete algorithms, Society for Industrial and Applied Mathematics (2007) 1027–1035 17. Gevers, T., Smeulders, A.W.: Color-based object recognition. Pattern recognition 32 (1999) 453–464 18. Salvador, E., Cavallaro, A., Ebrahimi, T.: Shadow identification and classification using invariant color models. In: Acoustics, Speech, and Signal Processing, 2001. Proceedings.(ICASSP’01). 2001 IEEE International Conference on. Volume 3., IEEE (2001) 1545–1548 19. Zhao, G., Pietik¨ ainen, M.: Improving rotation invariance of the volume local binary pattern operator. In: MVA. (2007) 327–330 20. Li, Z., Liu, G., Yang, Y., You, J.: Scale- and rotation-invariant local binary pattern using scale-adaptive texton and subuniform-based circular shift. IEEE transactions on image processing 21 (2012) 2130–40 21. Bay, H., Tuytelaars, T., Van Gool, L.: Surf: Speeded up robust features. In: Computer vision–ECCV 2006. Springer (2006) 404–417 22. Zeng, K., Wu, N., Wang, L., Yen, K.K.: Local visual feature detection and description for non-rigid 3d objects. Advances in Image and Video Processing 4 (2016) 01