Waknaghat, Solan â 173215 (HP) INDIA. Abstract ... The use of portable wireless devices like mobile phones, laptop, PDAs have been increased rapidly. Due to this ... For example, the Brador virus [5] infects Pocket PCs running Windows CE. The Cabir ... The Mabir [7] and Symbos Comwar [8] worms use similar scanning.
Stochastic Modeling of Worm Propagation in Trusted Networks Vivek Kumar Sehgal Department of Electronics and Communication Engineering Jaypee University of Information Technology, Waknaghat, Solan – 173215 (HP) INDIA. Abstract - There are two types of models useful in the study of worm propagation for a given number of terminals in a trusted network i.e. deterministic and stochastic model. The deterministic models, also known as compartmental models are in the form of epidemic models. These epidemic models consist of different states called compartments so these models are also known as compartmental models. A closed (no inflow and outflow) donor control based compartmental model can be converted in to the stochastic model which is more realistic and also enables us to compute the transition probability from one state to other state. In this paper authors have presented a method for stochastic modeling of worm or virus propagation in trusted networks. Keywords: Epidemic SIR model, SEIR model, Compartmental matrix, Stochastic model, Transition probability matrix,
Markov Chain.
1.0 Introduction Over the past two decades computer worms have become worldwide problem. Worms can spread virtually moreover they are an ongoing, persistent, and worldwide problem on every popular micro computing platform. If we look at the past (two year) history we will find many cases like Morris worm in 1988 [1], Code Red appears on July 19, 2001 [2] which trigger the internet-scale worm attacks. In the same year Nimda infected thousands of computers [3]. In January 2003, the SQL Slammer worm was spread out and infected 90% valuable computers in very short period of time [4]. After that Cod Red II, Blaster, Sasser, and Witty have repeatedly attacked the internet. The history of these worms shows that how dangerous and how fast they spread to damage maximum computers in a network within fraction of time, before human can take effective precaution to prevent the damage of network. The use of portable wireless devices like mobile phones, laptop, PDAs have been increased rapidly. Due to this mobile networks are becoming an important part of our everyday networking infrastructure which causes many cases of viruses in mobile network. For example, the Brador virus [5] infects Pocket PCs running Windows CE. The Cabir worm [6] infects cell phones running the Symbian operating system. The Mabir [7] and Symbos Comwar [8] worms use similar scanning techniques and also propagate via MMS messages. This paper analyzes the spread of worm in a network with known number of hosts. The method of modeling is based on the epidemiology. Computer viruses and worms are similar to the biological viruses in their propagation behaviors. In epidemiology area, both stochastic models and deterministic models exist for modeling the spread of infectious diseases [9]. In this paper linear closed donor control based epidemic model is used as a linear compartmental (deterministic) model. From the compartmental model, we can derive the compartmental matrix which retains the properties of Metzler matrix. This compartmental matrix gives us the inter compartmental flow of closed epidemic model, which help us to drive the transition probability matrix and from that we can convert the compartmental matrix to the Markov Chain. The compartmental matrix used in this paper is mass conservative in the sense that mass balance is preserved inside the system. Pierre Philippe [10] shows some of the common models used in infectious disease modeling. In these models, some models are having feedback and some are not .The models with feedback can be converted in to stochastic models using Regular Markov Chains and the others can be converted into stochastic models using Absorbing Markov Chains. If the deterministic model is non linear compartmental model then it has to be linearized using Jecobian matrix about the equilibrium points. If the jacobian matrix is linear compartmental matrix then we can get the stochastic model.
1.1 Related work Many researchers are working in the area of virus and worm modeling. To analyze the epidemics of these viruses and worms, Kephart, White, and Chess of IBM have performed a series of studies on viral infection based on epidemiology models [11]. Cliff C. Zou, Weibo Gong, Don Towsley, and Lixin Gao [12] present an Internet worm monitoring system and methodology to detect a worm at its early propagation stage by using Kalman filter estimation. Cliff C. Zou, Weibo Gong, and Don Towsley [13] presented the modeling and analysis under dynamic quarantine defense. Kurt Rohloff, Tamer Basar [14] worked on the detection of RCS worm epidemics. IBM's High Integrity Computing Laboratory demonstrates some interesting trends that have become apparent recently [15]. James W. Mickens, Brian D. Noble [16] has worked on modeling epidemic spreading in mobile environments
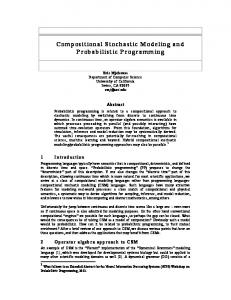
2.0 General Epidemic Model: Kermack–Mckendric Epidemic Model In this section a basic SIR model is discussed where total number of hosts (N) is divided into three states (compartments) Therefore, in this model each host stays in any one of the three states at any instant of time. The three states are: susceptible (S), infectious (I), or removed (R). A host either makes the state transition “susceptible → infectious → removed” or remains in the susceptible compartment as shown in the Figure 1. βIS
νI
S
I
R
Figure 1: Simple SIR epidemic model The model is a nonlinear epidemic model where βIS component is the source of non linearity. Therefore the compartmental
model is also a nonlinear. This model can be described by the following set of equations: dS dt = − βIS
(1)
dI dt = β IS − νI
(2)
dR dt = νI
(3) N =S+I+R (4) Where β is the transmission rate and ν is the removal rate of infectious hosts [13]. The epidemic threshold of this model is: ρ ≡ν β
(5) A major outbreak occurs if and only if the initial number of susceptible hosts S (0) > ρ . From equations (1) to (4) we can derive dI dt < 0, ∀t > 0 if and only if S (0) < ρ . This model can be used as deterministic model which is nonlinear in nature.
Therefore it has to linearize using Jacobian matrix J about equilibrium points (S e , I e ) J =
⎡ − βI e ⎢ βI e ⎢ 0 ⎣
− βS e βS e − ν ν
0⎤ 0⎥ 0⎥ ⎦
(6)
This Jacobian matrix (6) is not a compartmental matrix, so this model can not be converted in to stochastic model. We can have another epidemic model called SEIR model, which is linear and can be converted in to the stochastic model. Figure 2 shows the dynamic behavior of basic SIR model for N = 105, S ( 0) = 100, I ( 0) = 5 , and R ( 0) = 0 .The transmission rate β = 0.001 and removal rate ν = 0.05 .
Figure 2: Dynamic behavior of basic SIR model
3.0 Epidemic Model for Stochastic Modeling In this section a linear epidemic model SEIR with four compartments is discussed. These compartments are: susceptible (S), exposed (E), infectious (I), and removed (R). This model can be used for stochastic modeling with following certain assumptions: 1) Total number of hosts is constant. 2) Compartment E is merged with compartment I. 3) The hosts in compartment E are directly recovered. 4) The model is donor control based model. 5) The model is mass conservative. δE
S
βS
E
νI
I
R
Figure 3: Linear SEIR epidemic model A host either makes the state transition “susceptible → infectious → removed” or “susceptible → exposed → removed” as shown in the Figure 3. The hosts in compartment (E) are infected or exposed but not yet infectious at time t. The behavior of SEIR model in Figure 3 can be described by the following set of differential equations: dS dt = − βS
(7)
dE dt = −δE + (1 − α ) βS
(8)
dI dt = −νI + αβ S
(9)
dR dt = δE + νI
(10)
N =S+E+I+R
(11)
Where β is the transmission rate and ν , δ are the removal rates of infected and infectious hosts, α is the separation constant. This model can be used as deterministic model. Figure 4 shows the dynamic behavior of basic SEIR model and R ( 0) = 0 .The transmission rate β = 0.01 and removal for N = 15000, S ( 0) = 14000, E ( 0) = 50 , I ( 0) = 950 rates ν = 0.01 , δ = 0.01 . The separation constant α is 0.001 . Since the equations describing the behavior of SEIR model are linear differential equations, the four compartments appearing in these equations can be treated as physical state space variables.
Figure 4: Dynamic behavior of basic SEIR model
4.0 Compartmental Modeling of SEIR Model The state space model of SEIR epidemic model can be described by the following equations: X& (t ) = AX (t )
⎡ −β ⎢(1 − α )β ⎢ αβ ⎢ ⎣ ⎦ ⎣ 0 ⎡ S& ⎤ ⎢ E& ⎥ ⎢ I& ⎥ = ⎢ R& ⎥
0 −δ 0
0 0 −ν
δ
ν
(12) 0⎤ 0⎥ 0⎥ ⎥ 0⎦
⎡S ⎤ ⎢E ⎥ ⎢I ⎥ ⎢R⎥ ⎣ ⎦
(13)
⎡ −β ⎢(1 − α )β A=⎢ αβ ⎢ 0 ⎣
0 −δ 0
0 0 −ν
δ
ν
0⎤ 0⎥ 0⎥ ⎥ 0⎦
(14)
Where A is called compartmental matrix. The solution of this homogeneous state equation is:
()
() ⎡ S (t )⎤ ⎢ E (t )⎥ X (t ) = ⎢ I (t ) ⎥ ⎢ R(t )⎥ ⎣ ⎦ −1 At −1 e = L [(sI − A ) ] X t =e
or e
At
At
X 0
= I + At +
(15)
(16)
(17)
1 i i 2 2 A t + ..... + A t i! 2! 1
(18)
Where e called state transition matrix of SEIR is deterministic model and X (0 ) is the column matrix which shows the initial conditions of SEIR epidemic model At
4.1 Properties of Compartmental Matrix Certain important properties of compartmental matrix A are given below: 1) The diagonal elements of compartmental matrix are zero or negative elements. 2) The non-diagonal elements of compartmental matrix are zero or positive. 3) The first eigenvalue of compartmental matrix is zero. 4) The sum of elements in each column of compartmental matrix is equal to zero. 5) Compartmental matrix is Metzler matrix.
5.0 Stochastic Modeling of SEIR Model Stochastic modeling is very useful in worm epidemic model. Stochastic model help us to calculate the transition probability from one state to other state and expected time from one state to other state. The transition probability matrix can be derived from compartmental matrix using following relation [17].
(
P = I + hA
)T
(19)
Where P is the transition probability matrix and h is the time between events or trials. Proof: The probability pi (n ) that the random variable is in state i at any time n may be found from the level of numbers or k
quantity of random variables xi (n ) in that state (now called compartment) at time n . Indeed pi (n ) = xi (n ) ∑ x j (n ) , j =1 where k is the number of states. The levels at time n + 1 are given in terms of those at time n by the same equation,
n = 0,1,2,........... ,
X nT+1 = X nT P,
(20)
as the probabilities. Here, X n is a column vector of material levels. Then, we have
⎡1⎤ ⎡1⎤ ⎡1⎤ ⎡1⎤ 1⎥ T ⎢1⎥ T ⎢1⎥ T ⎢1⎥ ⎢ X n +1 = x n +1,1 , x n +1, 2 ,...., x n +1,k . = Xn P = Xn ⎢.⎥ ⎢. ⎥ ⎢. ⎥ ⎢.⎥ ⎢⎣1⎥⎦ ⎢⎣1⎥⎦ ⎢⎣1⎥⎦ ⎢⎣1⎥⎦
[
]
(21)
Since [1,1,....,1] is always a right eigenvector corresponding to the steady state eigenvalue of 1 of P. If we started with a T
n
quantity q = ∑ x j (0 ) of materials in the system, then the total quantity in the system remains at q for all time by (21). j =1
x (0 ) Thus, we have pi (0 ) = i . q.
Thus, equation (20) is one form of equation of a compartmental system, but a more common format is as a difference equation
(
T T T X n +1 − X n = X n P − I
)
or by taking transpose of the matrices
( T − I )X n
∆X n = P
(22)
If the time step, i.e., the time between trials, is h rather then 1, then X n = X (nh ) and the left side of equation (22) is replaced by the difference quotient
(
)
( ) = 1 (PT − I )X (nh ). := AX (nh )
X nh + h − X nh h
h
We now let t = nh to get
(
)
( ) = AX (t )
X t+h −X t h
This left side is approximately the derivative, so we have X ′ = AX
This is the differential equation for the compartmental matrix. Hence A=
T ( P − I) h
1
Where P is the transition probability matrix and h is the time between events or trials. Hence P = (I + hA ) . T
⎡ 1 − hβ ⎢h(1 − α )β P=⎢ hαβ ⎢ 0 ⎣
0 1 − hδ
0 0
0
1 − hν
hδ
hν
T
⎡ p ss ⎢p = ⎢ es p is 0⎥ ⎢ ⎥ 1⎦ ⎣ p rs 0⎤ 0⎥
p se
p si
p ee
p ei
p ie
p ii
p re
p ri
p sr ⎤
⎡1 − hβ ⎢ 0 = p ir ⎥ ⎢ 0 ⎥ ⎢ p rr ⎦ ⎣ 0
p er ⎥
(
)
h 1−α β
hαβ
1 − hδ 0 0
0 1 − hν 0
0
⎤
hδ ⎥ hν ⎥ ⎥ 1⎦
(23)
From (23) we can see that the sum of all elements in each row of transition probability matrix P is equal to 1. Hence j =3
∑p j =0
ij
= 1 Where i,j=0….4
(24)
5.1 Properties of Transition Probability Matrix Certain important properties of transition probability matrix P are given below: 1) The first eigenvalue of transition probability matrix is one. 2) The sum of all elements in each row of transition probability matrix is equal to 1. 3) This matrix is also known as Markov Matrix.
5.2 Markov Chain from Transition Probability Matrix Figure 5 shows the stochastic diagraph of transition probability matrix hδ
h(1 − α )β
P 1
1 − hν
S 1 − hβ
E hαβ
1 − hδ
I
R hν
Figure 5: Stochastic diagraph (Absorbing Markov Chain) of SEIR model
In an Absorbing Markov Chain with states ordered such that the transition probability matrix P has the form P=
⎡Q ⎢⎣ 0
R⎤
(25)
I⎥ ⎦
the following hold: 1) 2)
t Q → 0 as t → ∞ −1 R∞ = 1 − Q R
(
)
3) The expected number of times a chain is in the nonabsorbing state k j given that it started in ki is given by the corresponding element of (1 − Q ) . The matrix (1 − Q ) is often referred to as Markov chain’s fundamental matrix For each nonabsorbing state, there is an absorbing state with a path of minimum length. Let r be the maximum length of all such paths. Therefore, in r steps, there is a positive probability p of entering one of the absorbing states regardless of −1
−1
where you started. The probability of not reaching an absorbing state in r steps is (1 − p ) . After the next r steps, it is
(1 − p )2 and after
kr steps, (1 − p ) . Since this approaches 0 as k → ∞ , the probability of being in any nonabsorbing state k
t
approaches 0 as t → ∞ . But the elements of Q are just these probabilities.
6.0 Stochastic Analysis of SEIR Model From equations (23) and (25), we get P=
⎡ ⎡1 − hβ ⎢⎢ 0 = ⎢⎢ I⎥ ⎦ ⎢⎣ 0 ⎣
⎡Q R ⎤ ⎢⎣ 0
(
)
h 1 − α β hαβ ⎤ 1 − hδ 0 ⎥ 0 1 − hν ⎥ ⎦
[0
0 0
]
⎡ 0 ⎤⎤ ⎢ hδ ⎥ ⎥ ⎢⎣ hν ⎥⎦ ⎥ [1] ⎥⎦
(26)
The last state of this Markov chain p rr = 1 , is absorbing state. For β = δ = ν = 0.01 , α = 0.001 and h = 0.1
⎡0.999 ⎢ 0 P= ⎢ 0 ⎢⎣ 0
0.000999 0.000001 0.999
0
0
0.999
0
0
0
⎤
0.001⎥ 0.001⎥ 1
⎥⎦
,
⎡0.999 Q=⎢ 0 ⎢⎣ 0
0.000999 0.000001⎤ ⎡ 0 ⎤ ⎥ 0.999 0 , R = ⎢0.001⎥ , I = 1 0
0.999
⎥⎦
⎢⎣0.001⎥⎦
For transient response
(1 − Q )−1
⎡1000 = ⎢⎢ 0 ⎢⎣ 0
999 1000 0
1 ⎤ 0 ⎥⎥ 1000 ⎥⎦
−1
From (1 − Q ) matrix we can calculate: 1) For susceptible host
Expected time as susceptible host = (1 − Q ) 11 = 1000 Sec. Expected time as exposed host = (1 − Q ) −1
−1 12
= 999
1 Sec. Sec. Expected time as infectious host = (1 − Q ) Total expected time that a susceptible host takes to become infectious = 1000+ 999+1 = 2000 Sec. 2) For exposed host −1 13 =
Expected time as exposed host = 3) For infectious host
(1 − Q )−1 22 = 1000 Sec.
Expected time as infectious host = (1 − Q ) 33 = 1000 Sec. The expected time for exposed host as infectious host = 0, because there is no transition from E state to I state as shown in Figure 3 For steady state response −1
( )−1 R = ⎡⎢ ⎤⎥
R∞ = 1 − Q
1 1
⎣1⎦
R matrix we can calculate:
−1
1) Probability of susceptible host to recover = (1 − Q ) −1
2) Probability of exposed host to recover = (1 − Q )
R21 = 1
−1
3) Probability of infectious host to recover = (1 − Q )
P∞
1.2
1.2
1
1
0.8
P(SS) P(SE)
0.6
P(SI) P(SR)
0.4 0.2
Transition probabilities
Transition probabilities
For the steady state complete transition matrix
⎡ Q∞ = ⎢⎣ 0
R11 = 1
R31 = 1
⎡0 ⎢0 = ⎥⎦ ⎢0 ⎢⎣0
R∞ ⎤ I
0 0 1⎤
0 0 1⎥
0 0 1⎥
0 0 1⎥ ⎦ 1.2 1
0.8 P(ES) 0.6
P(EE) P(EI)
0.4
P(ER) 0.2
0
5000
10000
15000
20000
-0.2 No of transitions
Figure 6: Transition Prob. for state S
0.8 P(IS)
0.6
P(IE) P(II)
0.4
P(IR) 0.2 0
0
0
Transition probabilities
−1
From R∞ = (1 − Q )
0
5000
10000
15000
0
20000
-0.2
5000
10000
15000
20000
-0.2
No or transitions
Figure 7: Transition Prob. for state E
No of transitions
Figure 8: Transition Prob. for state
I
7.0 Conclusion The spread of worm or virus in a network is a random process and this paper help us to find out the various transition probabilities and expected time of state transition so we can inject the antivirus in time. Further extension of this work is to design the stochastic model for a epidemic model with feedback. This work has good scope in future. If we take the epidemic model with the inflow and outflow rates then we can check the controllability and absorbability of epidemic model, which help us to design the state observer and state space controller to control the spread of worm. This state space controller is also called compartmental controller.
8.0 References [1] [2] [3] [4] [5] [6] [7] [8] [9] [10] [11] [12] [13] [14] [15] [16] [17] [18] [19] [20]
D. Seeley, “A tour of the worm,” in Proc. Winter USENIX Conf., Jan.1989, pp. 287–304. D. Moore, C. Shannon, and J. Brown, “Code-Red: A case study on the spread and victims of an Internet worm,” in Proc. 2nd ACM SIGCOMM Workshop on Internet Measurement, Nov. 2002, pp. 273–284. CAIDA. Dynamic Graphs of the Nimda worm. http://www.caida.org/dynamic/analysis/security/nimda/ D. Moore, V. Paxson, S. Savage, C. Shannon, S.Staniford, and N. Weaver. Inside the Slammer Worm. IEEE Security and Privacy, 1(4):33-39, July 2003. R. Wong and I. Yap. Security Information: Virus Encyclopedia: WINCE BRADOR.A: Technical Details, 2004. Trend Micro Incorporated. P. Ferrie, P. Szor, R. Stanev, and R. Mouritzen. Security Response: SymbOS.Cabir, 2004. Symantec Corporation. E. Chien. Security Response: SymbOS.Mabir, 2005. Symantec Corporation. M. Lactaotao. Security Information: Virus Encyclopedia: SYMBOS COMWAR.A: Technical Details, 2005. Trend Micro Incorporated. D.J. Daley and J. Gani. Epidemic Modelling: An Introduction. Cambridge University Press, 1999. http://www.ispub.com/istia/index.php?xmlFilePath=journals/ijid/vol1... J. O. Kephart and S. R. White. Directed-graph Epidemiological Models of Computer Viruses. In Proceedings of the IEEE Symposimum on Security and Privacy, 1991. Cliff C. Zou, Weibo Gong, Don Towsley, and Lixin Gao "The Monitoring and Early Detection of Internet Worms," IEEE/ACM Trans. Networking. Cliff C. Zou, Weibo Gong, and Don Towsley. "Worm Propagation Modeling and Analysis under Dynamic Quarantine Defense," ACM CCS Workshop on Rapid Malcode (WORM'03), Oct. 27, Washington DC, USA, 2003. Kurt Rohloff, Tamer Basar "The detection of RCS worm epidemics" Proc. 2005 ACM workshop on Rapid malcode WORM '05 http://www.research.ibm.com/antivirus/SciPapers/White/VB95/vb95.distrib.html James W. Mickens, Brian D. Noble "Modeling epidemic spreading in mobile environments” Proc. 4th ACM workshop on Wireless security WiSe '05 Gilbert G. Walter and Martha Contreras "Compartmental Modeling with Networks" G.S. Ladde, “Cellular Systems - II. Stability of Compartmental Systems”, Mathematical Biosciences, 30, pp. 1-21, 1976. J.A. Jacquez, C.P. Simon, “Qualitative Theory of Compartmental Systems with Lags”, Mathematical Biosciences, vol. 180, pp. 329 - 362, 2002. I.W. Sandberg, “On the Mathematical Foundations of Compartmental Analysis in Biology, Medicine, and Ecology”, IEEE Trans. Circuits and Systems, CAS25(5), pp. 273-279, 1978.