Tehran, Iran. {m.mojadaddy, m.nabi, khadivi}@aut.ac.ir. AbstractâStock market prediction is an attractive and complicated application of machine learning ...
Stock Market Prediction using Twin Gaussian Process Regression Mohammad Mojaddady, Moin Nabi and Shahram Khadivi Department of Computer Engineering Amirkabir University of Technology Tehran, Iran {m.mojadaddy, m.nabi, khadivi}@aut.ac.ir
Abstract—Stock market prediction is an attractive and complicated application of machine learning algorithms. There are many various effort in price prediction by using methods such as Neural Network, Linear Regression(LR), Multi Linear Regression(MLR), Auto Regressive Moving Average Models (ARMA) and Genetic Algorithms(GA) .In this report we consider about the Twin Gaussian Process (TGP) method to predict the stock prices. Using stochastic processes for stock prediction has not been studied widely but we believe every progress can be directly applied in business. For that we use the historical data of stock price to learn TGP and finding the relation between input and output data. Then, by insertion of the new data to TGP, we predict the prices. We test our method on both USA and Iran stocks. The result of using TGP method is much effective than base line methods. Keywords-component; Regression ; Stock Market ; Prediction ; Twin Gaussian Process ; Structured prediction.
I.
INTRODUCTION
Because of dynamic manner of stock market prices, prediction is so difficult. Increase and decrease of stock market prices depends on various factors such as amount of demand, exchange rate, price of gold, price of oil, political and economical events and … but in the other view point we can consider the stock market price variation as time series and without notation to the mentioned factors, and just by finding the sequence rules of price train, make the price prediction in the future. There are so many researches in price variation time series prediction by different methods such as Neural Network, LR, MLR, ARMA, GA. Neural Network is one of the popular methods for predicating stock market. Most of researches that use Neural Network for prediction, use Multi Layer Perceptron and use back propagation for learn Network.[1], [2], [3], [4] who Train Neural Network by historical data of stock for predicting price in future. One of the effective methods can be the “Regression algorithms”. The aim of Regression algorithms is to map the function or set of functions on the price variation curve. Linear Regression and Multi Linear Regression also used for prediction. [5,],[6] use Regression for predicting stock price changes. The used algorithm in this research is Twin Gaussian Process. A Gaussian process is any collection of random
variables where an arbitrary subset of variables has a joint Gaussian distribution [7]. Twin Gaussian Process is a generic structure prediction method that use Gaussian Process (GP) prior on the both covariance and response, both multivariate, and estimates outputs by minimizing the Kullback-Leibler divergence between two GP modeled as normal distributions over finite index sets of training and testing examples, emphasizing the goal that similar inputs should produce similar percepts and this should hold, on average, between their marginal distributions [8]. In this research data in use includes of stock price history of 8 deferent stocks over the period of 10 years. The interesting point of using this TGP algorithm, it is not necessary to use whole data to learn. And model gets good result with small data sets. In this research we use historical data of 8 stock market prices as data set(prices of: adbe, adsk, erts, msft, orcl, sap, symc, and vrsn).also we use historical data of Iran’s stock prices to predict stock price of Tehran Stock market. These data include five feature of daily price (open price, higher price in day, lowest price in day, close price and volume of transactions). We use close price as feature of day, and try to train our TGP model with close price of previous days. First step for prediction is data cleaning. For this purpose, we must focus on data series and remove outliers from dataset. In some range of dates manner of prices are so wavy and haven`t normal changes. This range of data must remove from dataset. After that import data series in TGP to learn sequential of time series. The main goal of regression is to find best value of next states. Regression methods accept a series of data for input and get the future values by indexes. In a study which was conducted in MIT University,[9]try to predict stock market by Gaussian process. They user same 8 stock price history as we use for experiment. We use the result of them for base line result and compare our result with that. As you can see in result section, our prediction accuracy is better than their result. For example in experiment with msft’s dataset, the Mean Square Error (MSE) of our prediction is 3.87, and the result of MIT research was 23.24. We try to use same data and structure for prediction, and then we can compare our result with TGP with result of them with GP .This show that TGP process is more effective in this application.
Problems similar stock market prediction because of their distribution can be more predictable with TGP. II.
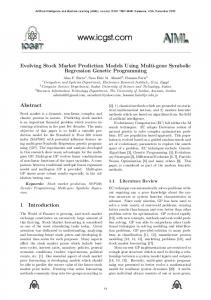
figure 1 (right) with dash lines. For our example mean value of functions was assumed as the final regression.
TWIN GAUSSIAN PROCESS MODEL
In every prediction, we have a set of input values (for our purpose, time) and a set of corresponding output (for our purpose, stock prices). Our goal is to predict stock prices given a limited time series. In the next section, we first explain shortly about Gaussian Process, and its application in regression. Then introduce the new method of Twin Gaussian Process and describe about its usage for structured prediction.
A. Gaussian Process Regression Figure 1. Set of functions for regression by using GP [7]
A Gaussian process is a generalization of the Gaussian probability distribution over time [8]. In the other words, it is a collection of random variables which is a subset of variable with a joint Gaussian distribution [9]. Similarly to the Gaussian distribution which is specialized with a mean and covariance, a Gaussian process is specialized with a mean function m(x) and covariance function k (x,x’). That is, ���� � ������ � 0 And, ���, � � � ������� � ����� �� �� � ��� ���� � � And the final form of GP is ����~ �������, ���, � �� Usually for having a simple computation and notation the mean function is assumed 0. So we have, ����~ ���0, ��
In the case we assume � ∗ as ground truth and �� as a prediction, there will exist a joint distribution over the training data and the prior is centered with mean on 0, thus �∗ � ��~ �
!0, "
��#, #� ��#$ , #�
��#, #$ � %& ��#$ , #$ �
Such as other regression method, the goal in GP is to infer a continuous function from a training set of input-output pairs. Such as other regression method, the goal in GP is to infer a continuous function from a training set of input-output pairs. Our used covariance function was the Gaussian, and this kernel function prior guarantee a good regression by limiting inputs based on strong correlation of their outputs. Simply a Gaussian Process for regression purpose is a set of functions which accept outputs Y with a Gaussian distribution based on every value X as input. This set of function had shown in figure 1. According to figure 1 (left) every shown line in gray region can be assume as a regression function of input values of x. However, with having some values of output corresponding to given input, we can prune a lot of functions, and our gray region decrease significantly. These functions are shown in
B. Twin Gaussian Process Gaussian Process regression is a useful method for handling non-linear relation between inputs and outputs, but it’s just for single outputs. Although generalizations to multiple outputs can be derived by training independent models for each, this fails to leverage information about correlations among output components in the predictor. [10] Another task which GPR can’t handle it is having various values for a time series, such as our problem that is an inverse stock prediction problem for financial purpose. For solving these sorts of problem Twin Gaussian Process was proposed. It’s first used for estimation of monocular 3d human body poses which is a challenging problem in computer vision area and show significant improvement and became state of art. The similarities between the concepts of this problem with stock price prediction encourage us to apply this regression method to our problem. The twin Gaussian process is a structured prediction method which uses Gaussian process priors [8] on both covariates and responses, both multivariate. This method predicts outputs by minimizing the KLD [9] between two GP modeled as normal distributions over finite index sets of training and testing examples. It’s based on this fact that similar inputs should produce similar percepts. [9] To discuss about the details of this method we quote formulation below from [8]. To begin with, we first consider an alternative view to Gaussian processes. Since �# �'� �( � �'� � � is a sample from a Gaussian distribution ) �0, �*∪) � where we can estimate the covariance matrix as: ( �# �'� � �*∪) � " % �# �'� � �'� � � � �'� �# �'� �( # �'� �# �'� �( � �'� � � �'� �'� # � � �'� � �'� In perception problems, we wish similar inputs to produce similar percepts. Since we know the true Gaussian distribution
of the inputs ) we measure the offset between the estimated Gaussian distribution of outputs, including a new target, and the homologous input distribution, using Kullback-Leibler divergence[8]: 1
1
,-. � � || 0 � � � � log|�#∪� | 7 2 2 1 �;< �; �= 7 7 89 :�*∪) � < ( ��; � �; �9, 9� 2 1 �; �;< 7 log >� < ( �> ��; � �; �9, 9� 2 III.
RESULTS AND CONCOLUTION
A. EXPRIMENTS We performed data from 9 stock markets to test our method. First 8 dataset is historical data from USA stock market and last dataset is historical data from Tehran Stock market. These datasets contain 6 features from each day of trading. Because of important meaning of close stock price in each day, we decide to use the value of close price in each day for learn our model. We use close price of trading days to predict the price of the following day(s).
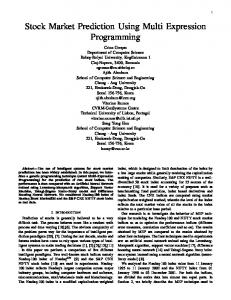
Figure2. Previous Days and TGP Prediction Table 1. Mean Squire Error of Stock Market prediction Mean Square Error
Dataset Name Adobe Systems Incorporated
Twin Gaussian Process
Gaussian Process
5.5129
31.664
6.9853
38.1152
9.3889
45.4864
3.8729
23.2404
9.1444
14.0564
10.6153
53.8016
13.218
16.5636
13.2947
22.6892
0.79102
4.4541
(NASDAQ:ADBE)
Autodesk Inc (NASDAQ:adsk)
Electronic Art Inc (NASDAQ:erts)
Microsoft Corporation (NASDAQ:msft)
Oracle Corporation (NAZDAQ:orcl)
SAP (NAZDAQ:sap) Symantec Corporation (NAZDAQ:symc)
VeriSign Inc (NAZDAQ:vrsn) Tehran Stock Index
Before use TGP and GP for forecasting prices, first we focus on price manner and find out that, variance of change prices in some range of dates in Iranian stock price is so high, may be for political or international event. Then we decide to remove these data and ignore these ranges. B. STOCK PRICE PREDICTION After preparing data for learning Regression model, we perform experiments with Twin Gaussian Process and Gaussian Process. The result of GP and TGP include a range of price in future, that prices may have a value in this range( as you can see in figure 2).GP and TGP present a mean of this rang that have better chance in future.
Figure 3. Forecast rang and mean of forecast range
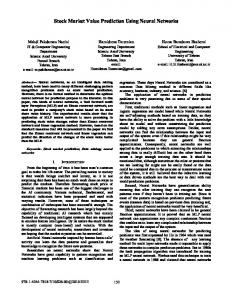
For evaluating our result with actual values, we compare these mean values with actual values, and calculate Mean Square Error (MSE) for any predicted prices. In our experiment we use all 9 dataset to learn and predict stock price in future. The result of TGP is better than GP, as you can see in figure 2.Prediction accuracy with TGP is more effective in all 9 dataset.
Figur4. Error bars (GP: red and TGP: blue)
REFERENCES [1]
[2]
[3]
[4]
[5]
G. Eason, Armano, G., Marchesi, M., & Murru, A. (2004). A hybrid genetic-neural architecture for stock indexes forecasting. Information Sciences, 170(1), 3–33. Chen, Y., Dong, X., & Zhao, Y. (2005). Stock index modelling using EDA based local linear wavelet neural network. Proceedings of International Conference on Neural Networks and Brain, 1646–1650. Olson, D., & Mossman, C. (2003). Neural network forecasts of Canadian stock returns using accounting ratios. International Journal of Forecasting, 19(3), 453–466. Thawornwong, S., & Enke, D. (2004). The adaptive selection of financial and economic variables for use with artificial neural networks. Neurocomputing, 56, 205–232. Cao, Q., Leggio, K. B., & Schniederjans, M. J. (2005). A comparison between Fama and Frenchs model and artificial neural networks in
predicting the Chinese Stock Market. Computers and Operations Research, 32, 2499–2512. [6] Chaturvedi, A., & Chandra, S. (2004). A neural stock price predictor using quantitative data. Proceedings of the Sixth International Conference on Information Integration and Web-Based Applications Services, 27–29. [7] C.E. Rasmussen and K. I. Williams. Gaussian processes for machine learning. 2006. [8] Liefeng Bo · Cristian Sminchisescu. Twin Gaussian Processes for Structured Prediction. IJCV 2010. [9] M. Todd Farrell, Andrew Correa. Gaussian Process Regression Models for Predicting Stock Trends(2007).Technical Report on MIT University. [10] J. Weston, O. Chapelle, A. Elisseeff, B. Scholkopf, and V. Vapnik. Kernel dependency estimation. In Advances in Neural Information Processing Systems, 2002