African Journal of Business Management Vol. 5(26), pp. 10550-10556, 28 October, 2011 Available online at http://www.academicjournals.org/AJBM DOI: 10.5897/AJBM11.970 ISSN 1993-8233 ©2011 Academic Journals
Full Length Research Paper
Stock returns and inflation: An autoregressive distributed lag (ARDL) econometric investigation on Ghana Tandoh Francis1 and D. D. Tewari2* 1
City Garden City University College, Kumasi, Ghana. School of Economics and Finance, UKZN, South Africa.
2
Accepted 12 September, 2011
This study examines whether generalized Fisher hypothesis, which says that there is a positive relationship between stock market returns and inflation rate holds for Ghana, over the period of the first quarter of 1998 to the fourth quarter of 2007 (1998 q1 to 2007 q4). The empirical methodology uses autoregressive distributed lag (ARDL) cointegration technique to detect possible long- and short-run effects between the involved variables. The results provide evidence in favour of a negative long-run relationship between the considered series. The recommendation is that monetary authorities should do their best to control the level of inflation so as to increase the stock returns of the Ghana stock exchange to incentivize investors from home and abroad. Key words: Autoregressive distributed lag (ARDL) co-integration, Fisher hypothesis, Ghana, inflation, proxy hypothesis, stock market. INTRODUCTION Ghana‟s capital market, the Ghana Stock Exchange (GSE), was established in 1989 under the Financial Institutions Structural Adjustment Programme (FINSAP). The GSE began full operations in November 1990 with 12 listed companies and one government bond. Market capitalization within the first two years of operation increased from GH¢ 3 billion in 1991 to GH¢ 4.3 billion in 1992 while the listed companies increased to 15. The number of listed companies increased to 19 in 1995 and as at June, 2007, stood at 34 (Strategic African Securities Limited (SASL), 2007). The main indices are the GSE all share index and the Databank Stock Index (DSI). Strategic African Securities Limited has also published three new indices comprising the SAS Index (SASI), SAS Manufacturing Index (SAS-MI), and the SAS Financial Index (SAS-FI). In spite of the macroeconomic instability in Ghana, the performance of the GSE has been impressive in recent times. The GSE, with a U.S. dollar return of
*Corresponding author. E-mail:
[email protected].
144%, outperformed 61 markets around the world to be adjudged the world's best performing stock market in 2003 (SASL, 2007). The GSE has also provided a good platform for corporations to raise long-term capital to the tune of about $ 125.8 million from 1991 to 1998 (Frimpong, 2008). This amount was a substantial amount given the value of Ghana‟s GDP during those years. For the whole of 2005, the GSE All share index remained disappointingly low. The GSE has however been on the path of recovery slowly since the beginning of 2006, after the bearish market in 2005 (SASL, 2007). By mid 2007, the market capitalisation had increased by about 2%. The total annual real returns on stocks listed on the GSE have followed an undulating pattern since 1991, falling every two years and rising the following two years. Between 1997 and 1998, real return on the stock market increased by 168.4% but decreased by 153.5% between 1998 and 1999. It ended the year 2000 by gaining 16.55% (SASL, 2007). In the early 1990s, the Ghanaian economy came under severe strain by inflationary pressure which was caused
Francis and Tewari
by a number of factors, money supply expanded rapidly as a result of deficit financing especially in the latter part of 1992. The monetary expansion resulted in a high level of liquidity in the economy and was the major contributory factor to the resurgence of inflation pressure towards the mid 1990s. Although in 1990, average annual rate of inflation fell to 37.2%, it rose to 59.5% in 1995 and 40.5% in 2000. From the year 2000, inflation assumed a downward trend reaching 11.8% from which it crept to 13.7% by the end of 2007 (Bank of Ghana, 2008). As a result of increased inflation over the years, inflation in Ghana has become unpredictable. The knowledge of the relationship between stock returns and inflation or commonly known as generalized Fisher hypothesis is an important information for planners and investors both local and international origins. If investors at the GSE are benefiting from their investment in the face of high inflation rates, then the inflow of capital would continue into the country. Our research focuses on the relationship between inflation and stock market returns. The question we attempt to answer through the investigation of this relationship is whether the Ghana stock market has been a safe place for investors given the high rate of inflation experienced over the years under review. The objective of the study is to investigate the relationship between stock returns and inflation rate in Ghana in order to examine if the generalized Fisher hypothesis holds true for Ghana. The specific objectives are: i. To find whether the generalized Fisher hypothesis is true in the case of Ghana; ii. To find the magnitude of the effect; iii. To check for the stability of the estimated parameters. Further in this paper, the test for unit root is conducted and the empirical analysis is carried out by means of an autoregressive distributed lag (ARDL) cointegration, which permits the detection of both short- and long-run relationships. Results, discussion and final conclusions are then made. LITERATURE REVIEW According to the generalized Fisher hypothesis, equity stocks, which represent claims against the real assets of a business, may serve as a hedge against inflation. Consequently, investors would sell financial assets in exchange for real assets when expected inflation is pronounced. In such a case, stock prices in nominal terms should fully reflect expected inflation and the exante relationship between these two variables should be found positively correlated (Fisher, 1930). The argument
10551
that stock market serves as a hedge against inflation imply that investors are fully compensated for increases in the general price level through corresponding increases in nominal stock market returns. Thus, the real returns remain unaffected. In other words, the argument is that the real value of the stock market is immune to inflation pressures. This view is strongly supported by Bodie (1976), who stated that equities are a hedge against the increase of price level due to the fact that they represent a claim to real assets and, hence, the real change on the price of the equities should not be affected. In other words earnings should be consistent with the inflation rate, and therefore the real value of the stock market should remain unaltered in the long-run. However, Fama (1981) found a negative relationship between stock returns and stated that the negative association found between stock returns and inflation is the result of two underlying relationships between (1) stock returns and expected economic activity; and (2) expected economic activity and inflation. Expectation of higher future dividend account for a positive relationship between stock returns and inflation while money demand effects account for a negative relationship between expected activity and inflation. This argument is certainly plausible and is supported by compelling empirical evidence. However, something of a puzzle still remains in Fama's (1981) empirical results. Various measures of real activity did not, by themselves, entirely eliminate the negative inflation and stock returns relation. Kaul (1986) found evidence to show that the relationship between inflation and stock returns are dependent on the equilibrium process in the monetary sector and that they vary if the underlying money demand and supply factors undergo a systematic change. Boudoukh and Richardson (1993) found a strong support for positive relation between nominal stock return and inflation at a long horizon. Luintel and Paudyal (2006) found positive relationships between inflation and stock returns and that the price elasticity of the stock return was greater than unity. This they argued is theoretically more plausible because the nominal return from stock investments must exceed the inflation rate in order to fully insulate tax-paying investors. Otherwise, investors will suffer real wealth losses. Cohn and Lessard (1980) findings are consistent with the initial indications that stock prices are negatively related to nominal interest rates and inflation in a number of countries. They however stressed that the results cannot be traced to any specific investor behaviour. Their results challenged the Fisherian view that equities are real instruments whose values are unaffected by inflation. Fama (1981) and Geske and Roll (1983) offer an explanation for the negative relationship between stock returns
10552
Afr. J. Bus. Manage.
Table 1. Unit roots and stationarity tests results for the variables (stock returns (GSE) and inflation).
Variable GSE Inflation
Levels 3004.14 245.667
KPSS st 1 diff 147.452** 2.88718***
ADF Levels -0.0355 -0.2594
st
1 diff 0.6344*** -1.3245***
The asterisks *, **, *** represent significance at 10, 5, and 1% respectively.
and inflation, through a hypothesized chain of macroeconomic linkages, based on the money demand and the quantity theory of money. A number of alternative hypotheses have been advanced in the literature to explain the negative relation between inflation and stock prices and/or stock returns. These alternatives include: (i) a correlation between expected inflation and expected real economic growth (the “proxy hypothesis” suggested by Fama, 1981); (ii) the hypothesis that investors may irrationally discount real cash flows using nominal interest rates (Modigliani and Cohn, 1979); (iii) changes in the expected return and risk aversion (that is, the equity risk premium) and (iv), the inflation non-neutralities tax code which distorts accounting profits (Feldstein, 1980). Lee (1992) and Balduzzi (1995) found strong support for the proposition that more than the proxy hypothesis is at work, and particularly that the rate of interest accounts for a substantial share of the negative correlation between stock returns and inflation. Sharpe (2002) found that the negative relation between inflation and price earnings ratio was attributable partly to lower forecasted real growth in earnings. Kim (2003), using German data, gave empirical support to the proxy hypothesis of Fama (1981) and to the indicative role of stock returns on the real activity as reported by Fama (1981), Geske and Roll (1983) and Lee (1992). Similar empirical support has been found by Andrangi et al. (2002) for Brazil. Boucher (2004) found that the empirical evidence of the “proxy hypothesis” is weak. Ioannides et al. (2004) examined the relationship between inflation and stock market returns in Greece by means of ARDL cointegration, the evidence was in favour of a negative long-run relationship which is consistent with Fama (1981) and Spyrou (2001). A number of papers have tested the hypothesis in the developing economies. Chatrath et al. (1997) investigated the relationship in light of Fama‟s (1981) proxy hypothesis that centres on linkages between inflation and real activity, and between stock returns and real activity. Specifically, their study tested whether there was a negative relationship between inflation and real economic activity, and a positive relationship between real activity and stock returns. Their results from the heteroskedasticity and autocorrelation corrected OLS models provided some support for Fama‟s contentions. Amihud (1996) examined
the effects of unexpected inflation using the price reaction of CPI-linked bonds in Israel on the day following the monthly CPI announcement. The results showed a negative and strongly significant relationship thus confirming Fama and rejecting the Fisher Hypothesis. Wahlroos and Berglund (1986) tested the Fisher hypothesis on data for the Finnish economy. A significant negative relationship was found when stock returns were regressed on the rate of inflation; also, an endorsement of the proxy hypothesis. However, Lee (1998) rejected the proxy hypothesis for Hong Kong, Singapore, South Korea, and Taiwan. Based on the reviewed literature the following hypotheses are proposed for Ghana for testing purposes: H1: There is a negative relationship between inflation and stock returns. H2: There is a stable short- run relationship between inflation and stock returns. H3: There is a stable long-run relationship between inflation and stock returns. METHODOLOGY AND DATA The study first of all looked at the time series properties of the data used in the analysis since the ARDL stipulates that none of the variables should be more than I (1). Unit roots and stationarity tests The long-run relationship between stock returns and inflation crucially depends on the integration and stationarity properties of the two series. We employ two unit root tests; (1) ADF test; (2) the stationarity test suggested by Kwiatkowski et al. (1992), that is, Kwiatkowski–Phillips–Schmidt–Shin (KPSS) The Augmented Dickey Fuller (ADF) tests the null of unit root whereas KPSS tests the null of stationarity. The results are shown in the Table 1. The test results show that all variable are I (1) and that they fulfil the conditions under which ARDL can be used (Table 1). None of the variables is I (2) hence ARDL can be used to analyse data for this study. The study adopts autoregressive distributed lag approach to cointegration (ARDL) developed by Pesaran and Shin (1995). The main advantage of this procedure is that it can be applied regardless of the stationary properties of the variables in the sample and allows for inferences on long-run estimates, which is not possible under alternative cointegration procedures. In other words, this strategy may be applied irrespective of whether the series are I (0) or I (1). This paper estimates the following regression equation:
Francis and Tewari
10553
Table 2. Estimated short run coefficients ARDL model.
Regressor LSI_1(-1) C LI_1 R2 F-stat.
Coefficient 0.66237 0.021830 -0.053195 0.63606
Standard Error 0.10623 0.014506 0.014815 R-Bar2 F( 2, 32)
T Ratio [Prob.] 6.2353 [0.000] 1.5049 [0.142] 3.5907 [0.001] 0.61331 27.9628[0.000]
Autoregressive Distributed Lag Estimates; ARDL(1) selected based on Akaike Information Criterion, Dependent variable is LSI_1; 35 observations used for estimation from 1999Q2 to 2007Q4.
Table 3. Estimated Long-Run Coefficients ARDL model
Regressor C LI_1
Coefficient 0.064654 -0.15755
Standard error 0.038939 0.063381
T Ratio [Prob] 1.6604 [0.107] 2.4858 [0.018]
Estimated Long-Run Coefficients using the ARDL Approach; ARDL(1) selected based on Akaike Information Criterion; Dependent variable is LSI_1; 35 observations used for estimation from 1999Q2 to 2007Q4.
p
P
i 1
i 1
ln SI a b ln SI t i ln I t i 1 ln SI t 1 2 ln I t 1 ut ............(1) where
the log difference of the stock market index and is
(inflation).
the ,
log
difference
of
the
consumer
price
represent the short-run coefficient and
represent the long-run coefficient and
index ,
is the stochastic error
term. For the empirical analysis, the study used quarterly stock returns and consumer price index data collected from the Bank of Ghana Quarterly Bulletin and the Ghana Stock Exchange. The data covered the period between first quarter of 1998 and fourth quarter of 2007. All data used in the analysis were in the log form. Unit root test was carried out to make sure none of the data was integrated of the order two or higher, as that will violate the use of the ARDL.
RESULTS AND DISCUSSION The model was selected by AIC since it has the lowest mean prediction error. The short-run dynamics of the model is shown in Table 2. The coefficient of the inflation variable (LI_1) is -0.053195 which is statistically significant at both 1 and 5% levels of significance. This implies that a decrease in inflation rate by 1% leads to an increase in stock returns by 0.05%. This is in conformity with the view put forward by Fama (1981), what has come to be known as the proxy hypothesis. The long-run test statistics (Table 3) reveal that the inflation (LI_1)
has a long-run effect on stock returns. The coefficient of LI_1 is -0.15755 which is negative and statistically significant at 5 percent level. It suggests that in the longrun, a decrease of 1% in inflation rate is associated with an increase in stock returns by 0.158% in Ghana (Table 4). This shows that the effect of a reduction in inflation in the long-run is greater than in the short-run. Our finding is in support of findings reported by Spyrou (2001), and Pearce and Roley (1988), but contradicts the findings reported on the generalized Fisher hypothesis by Firth (1979) Gultekin (1983), and Boudhouch and Richardson (1993). Therefore, stock market is not a safe haven for investors in Ghana as inflation reduces the earnings from stock. The coefficient of the ECMt-1 (Table 4) is statistically significant. It confirms that there is a negative longrun relationship between inflation and stock returns, which also supports the view of Sharpe (2002) that market expectations of real earnings growth, particularly in the long term, are negatively related to expected inflation, and assigned decline in productivity as one of the reasons. The coefficient of the ECM coefficient –0.3378 suggests a moderate adjustment process. Nearly 34% of the disequilibria of the previews quarters shock adjust back to the long-run equilibrium in the current quarter. Overall, our findings demonstrate that the level of inflation plays important role in the performance of the GSE. The
10554
Afr. J. Bus. Manage.
Table 4. Error Correction Results for the ARDL
Regressor dC dLI_1 ecm(-1) ecm = LSI_1 R-Squared F-stat.
Coefficient 0.021830 -0.053195 -0.33763 -0.064654*C + 0.39882
Standard Error 0.014506 0.014815 0.10623 0.15755*LI_1 R-Bar-Squared F( 2, 32)
T Ratio[Prob] 1.5049[0.142] 3.5907[0.001] 3.1784[0.003] 0.36124 10.6142[0.000]
Error Correction Representation for the Selected ARDL Model; ARDL(1) selected based on Akaike Information Criterion; Dependent variable is dLSI_1; 35 observations used for estimation from 1999Q2 to 2007Q4.
Plot of Cumulative Sum of Recursive Residuals 20
15
Cumulative sum
10
5
0
-5
-10
-15
-20 1999Q2
2000Q3
2001Q4
2003Q1
2004Q2
2005Q3
2006Q4
2007Q4
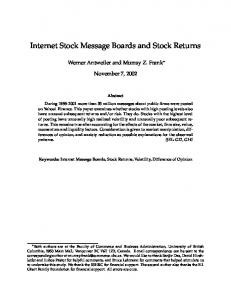
Critical bound The straight lines represent critical bounds at 5% significance level Figure 1. Plot of cumulative sum of recursive residuals of the ARDL model to test for the stability of the estimated parameters; straig ht lines represent critical bounds at 5% significance level.
high value of R2 (0.63606) for the model shows that the overall goodness of fit of the model is good and that the variation in stock returns can be explained with the changes in the price level. The F-statistics (27.9628[0.000]) measuring the joint significance of all regressors in the model are statistically significant at the 1% level of significance. The plot of the stability test results (CUSUM and CUSUMSQ) of the model are given in Figures 1 and 2. The CUSUM and CUSUMSQ plotted against the critical bound of the 5% significance level show that the model is stable over time; this can therefore be used for policy prescription.
Conclusions The paper examined the relationship between inflation and stock market returns in Ghana from the first quarter of 1998 to the fourth quarter of 2007. The empirical results show that the level of inflation has both short- and long-run negative relationship with stock returns. The short-run elasticity of -0.053195 shows that although inflation has a negative impact on stock returns it is quite marginal as compared to the long-run elasticity of 0.15755 this means that in an event of unanticipated inflation, holders of Ghanaian stock lose less in the short run than in the long-run. The study also shows that
Francis and Tewari
10555
Cumulative sum of square
1.5
1.0
0.5
0.0
-0.5 1999Q2
2000Q3
2001Q4
2003Q1
2004Q2
2005Q3
2006Q4
2007Q4
Critical bound Figure 2. Plot of cumulative sum of squares of recursive residuals of the ARDL model to test confirm the stability of the estimated parameter; straight lines represent critical bounds at 5% significance level.
although stocks have a negative relationship with inflation in Ghana the elasticity is less than unity as such inflation does not erode the benefits from Ghanaian stocks compared to Kim (2003) who found the elasticity for Germany to be -2.53. Nonetheless, this implies that if the GSE is to be the number one destination for investors, the Ghanaian government and the monetary authorities should do their possible best to control the level of that the variation in stock returns can be explained foreign capital and local ones to help the growth the industrial sector of the economy. Again, the Ghana Stock Exchange does not fully serve as a hedge against inflation as such, if the state wants to attract more portfolio capital into the country, much attention must be concentrated on the stabilization of macroeconomic variables that have a direct impact on inflation. Similarly, fund managers must invest in real assets like real estate since the value keeps up with inflation. REFERENCES Amihud Y (1996). Unexpected inflation and stock returns revisited: evidence from Israel. J. Money Credit, Bank., 28(1): 22-33. Balduzzi P (1995). Stock returns, inflation and the „Proxy Hypothesis‟: a new look at the data. Econ. Lett., 48(1): 47-53. Bank of Ghana (2008). Annual reports various issues (from 1997 to 2008) and quarterly bulletin (from first quarter 1997 to fourth quarter 2008) Bodie Z (1976). Common stocks as a hedge against inflation. J.
Financ., 31: 459-470. Boucher C (2004). Stock prices, inflation and stock returns predictability, CEPN University of Paris-Nord Version 16. Boudhouch J, Richardson M (1993). Stock returns and inflation: a longhorizon perspective. Amer. Econ. Rev., 83(5): 1346–1355. Chatrath A, Ramchander S, Song F (1996). Stock prices, inflation and output: evidence from India. Appl. Financ. Econ., 7(4): 439-45. Cohn RA, Lessard, DR (1980). The effect of inflation on stock prices: international evidence. J. Financ., 36(2): 277-289. Fama EF (1981). Stock returns, real activity, inflation and money. Amer. Econ. Rev., 71(4): 545-565. Feldstein M (1980). Inflation and the stock market. Am. Econ. Rev., 70(5): 39-47. Firth M (1979). The relationship between stock market returns and rates of inflation. J. Financ., 34(3): 743-749. Fisher I (1930). The theory of interest. New York, Macmillan. Frimpong JM (2008). Capital market efficiency: An analysis of weakform. J. Money Invest. Bank., 5: 1-8. Geske R, Roll R (1983). The fiscal and monetary linkages between stock returns and inflation. J. Financ., 38: 49-65. Gultekin NB (1983). Stock market returns and inflation: evidence from other countries. J. Finan., 38(1): 49-65. Kaul G (1987). Stock Returns and Inflation: The role of the monetary sector. J. Financ. Econ., 18(2): 253-276. Kim JR (2003). The stock return-inflation puzzle and the asymmetric causality in stock returns, inflation and real activity. Economic Research Centre of the Deutsche Bundesbank. Discussion Paper, 03/03 Kwiatkowski D, Phillips PC B, Schmidt P, Shin Y (1992). Testing the null of stationarity against the alternative of a unit root: how sure are we that economic time series have a Unit root? J. Econom., 54: 159-178. Lee BS (1992). Causal relations among stock returns, interest rates, real activity, and inflation. J. Financ., 47: 1591-1603. Lee U (1998). A test of the proxy-effect hypothesis: evidence from the pacific basin countries. Q. J. Bus. Econ., 37 (3): 40-52.
10556
Afr. J. Bus. Manage.
Luintel KB, Paudyal K (2006). Are common stocks a hedge against inflation? J. Financ. Res., 29(1): 1-19. Modigliani F, Cohn RA (1979). Inflation, rational valuation and the market. Financ. Anal J., 35: 24-44 Pearce DK, Roley VV (1988). Firms characteristics, unanticipated inflation and stock returns. J. Financ., Am. Financ. Assoc., 43(4): 965-81. Pesaran MH, Shin Y (1995). An autoregressive distributed lag modelling approach to cointegration analysis. DAE Working Paper, No. 9514.
Sharpe SA (2002). Re-examining stock valuation and inflation: the implications of analysts‟ earnings forecasts. Rev. Econ. Stat., 84: 632-648. Spyrou S (2001). Stock Returns and Inflation: Evidence From an Emerging Market. Appl. Econ. Lett., 8: 447-450. Strategic African Securities Limited (2007). SAS Investment Research. Half-Year Review of Developments on the Ghanaian Financial Markets. Retrieved on 31st July 2009 from www.sas-ghana.com.