IEEE SIGNAL PROCESSING LETTERS
1
Stopping Criteria for Non-negative Matrix Factorization Based Supervised and Semi-Supervised Source Separation Franc¸ois G. Germain, Student Member, IEEE, and Gautham J. Mysore, Member, IEEE
Abstract—Numerous audio signal processing and analysis techniques using non-negative matrix factorization (NMF) have been developed in the past decade, particularly for the task of source separation. NMF-based algorithms iteratively optimize a cost function. However, the correlation between cost functions and application-dependent performance metrics is less known. Furthermore, to the best of our knowledge, no formal heuristic to compute a stopping criterion tailored to a given application exists in the literature. In this paper, we examine this problem for the case of supervised and semi-supervised NMF-based source separation and show that iterating these algorithms to convergence is not optimal for this application. We propose several heuristic stopping criteria that we empirically found to be well correlated with source separation performance. Moreover, our results suggest that simply integrating the learning of an appropriate stopping criterion in a sweep for model size selection could lead to substantial performance improvements with minimal additional effort. Index Terms—Non-negative Matrix Factorization, Source Separation.
I
I. I NTRODUCTION
N THE past decade, methods based on non-negative matrix factorization (NMF) have become popular in a variety of fields, and in particular for audio signal processing tasks such as source separation. From its original formulation [1] and application to audio [2], multiple variants of the algorithm have been proposed to improve performance in different scenarios, through the use of cost functions such as the Euclidean distance, the generalized Kullback-Leibler (KL) divergence [1], the Itakura-Saito divergence [3] and the more general Beta divergence [4]. Other developments include temporal modeling [5]–[8] and various sparsity constraints [5], [9]–[12]. Source separation methods are commonly evaluated using the BSS evaluation metrics [13]. They consist of three scores: Source-to-Distortion Ratio (SDR), Source-to-Interference Ratio (SIR) and Source-to-Artifact Ratio (SAR) which measure the overall quality of the separation, the attenuation of the interfering sources, and the degradation of the target signal due to artifacts respectively. Recently, four new evaluation metrics Copyright c 2012 IEEE. Personal use of this material is permitted. However, permission to use this material for any other purposes must be obtained from the IEEE by sending a request to
[email protected]. F. G. Germain is with the Center for Computer Research in Music and Acoustics, Stanford University, Stanford, CA 94305 (email:
[email protected]). This work was performed while interning at Adobe Research. G. J. Mysore is with Adobe Research, San Francisco, CA 94103 (email:
[email protected]).
based on a nonlinear mapping of signal-related quantities to the results of perceptual experiments were presented as the PEASS metrics [14], in order to improve matching of the perceptual quality and BSS evaluation scores. The PEASS metric that is used to measure the overall quality of the separation is Overall Perceptual Score (OPS). For speech separation, metrics such as the Short-Time Objective Intelligibility Measure (STOI) [15] that measure speech intelligibility degradation can be valuable as well. While the number of NMF-based methods are growing, many questions remain on how to choose the best technique, with the best model size for a given task. A recent study [16] addresses the question of optimizing some of the parameters of NMF-based source separation. Another issue arises from the fact none of the evaluation metrics are formally related to the algorithm cost function. Although consecutive iterations of the algorithm are guaranteed to monotonically improve the cost function value, there is no guarantee that they will improve the performance with respect to the evaluation metric of interest. A recent study [17] shows the mismatch between PEASS scores and cost optimization for a class of NMF-based source separation algorithms. It does not address supervised and semisupervised source separation or the mismatch between cost, BSS and STOI metrics. Moreover, no guideline is provided as to how to choose a stopping criterion to alleviate this issue. In this paper, we examine the correlation between the cost optimization of NMF-based supervised and semi-supervised source separation and the BSS, PEASS, and STOI scores. Then, we propose several heuristic stopping criteria to alleviate the mismatch between those quantities. In Section II, we present the algorithms. In Section III, we present the results of empirical convergence analysis of these algorithms and the associated performance metrics. In Section IV, we propose our criteria and present the results of validation experiments. II. A LGORITHMS NMF-based source separation algorithms take advantage of the non-negative nature of the spectrogram X = |X |↵ , with X the signal short-time Fourier transform (STFT) and ↵ > 0, to approximate it as X ⇡ WH through the optimization: argminW,H
0
D(X||WH)
(1)
with W and H non-negative matrices. The columns of W can typically be interpreted as the spectral basis vectors of the sources in the spectrogram. The matrix H can then be
2
IEEE SIGNAL PROCESSING LETTERS
−20
−10
Cost function log−derivative
interpreted as the activity of each vector in a given time frame. Here, we use the magnitude spectrogram (↵ = 1) and the generalized KL divergence as cost function as it is commonly ˆ = WH, it is defined as: used in source separation. For X ⇣ ⌘ X ˆ = ˆ i,j ˆ i,j (2) D(X||X) Xi,j log Xi,j /X Xi,j + X
ˆS ˆN X X X and XˆN = X (3) ˆ ˆ ˆ ˆN XS + XN XS + X 6) Compute the inverse STFT of Xˆi to get an estimate of each source signal. This algorithm corresponds to supervised separation, where training data is available for both sources. In the case in which training data is available for only one of the sources (for example speech, as is often the case for speech denoising), semi-supervised separation can be performed, by modifying the pipeline such that only WS is learned in step 2, while WN and H are learned simultaneously from X in step 3. XˆS =
III. E MPIRICAL C ONVERGENCE A NALYSIS A. Task For the purpose of analyzing the convergence properties of both supervised and semi-supervised NMF-based source separation, we examine the case of speech denoising. In this application, we are given a mixture of speech with background noise, on which we apply the source separation algorithm, with a particular focus on 1) a clean reconstruction of the speech, and 2) a significant reduction of the noise level. In both cases, speaker-dependent training data is available, while noise training data is available only in the supervised case. To evaluate the results, we focus on the metrics relative to the estimated speech signal and its ground truth. Spectrograms were computed using a 1024-sample Hann window with 75% overlap. For both supervised and semisupervised algorithms, we trained speaker- and noisedependent models WS and WN from the training data with the following number of vectors (KS for speech, KN for noise): (KS , KN ) = {(20, 5), (20, 150), (5, 50), (50, 30)}. We motivate those choices in Section IV. Models of individual
KS=20 − KN=150 KS=5 − KN=50
−10
−10
KS=50 − KN=30
0
−10
−10
i,j
−10
Cost function log−derivative
The typical pipeline to perform NMF-based source separation in the presence of two sources, say speech and noise, follows the process detailed in [18], (derived from the equivalent perspective of Probabilistic Latent Component Analysis): 1) Compute the spectrograms XS and XN from the speech and noise training data, as well as the spectrogram X of the test mixture signal. ˜ i , for i = S, N 2) Factorize the spectrograms Xi ⇡ Wi H ⇥ ⇤ using NMF and form the matrix W = WS WN . 3) Learn the activations H from the test mixture spectrogram while keeping W fixed: X ⇡ WH. HS 4) Partition the activations as H = , and construct HN ˆ i = Wi Hi . estimated spectrograms X ˆ i and 5) Construct two time-frequency masks from the X extract estimated STFTs of each source through Wienerlike filtering of the mixture STFT X :
KS=20 − KN=5
−5
−10
0
−10
0
10
1
10
2
10
3
10
4
10
Number of iterations
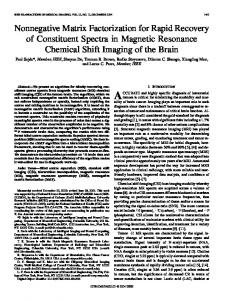
Fig. 1. Average cost function log-derivative value for the supervised (top) and the semi-supervised (bottom) algorithm with 4 sets of model sizes.
sources were trained (from isolated training data) until the cost Dn (at iteration n) verifies |Dn+1 Dn | < 10 4 |Dn |. The separation performance scores on the mixtures were computed along a logarithmic grid of iteration numbers accounting for the fact that the variations of the studied quantities become smaller as we reach large iteration numbers. B. Data For speech data, we use the utterances from 600 speakers of the TIMIT dataset [19] recorded at a sampling rate of 16kHz. The utterances for a given speaker are divided into training and testing segments. For noise data, we use samples from two datasets, for a total of 30 different noise types: The NOISEX-92 dataset [20] contains examples of quasistationary noises (e.g., factory, helicopter, jet aircraft). The second dataset [21] contains examples of non-stationary noises (e.g., frogs, keyboard, ringtones). The data for a given noise type is divided into training and testing segments (the training data was not used in the case of semi-supervised separation). A test utterance for each speaker is mixed with a single type of test noise for a total of 600 test mixtures (20 mixtures per noise type). Each test mixture is 5 seconds long, and is associated with at least 17 seconds of training data for speech and noise. C. Results In setting stopping criteria for an iterative optimization algorithm, we often use D(X||WH) as only available measurable quantity in practical scenarios. It is common to set a threshold ✏ > 0 on the relative variation of the cost function value instead of the absolute variation for the criterion to become scale-independent as in |Dn+1 Dn | < ✏|Dn |. This corresponds to a discretization of a threshold on the cost 1 dD function log-derivative value D dn with respect to the number of algorithm iterations n (for conciseness, we omit here the absolute value). Our results show that this quantity is roughly a linear function of the number of iterations in the loglog domain for both the supervised and the semi-supervised algorithms (Fig. 1). They also show that the log-derivative
GERMAIN AND MYSORE: STOPPING CRITERIA FOR NON-NEGATIVE MATRIX FACTORIZATION BASED SOURCE SEPARATION
8
SDR (dB)
SDR (dB)
9 8 7
6 4 2
6 16
25
14
SAR (dB)
SAR (dB)
3
12 10
20 15 10
8 16
12
SIR (dB)
SIR (dB)
14 12 10 8
10 8 6 4 40
OPS (%)
OPS (%)
40
30
20
30 20
0.8 0.8
STOI
STOI
0.78 0.76
0.6
0.74 0.4
0.72 0
10
1
10
2
10
3
10
4
10
Number of iterations
0
10
1
10
2
10
3
10
4
10
Number of iterations
Fig. 2. From top to bottom: Average SDR, SAR, SIR, OPS and STOI scores for the supervised algorithm (legend: see Fig. 1).
Fig. 3. From top to bottom: Average SDR, SAR, SIR, OPS and STOI scores for the semi-supervised algorithm (legend: see Fig. 1).
value behavior at a given iteration is mostly independent of the model sizes KS and KN . While the variation of the average cost function logderivative value is roughly monotonic, this does not match the behavior of the overall scores in the source separation metrics. For the supervised algorithm, the average SDR, OPS and STOI scores reach their maximum before slowly decreasing at each additional iteration, but the degradation of the score is limited (Fig. 2). Except for the OPS score of (KS , KN ) = (50, 30), we can make a similar observation for the semi-supervised algorithm. However, the scores now decrease more significantly for each additional iteration beyond the maximum (Fig. 3). The SAR appears to be monotonically decreasing for both algorithms after a few iterations, but that degradation is much faster for the semi-supervised algorithm. The SIR appears to increase monotonically and then in most cases degrades after reaching a maximum value, similar to the SDR. This is more pronounced in the semi-supervised algorithm. This suggests that the noise model starts learning parts of the speech patterns. We notice that the performance ranking between model sizes changes significantly over iterations for SDR, OPS and STOI, and that, in general, larger KS and smaller KN seem to require more iterations to reach the maximum average score. The fact that the variation of the cost function log-derivative value is independent of the model sizes Ki (Fig. 1), while the scores are strongly Ki -dependent (Figs. 2, 3), suggests that arbitrary stopping criteria are likely to lead to sub-optimal results, and
that no simple Ki -independent relationship exists between the optimal interation number and the cost function value. IV. P ROPOSED STOPPING CRITERIA We cannot measure the performance scores without ground truth data, which is not available in real world scenarios. Therefore, considering the non-monotonic relation between the convergence score and performance scores, it seems crucial to find a stopping criterion based on a measurable quantity that would maximize performance scores. It is also an important issue to consider when searching for the best set of model sizes for a given application, and could be considered as an integral part of the sweep for model size selection when looking for the most performant setup. We explore the performance in SDR and OPS of two heuristics based on the cost function log-derivative values, and three heuristics based on the number of iterations. To do so, we run a 30-fold cross-validation on the test data by using 1 single type of noise for each fold (20 mixtures). We take one fold as the evaluation set and the other 29 folds as development set. By construction, the speakers in those two sets are always different. For each development set mixture, we record the iteration number and the associated cost function log-derivative value at which the best performance score is measured. We then look at the average of the distribution of the following quantities at these optimal values on the development set results:
IEEE SIGNAL PROCESSING LETTERS
OPS
SDR
OPS
SDR
4
KS KN Optimal dD log dD D D 20 5 9.64 9.33 9.63 20 150 6.47 5.51 6.05 5 50 7.05 6.29 6.61 30 50 9.32 8.86 9.26 20 5 42.73 23.14 41.42 20 150 44.38 39.68 41.79 5 50 43.47 41.11 41.37 30 50 39.75 20.88 39.07 20 5 7.57 6.94 6.83 20 150 9.26 8.89 8.69 5 50 7.4 6.16 5.95 30 50 7.36 6.7 6.58 20 5 27.8 19.88 25.72 20 150 43.64 40.61 41.18 5 50 43.14 39.53 40.46 30 50 36.88 12.22 33.9
Iter. log-Iter. Max. aver. 9.63 9.63 9.63 5.94 6.05 6.14 6.52 6.62 6.67 9.26 9.26 9.26 41.49 41.49 41.41 33.6 41.88 42.06 32.81 41.44 41.58 39.14 39.06 39.14 6.76 6.92 7.09 8.85 8.96 8.98 6.97 7.13 7.23 5.42 6.66 6.75 25.9 25.69 25.82 38.76 40.97 41.33 25.08 41.05 40.89 34.57 33.92 34.57
TABLE I
C OMPARISON OF PERFORMANCE METRICS AT THE ITERATION NUMBER THAT YIELDS THE HIGHEST SDR AND OPS SCORES (O PTIMAL ) AND THE ITERATION NUMBERS OBTAINED FROM THE PROPOSED FIVE HEURISTICS ( SEE S ECTION IV) FOR THE SUPERVISED ( TOP ) AND SEMI - SUPERVISED ALGORITHMS ( BOTTOM ). T HE METRICS OBTAINED FROM THE 4TH AND THE 5TH HEURISTICS ARE TYPICALLY CLOSE TO OPTIMAL .
cost function log-derivative value logarithm of the cost function log-derivative value • number of iterations • logarithm of the number of iterations Additionally, we consider a fifth stopping criterion where we use the iteration number corresponding to the maximum average score on the development set as stopping criteria. We then use these values as stopping criterion (either on the number of iterations or the cost function log-derivative value) on the evaluation samples, and record the score obtained when the algorithm is stopped. The average scores for both the supervised and the semi-supervised algorithms and for both the BSS and PEASS overall metrics are then compared to the average true optimal score on each individual mixture. For the supervised algorithm (Table I - top), the 2nd , 4th and th 5 heuristics consistently achieve scores close to optimality. By using the 5th criterion (iteration number of maximum average score), the performance loss is on average 0.20dB for the SDR and 1.54% for the OPS compared to optimality. For the semi-supervised algorithm (Table I - bottom), the 4th and 5th heuristics achieve scores close to optimality. With the 5th criterion, the average performance loss of 0.39dB for the SDR and 2.21% for the OPS compared to optimality. Based on our experiments, we believe that a general method to perform model size selection in an NMF-based source separation problem, taking stopping criteria into account, is: 1) Gather a dataset from sources you would like to separate and build a training set of with isolated segments and an independent development set with synthesized mixtures. 2) Train models of different sizes Ki on the training set, then run the separation algorithm on the development mixtures for 500 iterations. Compute the cost and metric of interest at every iteration (or once every few iterations), and find the optimal iteration number and its cost function value for each mixture with each set of Ki . 3) Compute the value associated with the chosen stopping • •
KS \KN 5 10 20 30 50 70 100 Best 8.7 8.8 8.5 8.2 7.7 7.3 6.8 5 No. 10 10 10 7 7 7 7 Fixed 5.9 3.7 2.1 1.3 0.6 0.3 0.0 Best 8.5 8.9 9.1 9.2 9.2 9.1 9.0 10 No. 30 15 10 10 10 10 10 Fixed 7.7 6.2 4.6 3.8 2.8 2.3 1.9 Best 8.1 8.3 8.6 8.8 9.1 9.2 9.3 20 No. 100 30 20 20 15 15 15 Fixed 8.1 7.7 6.7 6.0 5.1 4.6 4.1 Best 7.7 7.9 8.2 8.4 8.7 8.8 9.0 30 No. 200 50 30 30 20 20 15 Fixed 7.7 7.8 7.4 7.0 6.3 5.8 5.4 Best 7.1 7.4 7.6 7.7 8.0 8.2 8.4 50 No. 500 200 70 50 30 30 30 Fixed 6.8 7.3 7.5 7.5 7.2 7.0 6.7
150 6.2 7 -0.2 8.8 10 1.6 9.4 10 3.7 9.2 15 4.9 8.6 20 6.4
200 5.8 7 -0.2 8.5 10 1.5 9.4 10 3.5 9.3 15 4.7 8.8 20 6.2
TABLE II SDR SCORES RECORDED AT THE ITERATION NUMBER FOR THE PROPOSED MAXIMUM AVERAGE SCORE HEURISTIC (B EST ) AND THE CORRESPONDING ITERATION NUMBER (N O .) COMPARED TO THE SDR SCORE WHEN USING A FIXED NUMBER OF 100 ITERATIONS (F IXED ).
criterion either as the average of the associated quantity at the optimal iteration for each mixture, or as the number of iterations where the best average score was found. The optimal model sizes and stopping criterion will then be the one with the highest average performance. 4) Use the above optimal model sizes and stopping criterion when performing separation of test samples. In the case of semi-supervised NMF, we can see in Fig. 3 that an arbitrary choice of number of iterations or cost can lead to a suboptimal choice of model sizes if the iteration number is not optimized as well. We run this algorithm on our test data set (600 mixtures) and record the SDR scores at iterations {3, 5, 7, 10, 15, 20, 30, 50, 70, 100, 150, 200, 300, 500}. We compare the best average score at the given iteration number (the 5th criterion) to the average score recorded at a fixed number of 100 iterations as this is commonly used in the literature (Table II). From this table, we see that the performance at 100 iterations for given model sizes is often much lower than the one at the best number of iterations. Additionally, the best model sizes are different if the iteration number is included as variable, with a gain of 1.3dB SDR for only 10 iterations. From this results, we choose the model sizes (KS , KN ) used in the plots of Section III as the best set at 100 iterations (20, 5), the best set overall (20, 150), and two other sets (5, 50) and (50, 30) for demonstration purposes. V. C ONCLUSION AND F UTURE W ORK We have shown a clear mismatch between the optimization of the cost function and the optimization of common performance metrics in NMF-based supervised and semi-supervised source separation algorithms. We also proposed empirical stopping criteria that were more closely correlated with the optimal value of the performance metrics of interest, and validated these criteria with speech denoising experiments. Our approach is likely to be useful for a wide variety of applications that use iterative algorithms in which the performance metric of interest is not directly optimized.
GERMAIN AND MYSORE: STOPPING CRITERIA FOR NON-NEGATIVE MATRIX FACTORIZATION BASED SOURCE SEPARATION
R EFERENCES [1] D. Lee and S. Seung, “Algorithms for non-negative matrix factorization,” in NIPS. MIT Press, 2000, pp. 556–562. [2] P. Smaragdis and J. Brown, “Non-negative matrix factorization for polyphonic music transcription,” in Proceedings of the 2003 IEEE Workshop on Applications of Signal Processing to Audio and Acoustics (WASPAA), 2003, pp. 177–180. [3] C. F´evotte, N. Bertin, and J. Durrieu, “Nonnegative matrix factorization with the Itakura-Saito divergence: With application to music analysis,” Neural computation, vol. 21, no. 3, pp. 793–830, 2009. [4] C. F´evotte and J. Idier, “Algorithms for nonnegative matrix factorization with the -divergence,” Neural Computation, vol. 23, no. 9, pp. 2421– 2456, 2011. [5] T. Virtanen, “Monaural sound source separation by nonnegative matrix factorization with temporal continuity and sparseness criteria,” IEEE Transactions on Audio, Speech, and Language Processing, vol. 15, no. 3, pp. 1066–1074, 2007. [6] G. J. Mysore, P. Smaragdis, and B. Raj, “Non-negative hidden Markov modeling of audio with application to source separation,” in Proceedings of the 9th international conference on Latent variable analysis and signal separation, ser. LVA/ICA’10. Berlin, Heidelberg: SpringerVerlag, 2010, pp. 140–148. [7] N. Mohammadiha, P. Smaragdis, and A. Leijon, “Prediction based filtering and smoothing to exploit temporal dependencies in NMF,” in Proceedings of the 2013 IEEE International Conference on Acoustics, Speech and Signal Processing, 2013, pp. 873–877. [8] C. F´evotte, J. Le Roux, and J. Hershey, “Non-negative dynamical system with application to speech and audio,” in Proceedings of the 2013 IEEE International Conference on Acoustics, Speech and Signal Processing, 2013, pp. 3158–3162. [9] B. Gao, W. Woo, and S. Dlay, “Variational regularized 2-d nonnegative matrix factorization,” IEEE Transactions on Neural Networks and Learning Systems, vol. 23, no. 5, pp. 703–716, May 2012. [10] D. L. Sun and G. J. Mysore, “Universal speech models for speaker independent single channel source separation,” in Proceedings of the 2013 IEEE International Conference on Acoustics, Speech and Signal Processing (ICASSP), 2013. [11] O. Zoidi, A. Tefas, and I. Pitas, “Multiplicative update rules for concurrent nonnegative matrix factorization and maximum margin classification,” IEEE Transactions on Neural Networks and Learning Systems, vol. 24, no. 3, pp. 422–434, March 2013. [12] V. Tan and C. Fevotte, “Automatic relevance determination in nonnegative matrix factorization with the -divergence,” IEEE Transactions on Pattern Analysis and Machine Intelligence, vol. 35, no. 7, pp. 1592– 1605, July 2013. [13] E. Vincent, R. Gribonval, and C. Fevotte, “Performance measurement in blind audio source separation,” IEEE Transactions on Audio, Speech, and Language Processing, vol. 14, no. 4, pp. 1462–1469, 2006. [14] V. Emiya, E. Vincent, N. Harlander, and V. Hohmann, “Subjective and objective quality assessment of audio source separation,” IEEE Transactions on Audio, Speech, and Language Processing, vol. 19, no. 7, pp. 2046–2057, 2011. [15] C. H. Taal, R. C. Hendriks, R. Heusdens, and J. Jensen, “A shorttime objective intelligibility measure for time-frequency weighted noisy speech,” in Proceedings of the 2010 IEEE International Conference on Acoustics Speech and Signal Processing (ICASSP), March 2010, pp. 4214–4217. [16] B. King, C. Fevotte, and P. Smaragdis, “Optimal cost function and magnitude power for NMF-based speech separation and music interpolation,” in Proceedings of the 2012 IEEE International Workshop on Machine Learning for Signal Processing, 2012, pp. 1–6. [17] D. Fitzgerald and R. Jaiswal, “On the use of masking filters in sound source separation,” in Proceedings of the 15th Internation Conference on Digital Audio Effects. Dublin Institute of Technology, 2012. [18] P. Smaragdis, B. Raj, and M. Shashanka, “Supervised and semisupervised separation of sounds from single-channel mixtures,” in Proceedings of the 7th International Conference on Independent Component Analysis and Signal Separation, ser. ICA’07. Berlin, Heidelberg: Springer-Verlag, 2007, pp. 414–421. [19] J. Garofolo, L. Lamel, W. Fisher, J. Fiscus, D. Pallett, and N. Dahlgren, DARPA TIMIT acoustic-phonetic continuous speech corpus CD-ROM. National Institute of Standards and Technology, NISTIR 4930, 1993. [20] A. Varga and H. Steeneken, “Assessment for automatic speech recognition: II. NOISEX-92: A database and an experiment to study the effect of additive noise on speech recognition systems,” Speech Communication, vol. 12, no. 3, pp. 247–251, 1993.
5
[21] Z. Duan, G. J. Mysore, and P. Smaragdis, “Speech enhancement by online non-negative spectrogram decomposition in non-stationary noise environments.” in Proceedings of INTERSPEECH 2012. ISCA, 2012.