storage units: possible improvements for voltage control of mv ... - PSCC
Recommend Documents
the test network (based on a real MV grid) are given. Keywords: distributed generation, active distribution network, voltage control, optimization, storage.
Abstract â In the paper a novel approach to overcur- rent protection stabilisation based on Fuzzy Logic tech- nique is presented. The scheme is intended for MV ...
Oct 5, 2018 - direct sensitivity analysis method," in 2016 IEEE International Energy ...... 102. 4.6.1. Case 1. In the first case, it is assumed that DG active and reactive ...... [86] C37.010-1979, âIEEE application guide for AC high-voltage circu
Abstract. The main objective of this paper is to describe a strategy to deal with the voltage/reactive power problem for a. MV distribution network integrating ...
Keywords: Optimisation, probabilistic approaches, distribution network planning, Distributed Generation. 1 INTRODUCTION. The need for more flexible electric ...
and system performances originated from a Load Frequency. Control (LFC) can
be ... of a situation surrounding Load Frequency Control (LFC). First, the all six ...
Also, the best particle of. Pbest gives the gbest (the best agent of the group). ..... Full-text · Conference Paper · Oct 2016 · Renewable and Sustainable Energy ...
AbstractâThis paper addresses the problem of reactive power control of distributed generation (DG) units in the medium voltage (MV) distribution systems in ...
Converter (VSC) and an Interline Power Flow Controller. (IPFC) and the design of
the power flow control for the. IPFC. The proposed controller has merits such ...
Page 1. Voltage (mV). C u rrent (pA). -.25 .25 .50. Bath solution control. DMSO control. -100. -50. 50. 100 n = 6-12. 0. 0. -0.25.
ELECTROMAGNETIC TRANSIENTS PROGRAM ... Carlo Analysis, Digital Simulation, Transient Analy- ... rms voltage, followed by a recovery within 1 minute. A.
sents about 5,500,000 green tonnes, although the po- ... that of the John Deere due to the fact that in the latter bundling is faster and it produces bundles with significantly more dry mass. ..... Patterson DW, Pelkki MH, Steele PH, 2008.
Abstract - A smart relay scheme for long term voltage in- stability phenomena is proposed. The method, called VIP++ is based on local area measurements and ...
describe the pitch dead zone, i.e. only pitch angles exceeding these values will be ac- cepted as control commands. right: Roll angles. Ïmax,Ï+. 0 ,Ï0,Ïâ.
Jun 27, 2018 - Masoud Aliakbar Golkar. Faculty of Electrical Engineering, K. N. Toosi University, Tehran, Iran, [email protected]. Ali Elkamel. College of ...
sues for offshore wind farms like: wind turbines and con- nections to the system are .... Due to simple construction and low investment costs this system is very ...
The voltage stability problem with voltage collapse as its final consequence is an ... response is dominated by dynamic behaviour of an LTC transformer, an ..... to initial voltage drop, the restoration of the composite load consumption followed.
ABSTRACT various ways to control losses due to magnetic insulation failure and impedance mismatches. Kernforschungszentrum, Karlsruhe, West.
Vattenfall-ET, Germany; Swissgrid, Switzerland; Universidad Pontificia Comillas Madrid, Spain; VirginiaTech, USA [email protected]. Abstract â New challenges to ...
FC1008, FC1012. Control units. Conventional. ○ 8 or 12 zones (FD1008-D with
7 zones). ○ Compatible with all conventional Siemens detector series.
The heat transfer innovators. Integrated Heat Transfer Equipment for Heating and
Cooling. -150°F to +750°F. Temperature Control Units ...
system through the concept of sve control coordination for voltage regulation, in linearized ...... Hydro-Quebec power system using the eigenvalue technique. ...... The state-~pace rcpresentatlOn of the voltage magnitude measurement bloek is.
Aug 3, 2017 - (3) An algorithm test methodology was proposed (Section 4);. (4) The performances of the .... All the capacitor banks have 8 steps, with the step.
storage units: possible improvements for voltage control of mv ... - PSCC
to increase the hosting capacity of the network by means of. Voltage control of ... directly by the Distribution Company in order to increase network ... A dedicated.
STORAGE UNITS: POSSIBLE IMPROVEMENTS FOR VOLTAGE CONTROL OF MV DISTRIBUTION NETWORKS Diana Moneta, Alberto Gelmini, Claudio Carlini, Mario Belotti Ricerca sul Sistema Energetico – RSE Milano, Italy [email protected]
Abstract – In recent years several studies regarding optimal operation of distribution networks in presence of Distributed Generation (DG) were proposed. This paper describes an algorithm developed by RSE (“DISCoVER”) to increase the hosting capacity of the network by means of Voltage control of Medium Voltage feeders in presence of storage units. The system, which coordinates controllable resources present in the MV network connected to the HV/MV transformer, is conceived to compute the set-points of the distributed energy resources (generators, loads, storage) controllers and On Load Tap Changer (OLTC) in realtime according to specified economic and technical objectives. It is assumed that storage units are operated directly by the Distribution Company in order to increase network control capabilities. The algorithm is based on an AC Optimal Power Flow (OPF) where losses and integral constraints are taken into account. Starting from forecasted load and generation, real measurements from field and considering technical constraints and dispatching costs for active and for reactive power, the algorithm generates for each time period a set of commands for controllable resources that guarantees achievement of technical goals minimizing the overall dispatching cost. The paper describes the general problem, how different resources are managed by the algorithm with respect to their technical and economic features, and some further details regarding storage units (main technical characteristics, time horizon for integral constraint, indicative operation costs and their effect on Voltage Control). Preliminary results achieved from simulation activity on the test network (based on a real MV grid) are given.
Keywords: distributed generation, active distribution network, voltage control, optimization, storage. 1 INTRODUCTION The advancement of medium size generating technologies together with new requirements of security and quality of power supply and the liberalisation of the electricity market, is driving the evolution of electricity distribution networks. In recent years several studies regarding optimal operation of distribution networks in presence of Distributed Generation (DG) were proposed. According to definition set by CIGRE WG C6.11 [1], “Active distribution networks (ADNs) have systems in place to control a combination of distributed energy
17th Power Systems Computation Conference
resources (DERs), defined as generators, loads and storage. Distribution system operators (DSOs) have the possibility of managing the electricity flows using a flexible network topology. DERs take some degree of responsibility for system support, which will depend on a suitable regulatory environment and connection agreement”. Following that definition, this paper describes an algorithm developed by RSE to increase the hosting capacity of the network by means of Voltage control of Medium Voltage (MV) feeders in presence of storage units operated by the DSO. Unlike some general algorithms regarding optimization of network operation, the procedure here depicted follows a practical approach, including cost aspects in a technical evaluation. The goal is to identify an admissibile condition for a MV network in presence of DG, with the minimum dispatching cost for the DSO. It’s worth remembering that the Italian Energy Autorithy has recently published a resolution granting increased rewards to DSOs implementing pilot projects supporting diffusion of DG [2]. 2 VOLTAGE CONTROL The objective of the activity here depicted is to increase the hosting capacity of the network by means of voltage control of Medium Voltage feeders –even in presence of storage units. It is based on a optimization procedure to minimize costs of control strategies needed to satisfy technical constraints. The assumptions adopted in the problem are the following: • Spatial perimeter: MV network under a Primary Substation (in a fixed configuration); • Temporal horizon: current network status (from State Estimation) and following 24 h; As additional input, the controller may count on load and generation forecast; to maintain all parameters within desired ranges it relies on different resources, both “internal” and “external”, of increasing cost: • On Load Tap Changer (OLTC) and capacitor banks: operated by DSO; • Reactive power injection/absorption from controllable resources (sub-set of DERs); • Active power from controllable resources (sub-set of DERs); • Storage unit(s): directly operated by the DSO.
Stockholm Sweden - August 22-26, 2011
Costs of internal resources and rewards for controllable generators (inverter-based or with a synchronous interface) have to be included in the central optimization algorithm in order to determine the miminum cost for control actions.
3.2 Storage technologies for network operations Applications of storage units for T&D and ancillary services are now widely known but not yet fully deployed [3], especially because of high installation cost and not fully clear benefits. Currently, most promising technologies for Power Quality applications and voltage regulation are:
Different “business models” for ancillary services offered by DERs are possible: • Administrated price: fixed price established by the Autority; • Market scheme: DER operators fix prices for their services (not fully realistic for MV networks); • Mixed approach. The algorithm here described allows to specify different rewards for each resource. A dedicated research activity has been started to explore how different reward scenarios may affect control capabilities and benefit/cost results. 3
CONTROLLABLE RESOURCES: STORAGE UNITS
3.1 General applications Storage units installed together with RESs are a growing application [3][4][5] but from a “control” point of view a RES+Storage combination becomes quite similar to a ‘normal’ forecasted and dispatchable unit (in fact, that is the main scope of the application). This paper focuses on storage unit(s) operated directly by DSO just to enhance network performances. It’s worth underlining that proper siting and sizing of storage units is out of the scope of the present paper, and they are considered as a element of the problem; as “rule-of-thumb”, storages should be placed barycentrically to renewable generation, to stabilize voltage profile on a given feeder. In any case, the proposed environment supports cost effective identification of proper storage siting. As detailed in following paragraphs, their presence requires a complex solving approach: because storage units on the whole should maintain a desired energy level, this involves to resolve simultaneously more temporal intervals (for instance 96 quarter of hours for a day) with integral constraints in the optimization problem. In the following paragraph some basic details about main storage techologies are reported.
17th Power Systems Computation Conference
Lead acid Nickel-Cadmium (Ni/Cd) Ni-metal hydrate (Ni-MeH) Sodium-Solphure (Na/S) Sodium-Nickel cloride (Zebra™) Lithium ion Lithium ion-Polymer Vanadium Redox (VRB).
Additionally, supercapacitors (SC) may represent a good choice thanks to their longer expected life (up to 106 cycles). Employed together with above listed storage technologies they could help to supply peak power and to improve power quality. The following Ragone chart shows the relationship between energy density and power density for the above mentioned technologies. 1’000
Energy density [Wh/kg]
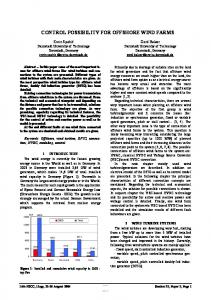
Fig. 1: simplified scheme of a MV network with DERs and controllable resources.
• • • • • • • •
10 h
1h
NaS Zebra
100
0.1 h
Li
36 s
Ni-MeH Ni/Cd
VRB
lead-acid
10
3.6 s
SuperCapacitors
0.36 s
1
0.1
10
100
1’000
10’000
Power density [W/kg]
Fig. 2: simplified Ragone chart (extracted from [3]).
With reference to voltage regulation, size typically ranges in 1-10 MW, while autonomy is requested in the 10-100 minutes range. For a given application, choice depends not only on size and autonomy but also on efficiency (charge/discharge) and expected lifetime (cycles). In the future, MV recharge stations for electric vehicles might represent a possible resource [6] [7]. Figure 3 shows an estimation of cost x cycle for each relevant technology expressed as €/(kWh•cycle) [3], calculated with reference to average (or estimated for newer applications) values for expected lifetime (total cycles) and installation cost. In some cases, higher installation cost combined with longer expected lifetime leads to an average cost lower than other technologies: Vanadium Redox (VRB) represents a good example, thanks to its extraordinary estimated lifetime (up to 10’000 cycles). On the other side, attractive installation costs sometimes are combined with short life span, causing a less interesting average cost per cycle, as in the case of Ni-MeH technology.
Stockholm Sweden - August 22-26, 2011
The above constraint expressed by equations become: • active and reactive power balance:
cost x cycle [€/kWh cycle]
1.00
TAi , j + IAi = 0;
0.80
TRi , j + IRi = 0
j∈αi
0.60 0.40 0.20
VR B
ly nP o
n
TAi , j =
Fig. 3: cost per cycle of different storage technologies (estimation, from [3]).
Vi ⋅ V j ⋅ K i , j zi , j
min (f ) = min p ,c
where: pi ci πG πL NG NL p, c
p ,c
NG i =1
π Gi (p i ) −
NL i =1
π Li (c i )
(1)
displacement for i-th controllable generator displacement for i-th controllable load cost for displacement p of i-th controllable generator cost for displacement c of i-th controllable load number of controllable generators number of controllable loads total cost for controllable resources.
⋅ sin (ϑi − ϑ j − δ i , j ) +
Vi ⋅ V j ⋅ K i , j zi , j
⋅ cos (ϑi − ϑ j − δ i , j ) + Vi 2 ⋅
active and reactive power balance, for all nodes (N); current on branches; voltage on nodes; power injection and absorption by generators and controllable loads in each time period; e) constraints on storage charge and discharge (independent from energy level); f) minimun and maximum allowed charge level for the battery; g) stored energy in the last time period.
17th Power Systems Computation Conference
cos δ i , j zi , j
−
yi , j 2
reactive power from i to j; Ki,j zi,j
δi,j yi,j
transformation ratio of connection i, j; longitudinal impedance module of connection i,j; longitudinal impedance loss angle of connection i,j; shunt susceptance of connection i,j.
• Currents: transit limit from node i to node j:
TI i , j =
1 TAi2, j + TRi2, j ≤ TI ij 3 ⋅ Vi
• Energy in storage units:
Emin − E0 E − E0 ≤ pI acc − pPacc ≤ max ∆Ti ∆Ti t =1,..,Ti t =1,..,Ti with Ti = 1÷NI (time periods).
(3)
(4)
In order to establish the control possibilities, the algorithm must know the capability curve of each dispatchable resources [8]; DISCoVER is able to manage complex curves, but for the scope of this analysis the “rectangle” simplification was adopted (see Figure 4). Q
Qmax
Technical constraints included in the optimization problem are the following: a) b) c) d)
Vi 2 ⋅ sinδ i , j zi , j
active power from i to j; TRi , j = −
4 OPTIMIZATION: ALGORITHM The objective of the optimization procedure (named DISCoVER) is to determine, starting from a set of operating values fixed for a series of time periods, an admissibile condition for a MV network in presence of DG, with the minimum dispatching cost for the DSO. The main part of the DISCoVER algorithm is represented by an optimal power flow (OPF), that determines the admissible working point, ‘optimal’ according to the criteria defined in the objective function. That OPF calculates network losses, too, which are then evaluated at the marginal cost of energy. As stated before, each controllable resource has its own cost to be considered in the objective function f to be minimized (1):
(2)
number of nodes of the network; active power injection from node i; reactive power injection from node i; set of nodes connected to node i;
Li - io
Li -io
am et al N
N
N
a/ S
eH i-M
i/ C d N
Le
ad
ac
id
0.00
where: • N IAi IRi αi
i = 1,..., N
j∈αi
Pmin
cosφ =0.9
Pmax
P
Qmin
Fig. 4: example of simplified capability curve for a PV plant.
In a given time period (“section”), DISCoVER splits each controllable resource as three different sources: a fixed point (SPe), that is the starting estimated setpoint,
Stockholm Sweden - August 22-26, 2011
one “generator” (GP) and one “load” (GC) with reference to the capability limits as above detailed and reported in Figure 4. So, using this effective artifice, the optimization procedure find three separate capability curves (Figure 5): the first curve bordered by minimum Pmin value and SPe (GC), a second one delimited by SPe and maximum Pmax value (GP), the last one compressed to P and Q’s punctual values (SPe). Regarding the reactive power, GP can assume only positive Q displacements while GC only negative ones. GC and GP are independent, but one source will assume positive displacements while the other the negative changes. From SPe, DISCoVER then can calculate total ∆P (increase or decrease), ∆Q (reactive or inductive) and relevant cost for each displacement from the starting point. Finally, a special tool in the general algorithm provides a conversion of fictitious output values ∆P, ∆Q to real set points. Q
# "
! "
$ Field
Setpoint to field
Fig. 6: general flow chart for on-line optimization.
GC
GP SPe
P
Fig. 5: example of control actions for a PV resource. Active power available displacements are shown.
Storage unit is considered in a single time period as a generator or a load, asymmetric efficiencies in charging and discharging processes are taken into account thanks to two “virtual” lines with different electric parameters connecting the real node with a virtual battery node. In order to include integral constraint deriving from storage units, time ‘sections’ are converted into spatial interconnected sections [9] and the resultant problem is then solved simultaneously for the entire time horizon. DISCoVER could be employed for both off-line simulation and on-line control: in the first case it may identify critical conditions in a given network and outline possibile solutions. In the latter case, for each time period it gets real information about the network from a State Estimation block and –when necessary– it calculates the optimal setpoints to be sent to dispatchable resources. Possible critical conditions deriving from actuation of commands sent to resources could be evaluated with a proper dynamic analysis. If necessary, an additional margin should be added to voltage constraints. The general scheme for real-time operation is summarized in the following flow chart, where main blocks are depicted.
17th Power Systems Computation Conference
Real time optimization should be integrated with existing automation systems, in particular with SCADA/DMS at HV/MV substation level. Simulations on test networks represent a key phase in designing of the overall control system, to identify information to be exchanged and to evaluate condition hardly observable in real case. 5
SIMULATIONS AND PRELIMINARY RESULTS
In this paragraph an example of a off-line optimization is given. The analysis considered 24 hourly time periods (extendible to 96 time sections and further) and a test network, based on real data, as follows (figure 7): • 2 feeders 20 kV, 32 nodes, 8 DERs (3 syncronous generators, 5 RES), 1 storage unit • load and generation profiles. Resources available to the centralized controller are: • OLTC • controllable DERs: synchronous generators (turbines) • ∆P+/∆P- rewards: parametric (DER specific) • ∆Q+/- = 1 € / MVAR for all DERs • Storage: 6 MWh /3 MW, located on node #12 feeder 1 [∆P+ =500 €/MWh ; ∆P- = 380 €/MWh]. Main technical constraints included optimization procedure are (equations 2÷4):
in
the
• voltage limits: 20 kV ± 10% (18÷22 kV); • current limits: 0.14÷0.36 kA (depending on branches characteristics); • storage energy level: full charge at 24:00 (6 MWh).
Voltage profile for baseline scenario and after DISCoVER calculation, including the above mentioned costs, are compared in the graph in Figure 8.
G
With reference to the graph, the following Table II summarizes baseline and calculated setpoints for controllable resources located on feeder 1: a) GD2, b) storage unit, c) GD1, which nodes are highlighted on the graph itself. For the controllable generator located on node 29 (feeder 2), no displacements are required.
Fig 7: test network. W = wind generator, P = photovoltaic plant, G = sync. generator. (Feeder #1 is highlighted to ease reading of the document.)
Node #
P [MW]
Q [MVAR]
Control.
GD7 – wind
4
3.58
0
N
GD2 – sync
8
2.87
2.10
Y
GD8 – wind
11
3.58
0.0
N
Storage
12
-2.00
0.0
Y
GD1 – sync
18
4.94
0.0
N
c) GD1 [MW / MVAR] Baselin OPF 4.94 / 0 4.94 / 0
Table II: calculated setpoint for controllable DERs and comparison with scheduled operation (baseline) – feeder 1, h 15:00.
Focusing on feeder 1 (highlighted in previous Figure 7), an overvoltage is expected at 15:00 (3 PM): in particular, synchronous generator named GD1 (located at the end node of the feeder, #18) may disconnect. The following Table I shows expected generation for the considered time period of resources located on feeder 1 (baseline scenario). Generator
Table II and Figure 8 show that DISCoVER asked GD2 and the storage unit for a reactive power reduction, together with a different position for the tap changer in order to reduce the voltage on the entire network. As reasonable, the goal was reached asking for Q reduction before than an active power P curtailment (more expensive). Total cost for the intervention here described (equal to € 2.3) should be considered as an indicative figure because –in absence of official schemes– rewards for reactive ancillary services included in the cost function were given a minimum value. In any case, total cost for gaining controllable resources should be compared with avoided penalties for poor voltage quality.
Table I: scheduled/forecasted generation at 15:00, feeder 1.
H 15 - comparison
23
GD1 storage
22 GD2
feeder 1
21
V [kV]
feeder 2
20 tap
19 18
feeder 2-12-15-18 post feeder 2-19-27 feeder 2-19-27 post feeder 2-12-15-18
18
12
22
27 2
17
Fig. 8: comparison of voltage profiles between baseline scenario and after optimization (‘post’) - 15:00. Controllable resources on feeder 1: GD1 (sync generator), storage, GD2 (sync generator). For resources on feeder 2 no actions are required. For clarity, only main feeders are shown.
17th Power Systems Computation Conference
Stockholm Sweden - August 22-26, 2011
6 FINAL CONSIDERATIONS Diffusion of Distributed Generation requires new strategies to ensure reliable and economic operation. Given a MV network, RSE methodologies permit to evaluate results of proposed voltage centralized controller depending on: • number, siting and sizing of controllable DERs, • cost of internal resources (storage, especially), • rewards for Ancillary services offered by controllable resources (generators and loads). The procedure here proposed is able to include storage units in a complete optimization problem with a simple and efficient management. In several countries a debate about storage units (electric or not) for supporting network operation has started: the discussion is focusing mainly on ownership and management of these devices, before any technical consideration about their possible contribution in improving power quality levels and diffusion of Distributed Generation. The framework here depicted allows to evaluate how different ‘business models’, including several controllable resources with their different reward schemes, may affect DG diffusion on a given network in terms of power quality increase and relevant dispatching costs. Storage application for improving network operation is not yet deployed in real networks but it is linked to a future view where storage technology will be fully integrated, e.g. with electric vehicle charging stations, and economically competitive. Until that time, capacitors banks, despite their less showy performances, may help to ensure good quality and reliability in these phase of grid evolution towards the “active network” concept. ACKNOWLEDGEMENTS This work has been financed by the Research Fund for the Italian Electrical System under the Contract Agreement between RSE (formerly known as ERSE) and the Ministry of Economic Development – General Directorate for Nuclear Energy, Renewable Energy and Energy Efficiency stipulated on July 29th, 2009 in compliance with the Decree of March 19th, 2009.
17th Power Systems Computation Conference Powered by TCPDF (www.tcpdf.org)
REFERENCES [1] CIGRE WG C6.11, “Active Distribution Networks: general features, present status of implementation and operation practices”, Electra n°246, October 2009. [2] Autorità per l’Energia Elettrica e il Gas, delibera ARG/elt 39/10 (in Italian) http://www.autorita.energia.it/it/docs/10/039-10arg.htm
[3] E. Micolano et al, “Stato dell’arte e confronto tecnico-economico delle tecnologie di accumulo elettrico. Sviluppo di un sistema con supercapacitori per applicazioni di Power Quality: sperimentazione delle funzioni in ambiente di simulazione”, www.rse-web.it report n° 08005871 (Italian), integrated with recent surveys. [4] Sandia National Laboratories,“Long- vs. Short-Term Energy StorageTechnologies Analysis”, 2003 http://prod.sandia.gov/techlib/access-control.cgi/2003/ 032783.pdf
[5] American Physical Society’s Panel on Public Affairs (POPA), “Integrating Renewable Electricity on the Grid”, November 2010 http://www.aps.org/about/pressreleases/integratingelec.cfm
[6] S. Acha et al, “Effects of optimised plug-in hybrid vehicle charging strategies on electric distribution network losses”, Transmission and Distribution Conference and Exposition, 2010 IEEE PES. [7] R. Turri, L. Carradore, “Electric vehicles participation in distribution network voltage regulation”, 45th International Universities Power Enginering Conference UPEC, Cardiff 2010.??? [8] R. Caldon, F. Rossetto, A. Scala, “Reactive Power Control in Distribution Networks with Dispersed Generators: a Cost Based Method”, Electric Power System Research, 64 (2003), pp. 209-217. [9] A. Garzillo, M. Innorta, M. Ricci, “The problem of the active and reactive optimum power dispatching solved by utilizing a primal-dual interior point method”, Electric Power & Energy System, Vol. 20 No. 6, pp. 427-434, 1998.