Morbidity and Mortality Weekly Report www.cdc.gov/mmwr
Recommendations and Reports
March 28, 2008 / Vol. 57 / No. RR-1
Strategies to Improve External Cause-of-Injury Coding in State-Based Hospital Discharge and Emergency Department Data Systems Recommendations of the CDC Workgroup for Improvement of External Cause-of-Injury Coding
INSIDE: Continuing Education Examination
depar tment of health and human ser vices department services Centers for Disease Control and Prevention
MMWR CONTENTS The MMWR series of publications is published by the Coordinating Center for Health Information and Service, Centers for Disease Control and Prevention (CDC), U.S. Department of Health and Human Services, Atlanta, GA 30333. Suggested Citation: Centers for Disease Control and Prevention. [Title]. MMWR 2008;57(No. RR-#):[inclusive page numbers].
Introduction ......................................................................... 1 Methods .............................................................................. 3 E-Coding in Morbidity Data Systems .................................... 5 E-Coding in States ............................................................... 6 Challenges to Improving the Quality and Accessibility
Centers for Disease Control and Prevention Julie L. Gerberding, MD, MPH Director Tanja Popovic, MD, PhD Chief Science Officer James W. Stephens, PhD Associate Director for Science Steven L. Solomon, MD Director, Coordinating Center for Health Information and Service Jay M. Bernhardt, PhD, MPH Director, National Center for Health Marketing Katherine L. Daniel, PhD Deputy Director, National Center for Health Marketing
of E-Coded Data ................................................................ 8 Uses of E-Coded Data for Injury Prevention Decision Making ................................................................. 9 Recommended Strategies for Improving E-Coding ............. 10 Conclusions ....................................................................... 11 Acknowledgments ............................................................. 12 References ......................................................................... 12 Continuing Education Activity ......................................... CE-1
Editorial and Production Staff Frederic E. Shaw, MD, JD Editor, MMWR Series Teresa F. Rutledge (Acting) Managing Editor, MMWR Series David C. Johnson (Acting) Lead Technical Writer-Editor Jeffrey D. Sokolow, MA Project Editor Peter M. Jenkins (Acting) Lead Visual Information Specialist Lynda G. Cupell Malbea A. LaPete Visual Information Specialists Quang M. Doan, MBA Erica R. Shaver Information Technology Specialists Editorial Board William L. Roper, MD, MPH, Chapel Hill, NC, Chairman Virginia A. Caine, MD, Indianapolis, IN David W. Fleming, MD, Seattle, WA William E. Halperin, MD, DrPH, MPH, Newark, NJ Margaret A. Hamburg, MD, Washington, DC King K. Holmes, MD, PhD, Seattle, WA Deborah Holtzman, PhD, Atlanta, GA John K. Iglehart, Bethesda, MD Dennis G. Maki, MD, Madison, WI Sue Mallonee, MPH, Oklahoma City, OK Stanley A. Plotkin, MD, Doylestown, PA Patricia Quinlisk, MD, MPH, Des Moines, IA Patrick L. Remington, MD, MPH, Madison, WI Barbara K. Rimer, DrPH, Chapel Hill, NC John V. Rullan, MD, MPH, San Juan, PR Anne Schuchat, MD, Atlanta, GA Dixie E. Snider, MD, MPH, Atlanta, GA John W. Ward, MD, Atlanta, GA
Disclosure of Relationship
CDC, our planners, and our content experts wish to disclose they have no financial interests or other relationships with the manufacturers of commercial products, suppliers, or commercial services, or commercial supporters. Presentations will not include any discussion of the unlabeled use of a product or a product under investigational use.
Vol. 57 / RR-1
Recommendations and Reports
1
Strategies to Improve External Cause-of-Injury Coding in State-Based Hospital Discharge and Emergency Department Data Systems Recommendations of the CDC Workgroup for Improvement of External Cause-of-Injury Coding Prepared by Joseph L. Annest, PhD1 Lois A. Fingerhut, MA2 Susan S. Gallagher, MPH3 David C. Grossman, MD4 Holly Hedegaard, MD5 Renee L. Johnson, MSPH1 Mel Kohn, MD6 Donna Pickett, MPH2 Karen E. Thomas, MPH1 Roger B. Trent, PhD7 1 National Center for Injury Prevention and Control, CDC 2 National Center for Health Statistics, CDC 3 Tufts University School of Medicine, Boston, Massachusetts 4 Group Health Cooperative, Seattle, Washington 5 Colorado Department of Public Health and Environment, Denver, Colorado 6 Oregon Department of Human Services, Portland, Oregon 7 California Department of Public Health, Sacramento, California
Summary Each year, an estimated 50 million persons in the United States experience injuries that require medical attention. A substantial number of these persons are treated in an emergency department (ED) or a hospital, which collects their health-care data for administrative purposes. State-based morbidity data systems permit analysis of information on the mechanism and intent of injury through the use of external cause-of-injury coding (E-coding). E-coded state morbidity data can be used to monitor temporal changes and patterns in causes of unintentional injuries, assaults, and self-harm injuries and to set priorities for planning, implementing, and evaluating the effectiveness of injury-prevention programs. However, the quality of E-coding varies substantially from state to state, which limits the usefulness of these data in certain states. This report discusses the value of using high-quality E-coding to collect data in state-based morbidity data systems. Recommendations are provided to improve communication regarding E-coding among stakeholders, enhance the completeness and accuracy of E-coding, and make E-coded data more useful for injury surveillance and prevention activities at the local, state, and federal levels. Implementing the recommendations outlined in this report should result in substantial improvements in the quality of external cause-of-injury data collected in hospital discharge and ED data systems in the United States and its territories.
Introduction Each year, an estimated 50 million persons in the United States experience injuries that require medical attention, The material in this report originated in the National Center for Injury Prevention and Control, Ileana Arias, PhD, Director; and the Office of Statistics and Programming, Joseph L. Annest, PhD, Director; and the National Center for Health Statistics, Ed Sondik, PhD, Director; and the Office of Analysis and Epidemiology, Linda Bilheimer, PhD, Director. Corresponding preparer: Joseph L. Annest, PhD, National Center for Injury Prevention and Control, 4770 Buford Highway, N.E., MS F-62, Atlanta, GA 30341-3717. Telephone: 770-488-4804; Fax: 770-488-1665; E-mail:
[email protected].
resulting in lifetime costs of more than $400 billion (1). In 2004, injuries in the United States resulted in an estimated 167,000 deaths, 1.9 million injury-related discharges from short-stay hospitals, and 31 million initial emergency department (ED) visits (2–4). These injuries, which represent 7% of deaths from all causes, 6% of hospitalizations, and 32% of ED visits, constitute a substantial public health burden. During 2004–2006, an estimated 48% of injured persons requiring medical attention received care in settings other than a hospital or an ED (e.g., outpatient clinics or physicians’ offices) (CDC, unpublished data, 2007). Population-based injury data assist public health authorities in identifying and tracking patterns and trends in the
2
MMWR
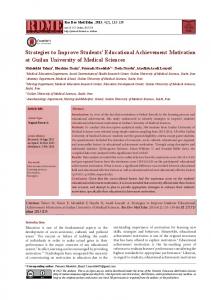
external causes of fatal and nonfatal injuries and in designing and implementing effective injury-prevention strategies (5). External cause-of-injury coding (E-coding) in statewide mortality and morbidity data systems is the standard method used to classify injury incidents by intent (e.g., unintentional, homicide/assault, suicide/self-harm, or undetermined) and mechanism (e.g., motor vehicle, fall, struck by/against, firearm, or poisoning). For example, in the case of a hospitalization for which the principal diagnosis is a femur fracture, the E-code identifies how the fracture was caused (e.g., the person was pushed intentionally or fell unintentionally from a ladder). Accurate information on the mechanism of injury is critical for informing prevention programs. Because trends and patterns of injury differ from state to state, state health department–based injury-prevention programs need state-specific data to understand and respond effectively to injury problems in their jurisdictions. Injury mortality data are collected by the National Vital Statistics System, which is operated by CDC. Information on E-codes is based on the International Statistical Classification of Diseases and Related Health Problems, Tenth Revision (ICD10) (6,7). Mortality data are compiled each year by NCHS as a census of all deaths reported to state vital statistics departments (7). In the United States, E-coding has been consistently more complete for mortality data than for morbidity data because states require that the external cause of death be listed as the underlying cause on a death certificate issued for an injury-related death. For example, if a person were in a fatal car crash and suffered a severe traumatic brain injury, the underlying cause-of-death would be the motor-vehicle crash rather than the brain injury. The E-code for a fatal injury is assigned by state and federal vital records programs on the basis of cause-of-death information submitted on death certificates. If a death certificate is submitted without the information needed to assign a code, state vital records programs return the certificate to the certifier who submitted it and request more information. This quality-control process ensures that E-codes are assigned for all deaths from injury. During 1999–2004, the underlying cause of death was coded as “unspecified cause” for only 6% of all injury-related deaths. Although external cause-of-injury mortality data can be helpful for setting priorities and making policy decisions regarding injury prevention, these data are not a good surrogate for injury morbidity data (4,8). The leading causes of nonfatal injury-related ED visits, injury hospitalizations, and injury deaths differ substantially (Table 1 and Figure 1). Whereas motor-vehicle crashes are the leading cause of injury deaths, falls are the leading cause of injury hospitalizations and ED visits (Figure 1). In addition, the distributions of fatal and nonfatal injuries and the number of nonfatal inju-
March 28, 2008
ries relative to deaths vary by external cause of injury (Table 1). For instance, the ratio of nonfatal ED visits to deaths differs for motor-vehicle traffic injuries (90 nonfatal ED visits per death) compared with poisonings (40 nonfatal ED visits per death). For injury morbidity data, information on external causes of injury is coded using the International Classification of Diseases, Ninth Revision, Clinical Modification (ICD-9-CM) (9) and entered into the state’s electronic hospital discharge data system (HDDS) or hospital ED data system (HEDDS). However, not all states have such data systems. For those with these data systems, the completeness and specificity of E-codes for injury-related hospitalizations and ED visits vary substantially across states, limiting the usefulness of the E-coded data available for certain states (10). Lack of E-coding in state morbidity data also affects national injury statistics from federal data systems that derive their data from a sample of U.S. hospitals, such as the National Hospital Discharge Survey (i.e., 37% of injury hospital discharges with missing E-codes) and the National Hospital Ambulatory Medical Care Survey (i.e., 10% of injury ED visits with missing E-codes) (Table 1 and Figure 1). In contrast, certain states (e.g., Massachusetts and New York) have almost complete E-coding for hospitalizations and ED visits, ensuring that useful data on both fatal and nonfatal injuries are available for prevention program planning and evaluation (Tables 2 and 3). Although state HDDS and HEDDS data are used primarily for administrative and billing purposes, these systems provide the best available data sources on external cause of injury for measuring the impact of nonfatal injury on society. For example, falls are the leading cause of injury morbidity among persons aged >65 years (2,4). As the U.S. population continues to age, states can benefit from monitoring fall-related morbidity among older persons to assess changes in healthcare use and cost and in the effectiveness of fall-prevention strategies (4,11–14). This report discusses the role of E-codes in injury prevention and practical strategies to improve E-coding in statewide HDDS and HEDDS data systems. The CDC workgroup recommendations contained in this report outline feasible steps jurisdictions can take to improve the collection and availability of complete, specific, and high-quality E-codes for use in injury surveillance and prevention efforts within all states, the District of Columbia, and U.S. territories. Implementing these recommendations can enhance the usefulness of state-level injury morbidity data for injury prevention program planning and implementation, priority setting, and policy setting for government and nongovernment organizations. Previous studies have demonstrated that the public health benefits will substantially outweigh the estimated economic costs of E-coding (15,16).
Vol. 57 / RR-1
Recommendations and Reports
3
TABLE 1. Average annual numbers of injury deaths, hospital discharges for injury, and initial emergency department (ED) visits for injury, by mechanism of injury — United States, 2003–2005 Deaths 2003–2004 Mechanism of injury
No.
Motor-vehicle traffic Firearm Poisoning Fall Suffocation Not specified** Drowning Fire/hot object Cut/pierce Other specified Other, not elsewhere classified Other land transport Natural/environmental Other transportation Other pedestrian Struck by/against Machinery Other pedal cyclist Overexertion Missing external cause-of-injury (E-code)§§
43,386 29,853 29,504 18,808 13,518 8,647 3,936 3,802 2,771 2,042 1,967 1,627 1,390 1,285 1,089 1,045 718 198 13 NA¶¶
Hospital discharges 2004–2005
Initial ED visits 2004–2005
%
SE* (%)
No.†
%
SE (%)
No.†
26.2 18.0 17.8 11.4 8.2 5.2 2.4 2.3 1.7 1.2 1.2 1.0 0.8 0.8 0.7 0.6 0.4 0.1
0.1 0.1 0.1 0.1
180 22 197 493 5§ 24
9.3 1.1 10.2 25.5 0.3 1.2
0.6 0.1 0.4 1.0 0.1 0.1
3,900 79§ 1,167 8,021 97 412
12.4 0.3 3.7 25.6 0.3 1.3
0.4 0.1§ 0.2 0.6 0.1 0.1
¶
††
††
††
¶
0.1 0.2 0.1 0.2 0.2
0.1 0.3 0.2 0.2 0.1 0.3 0.1
¶
1.7 1.7 0.6 1.9 1.3 0.2 0.1 3.3 0.6 0.6 1.2
1.6 7.8 4.9 3.6 1.3 5.6 0.3
¶
32 33 11 37 25 4 2§ 64 11 12 23
503 2,457 1,541 1,132 395 1,757 89
0.2 0.1 0.1 0.1
4,143 281 398 1,670
13.2 0.9 1.3 5.3
0.4 0.1 0.1 0.3
NA
NA
36.9
1.7
3,282
10.5
0.6
¶ ¶ ¶
¶ ¶ ¶ ¶ ¶ ¶ ¶ ¶ ¶
††
713
††
††
¶ ¶
††
††
%
††
††
SE (%)
††
††
Total 165,593 100.0 1,934 100.0 31,366 100.0 Sources: CDC, National Center for Health Statistics: National Vital Statistics System, National Hospital Discharge Survey, National Hospital Ambulatory Medical Care Survey; International Classification of Diseases, Ninth Revision, Clinical Modification (E-codes for hospital discharges and ED visits); International Classification of Diseases, Tenth Revision (codes for injury deaths). Notes: Mechanism of injury defined by ICD-9-CM external cause codes for hospital discharge data and emergency department data are compatible with categories for mechanism of injury deaths. Injury deaths are classified on the basis of ICD-10 codes used in the external cause of injury matrix as shown in Appendix Table 1 of Deaths: injuries, 2002 (Miniño AM, Anderson RN, Fingerhut LA, Boudreault MA, Warner M. Deaths: injuries, 2002. Natl Vital Stat Rep 2006;54:112). The definition of a hospitalized injury differs from an injury ED visit. A hospital discharge is counted as an injury regardless of whether it was the initial admission for that injury or a subsequent one for that injury, and is based solely on the presence of a first-listed injury diagnosis code regardless of whether a valid external cause code exists. An injury ED visit is defined as the initial visit for an injury and the presence of either a first-listed diagnosis code for an injury or a valid first-listed E-code in the record. E-codes are available at http://www.cdc.gov/nchs/injury.htm. * Standard error. † In thousands. § Data are unreliable and based on a relative SE of >20% but 0 but 30%. §§ Injury diagnosed but no E-code assigned. ¶¶ Not applicable.
Methods Initial efforts to improve E-coding in statewide hospital discharge data systems were made in the early to mid-1990s, but progress toward complete and accurate E-coding in all states has been limited (10,17,18). In 2007, the Council of State and Territorial Epidemiologists (CSTE), the Injury Control and Emergency Health Services Section of the American Public Health Association (APHA-ICEHS), the State and Territorial Injury Prevention Directors Association (STIPDA), the Society for the Advancement of Violence and Injury Research (SAVIR), and the Association of State and Territorial Health Officers (ASTHO) issued position statements calling on CDC to develop strategies to improve E-coding completeness and specificity in state hospital discharge databases (19–23).
CSTE asked CDC to take a leadership role in assembling an expert workgroup to recommend strategies to improve E-coding in state hospital discharge databases. A workgroup of injury data experts from CDC, Tufts Medical School, state health departments, and other health professionals was established to provide recommendations for practical strategies for improving E-coding. Members of the workgroup are associated with CSTE, SAVIR, and STIPDA. Because multiple states have indicated interest in establishing HEDDS in addition to HDDS, the workgroup decided to include in this report efforts to improve E-coding in both statewide hospital discharge and ED data systems. CDC has a history of working in collaboration with CSTE, SAVIR, and STIPDA on E-coding and other projects to
4
MMWR
March 28, 2008
FIGURE 1. Leading mechanisms of injury deaths, hospital discharges for injury, and emergency department (ED) visits for injury — United States, 2003–2005
Deaths, 2003–2004
Hospital discharges, 2004–2005
Initial ED visits, 2004–2005
Motor-vehicle traffic Firearm
18%
26%
18%
Poisoning
26%
26%
30%
Falls Suffocation
8%
No mechanism stated 10%
11% 18%
Struck by/against
13% 10%
37% 9%
18%
Cut/pierce 8%
All other
12%
Source: CDC, National Center for Health Statistics: data from National Vital Statistics System for deaths, National Hospital Discharge Survey for hospital discharges, and National Hospital Ambulatory Medical Care Survey for ED visits.
TABLE 2. Average annual numbers of injury deaths, hospital stay discharges (inpatient and observation) for injury, emergency department (ED) visits for injury, by mechanism of injury — Massachusetts, 2003–2005 Deaths 2003–2005 Mechanism of injury
No.
Motor-vehicle traffic Firearm Poisoning Fall Suffocation Not specified Drowning Fire/hot object Cut/pierce Other specified Other, not elsewhere classified Other land transport Natural/environmental Other transportation Other pedestrian Struck by/against Machinery Other pedal cyclist Overexertion Missing external cause-of-injury (E-code)
487 210 791 282 310 229 72 59 56 18 23 22 19 12 7 19 6 2 0 NA**
%
SE§ (%)
18.6 8.0 30.1 10.8 11.8 8.7 2.7 2.2 2.1 0.7 0.9 0.9 0.7 0.5 0.3 0.7 0.2 0.1
0.8 0.5 0.9 0.6 0.6 0.6 0.3 0.3 0.3 0.2 0.2 0.2 0.2 0.1 0.1 0.2 0.1 0.1
¶
NA
ED visits† FY2004–2005
Hospital discharges FY*2004–2005
¶
NA
No. 5,063 376 6,089 22,308 197 1,663 47 418 1,188 834 387 600 543 94 63 1,824 277 453 1,106 1,206
%
SE (%)
11.3 0.8 13.6 49.9 0.4 3.7 0.1 0.9 2.7 1.9 0.9 1.3 1.2 0.2 0.1 4.1 0.6 1.0 2.5 2.7
0.1 ¶
0.2 0.2 ¶
0.1 ¶ ¶
0.1 0.1 ¶
0.1 0.1 ¶ ¶
0.1 ¶ ¶
0.1 0.1
No. 98,510 464 15,381 181,159 754 49,562 147 10,789 76,768 38,940 13,964 4,510 29,079 626 447 116,169 4,597 7,995 90,866 1,947
%
SE (%)
13.3 0.1 2.1 24.4 0.1 6.7
¶
¶
1.5 10.3 5.2 1.9 0.6 3.9 0.1 0.1 15.6 0.6 1.1 12.2 0.3
¶ ¶ ¶ ¶ ¶ ¶ ¶ ¶ ¶ ¶ ¶ ¶ ¶ ¶ ¶ ¶ ¶ ¶ ¶
Total 2,623 100.0 44,730 100.0 742,671 100.0 Sources: Registry of Vital Records and Statistics, Massachusetts Department of Public Health; Massachusetts Inpatient Hospital, Outpatient Observation Stay, and Emergency Department Discharge Databases, Massachusetts Division of Health Care Finance and Policy; International Classification of Diseases, Ninth Revision, Clinical Modification (E-codes for hospital discharges); International Classification of Diseases, Tenth Revision (codes for injury deaths). Note: External cause codes for hospital discharge data and emergency department data are compatible with the ICD-10 external cause matrix as shown in Appendix Table 1 of Deaths: Injuries 2002 (Miniño AM, Anderson RN, Fingerhut LA, Boudreault MA, Warner M. Deaths: injuries, 2002. Natl Vital Stat Rep 2006;54:112). * Fiscal year. † Initial visits could not be uniquely identified; ED visits include both initial and subsequent revisits for the same injury incident. ED data do not include patients subsequently admitted into the hospital; those records are included in hospitalization data. One acute care hospital representing 0 but 0 but 90% of their injury-related hospitalizations; results varied for the other 18 states (range: 51%–89%) (10). Even among states with a high percentage of E-coded hospital records, assigned E-codes often lack specificity. If health-care providers do not understand why specific information needed for E-coding is important, documentation in the medical record can be inadequate; this can lead to overuse of the unspecified E-codes, such as those for unspecified fall (E888.9) or a motor-vehicle traffic accident of an unspecified nature (E819) (28). Unspecified E-codes do not provide adequate detail needed for injury prevention. Despite limitations associated with lack of completeness and specificity of E-coding, CDC and certain states, in collaboration with CSTE, STIPDA and state partners, have published annual state injury indicator reports that contain injury mortality and morbidity data from participating states’ data systems (29–31). States with injury program capacity-building grants from CDC are required to submit statewide HDDS data annually for inclusion in the annual report. All other states and territories are invited and encouraged to participate; 34 states participated in the most recent annual report (31). These reports have been used for comparison of injury patterns among states and have resulted in improved commu-
Vol. 57 / RR-1
Recommendations and Reports
FIGURE 2. Statewide hospital discharge data systems (HDDS), by external cause-of-injury coding (E-coding) status — United States, 2007 1989
1993 1990 1994
1993
DC
1995 1993
1991
1993
1995
CT 1993
1995 1989
1998
DE 1992
1996
1996
DC 1998
1996
MA 1994
1999
MD 1993 1998
NJ 1994 RI
1997
1989
VT 1992
E-codes mandated and year mandated E-codes routinely collected, but not mandated Statewide HDDS, but E-codes not routinely collected No statewide HDDS
FIGURE 3. Statewide hospital emergency department data systems (HEDDS), by external cause-of-injury coding (E-coding) status — United States, 2007
2002
CT 1993
1996
DE 2004 1993
2004
Certain states without E-coding mandates from either state legislatures or hospital associations (e.g., Colorado, Minnesota, and Oregon) have relatively high rates of external cause coding (i.e., >84% completeness) (Table 2). Colorado serves as an example of how factors other than mandates can improve the completeness and accuracy of external cause coding. Colorado’s HDDS is managed by the Colorado Health and Hospital Association (CHHA). In 1997, state health department staff began working with CHHA to encourage hospitals to assign E-codes to appropriate hospital discharge records. CHHA approached medical records coders through their trade organization to outline how injury prevention activities conducted by state and local health departments and local groups could benefit by having access to E-coded data. CHHA also pointed out to hospital chief executive officers that submitting E-coded data would meet the hospital’s requirement to report various conditions to the health department. For example, Colorado requires hospitals to report data to the statewide trauma registry. For certain hospitals, reporting E-coded hospital discharge data to the state hospital association would meet the state’s trauma registry reporting requirement, thereby saving the hospital from the need to develop an additional system for reporting injured patients to the trauma registry. During the next several years, CHHA staff, the state epidemiologist, and staff from the
2003
1993
2005
7
MA 2002 2005
1995
1996
MD 1997 RI
2004
VT 2001
1996
2005
E-codes mandated and year mandated E-codes routinely collected, but not mandated Statewide HEDDS, but E-codes not routinely collected No statewide HEDDS
nication among states regarding injury-prevention efforts and efforts to improve statewide HDDS and HEDDS E-coding (31). On the basis of data from annual state injury indicators reports (31), four states (Hawaii, Kansas, Oklahoma, and Oregon) increased completeness of external cause coding >20% during 1999–2004 (Table 4). Impetuses for improvement in these states included legislative initiatives, policy changes at hospitals, training of medical records coders, and increased awareness of health-care providers and health information specialists regarding the value of high-quality E-coded data.
TABLE 4. Presence of an external cause-of-injury coding (E-coding) mandate* and percentage of injury hospitalization records with external cause coding, by state — 20 states, 1999 and 2004† E-code 1999 2004 State mandate (%) (%) Difference Arizona Yes 84.0 92.8 8.8 California Yes 100.0 100.0 0.0 Colorado No 98.8 98.8 0.0 Florida Yes 74.0 85.7 11.7 Georgia Yes 91.8 95.5 3.7 Hawaii No 52.9 86.4 33.5 Kansas No 58.0 81.5 23.5 Kentucky Yes 68.0 78.6 10.6 Massachusetts Yes 95.3 98.9 3.6 Michigan No 82.3 86.2 3.9 Minnesota No 78.4 84.7 6.3 Nebraska Yes 100.0 97.0 -3.0 North Carolina No 89.1 90.2 1.1 Oklahoma Yes 65.9 88.2 22.3 Oregon No 67.5 89.0 21.5 South Carolina Yes 94.1 93.0 -1.1 Utah Yes 89.2 92.0 2.8 Vermont Yes 85.0 98.4 13.4 Washington Yes 98.9 98.4 -0.5 Wisconsin Yes 97.3 100.0 2.7 * A state law or ruling by another governing body that required assignment and recording of ICD-9-CM external cause codes using state or federal coding guidelines. † Includes only states that submitted data for both years.
8
MMWR
injury epidemiology program at the state health department met regularly with medical records coders to discuss the completeness and accuracy of E-codes. The hospital association newsletter reported rates of E-coded data by hospital and highlighted the hospitals that showed the most improvement. In 2003, when a comprehensive report on injury in Colorado was prepared, health department staff reviewed the results in advance with members of the hospital association and coders’ trade organization. The contributions of the medical records coders and hospitals in providing complete and comprehensive E-codes for data analysis were acknowledged in the report.
Challenges to Improving the Quality and Accessibility of E-Coded Data Strategies are needed to improve quality assurance (QA) procedures used by states to evaluate E-coding. QA practices vary by state; the majority of states do not evaluate E-coded HDDS and HEDDS data routinely for completeness, specificity, and accuracy (10). Ongoing evaluation of the quality of E-codes is needed to ensure consistency in completeness, specificity, and accuracy of E-coding among all participating hospitals over time. States have increasing interest in using electronic health and patient records and in integrating medical care and billing data systems. This trend might encourage vendors to develop standard QA procedures and adapt them into database management software that would provide automated systems to assist coders in assigning E-codes. One problem with the quality of E-coding in state databases is accuracy, as measured by percentage agreement in codes based on record reabstraction studies. Accuracy of ICD-9-CM E-codes in hospital discharge records has been examined in the United States and internationally. The level of inaccurate coding for E-codes (i.e., those with at least four digits) was 13% in the hospital discharge data system in Washington state in 1996 (28), 18% in the National Minimum Data Set in New Zealand during 1996–1998 (32), and 16% for the Victorian Inpatient Minimum Database in Australia during 1993–1994 (33). Although E-codes were found to be reliable for reporting injury data by broad groupings (e.g., falls, motor vehicle traffic, poisoning, assault, and self-harm), a substantial lack of accuracy was reported in that part of the E-code that identifies specific circumstances of an injury incident. The New Zealand study determined that the level of incorrect coding was similar for large and small hospitals (32). A recently published study of accuracy of E-coding in an ED setting determined that coding was accurate for 65% of probable work-related injuries and 57% of nonwork-related injuries (34).
March 28, 2008
A study conducted in Oregon to assess methods for improving the quality of E-coding and to identify potential barriers indicated that certain hospitals reported not having enough space on the electronic billing form to document circumstances of the injury event adequately. The majority of hospitals included in the study used software purchased from commercial vendors that was not modifiable to capture the information needed to assign specific E-codes. Hospital reimbursement also was a potential deterrent to adequate E-coding; not all hospitals understood the need for accurate E-coding because E-coding does not affect reimbursement. Hospital administrators also expressed concern that reporting E-codes might alert an insurance company to the possibility that a third party was liable for the cost of care, possibly triggering an investigation that would delay payment to the hospital. Another issue that researchers initially thought could be a barrier was the cost of assigning E-codes; however, the study indicated that the cost of E-coding was minimal (an estimated $0.08 per E-code assigned) (Oregon Department of Human Services, unpublished data, 2002). As discussed earlier in this report, accurate and specific E-coding requires that medical records contain sufficient detail regarding injury circumstances (e.g., “fell down stairs while working and hit head” rather than simply “hit head”). However, anecdotal evidence indicates that health-care providers might not record these details because they 1) see no reason to do so (care not being affected by these details), 2) have no financial incentive to do so (the information not being required for reimbursement), 3) are concerned about stigmatizing the patient (e.g., by documented suicidal behavior or drug use), or 4) do not understand the importance of documenting injury circumstance information in the chart for public health purposes. In addition, sometimes healthcare providers simply are unable to determine the details of the circumstances. For example, a person who is discovered unconscious on the ground might not be able to provide any information as to how a head injury occurred. In certain states, E-coded data are not easily accessible. Certain HDDS and HEDDS databases are operated by nongovernment organizations that view these data as proprietary and do not necessarily wish to provide ready access to statewide administrative data by state health department officials or prevention program directors (10). In other states, these systems are operated by state health departments, which are willing to provide ready access to E-coded injury data but might not have adequate resources to prepare and manage public-use data files and web-based query systems (10).
Recommendations and Reports March 28, 2008 / Vol. 57 / RR-1 Morbidity and Mortality Weekly Report www.cdc.gov/mmwr
Continuing Education Activity Sponsored by CDC Strategies to Improve External Cause-of-Injury Coding in State-Based Hospital Discharge and Emergency Department Data Systems Recommendations of the CDC Workgroup for Improvement of External Cause-of-Injury Coding EXPIRATION — March 28, 2010 You must complete and return the response form electronically or by mail by March 28, 2010, to receive continuing education credit. If you answer all of the questions, you will receive an award letter for 2.5 hours Continuing Medical Education (CME) credit; 0.2 Continuing Education Units (CEUs); 2.5 contact hours Continuing Nursing Education (CNE)
credit; or 2.5 contact hours Certified Health Education Specialist (CHES) credit. If you return the form electronically, you will receive educational credit immediately. If you mail the form, you will receive educational credit in approximately 30 days. No fees are charged for participating in this continuing education activity.
INSTRUCTIONS By Internet 1. Read this MMWR (Vol. 57, RR-1), which contains the correct answers to the questions beginning on the next page. 2. Go to the MMWR Continuing Education Internet site at http://www. cdc.gov/mmwr/cme/conted.html. 3. Select which exam you want to take and select whether you want to register for CME, CEU, CNE, or CHES credit. 4. Fill out and submit the registration form. 5. Select exam questions. To receive continuing education credit, you must answer all of the questions. Questions with more than one correct answer will instruct you to “Indicate all that apply.” 6. Submit your answers no later than March 28, 2010. 7. Immediately print your Certificate of Completion for your records.
By Mail or Fax 1. Read this MMWR (Vol. 57, RR-1), which contains the correct answers to the questions beginning on the next page. 2. Complete all registration information on the response form, including your name, mailing address, phone number, and e-mail address, if available. 3. Indicate whether you are registering for CME, CEU, CNE, or CHES credit. 4. Select your answers to the questions, and mark the corresponding letters on the response form. To receive continuing education credit, you must answer all of the questions. Questions with more than one correct answer will instruct you to “Indicate all that apply.” 5. Sign and date the response form or a photocopy of the form and send no later than March 28, 2010, to Fax: 404-498-2388 Mail: MMWR CE Credit CCHIS, Centers for Disease Control and Prevention 1600 Clifton Rd, N.E., MS E-90 Atlanta, GA 30333 6. Your Certificate of Completion will be mailed to you within 30 days.
ACCREDITATION Continuing Medical Education (CME). CDC is accredited by the Accreditation Council for Continuing Medical Education to provide continuing medical education for physicians. CDC designates this educational activity for a maximum of 2.5 hours in category 1 credit toward the AMA Physician’s Recognition Award. Each physician should claim only those hours of credit that he/she actually spent in the educational activity. Continuing Education Unit (CEU). CDC has been reviewed and approved as an Authorized Provider by the International Association for Continuing Education and Training (IACET), 1620 I Street, N.W., Suite 615, Washington, DC 20006. CDC has awarded 0.2 CEUs to participants who successfully complete this program. Continuing Nursing Education (CNE). CDC is accredited as a provider of continuing nursing education by the American Nurses Credentialing Center’s Commission on Accreditation. CDC will award 2.5 contact hour(s) in CNE credit. Certified Health Education Specialist (CHES). CDC is a designated provider of continuing education contact hours (CECH) in health education by the National Commission for Health Education Credentialing, Inc. This program is a designated event for CHESs to receive 2.5 category I contact hour(s) in health education. The CDC provider number is GA0082.
depar tment of health and human ser vices department services Centers for Disease Control and Prevention
CE-2
MMWR
March 28, 2008
Goal and Objectives This report describes the need to improve external-cause-of-injury data in state-based morbidity data systems for use in injury surveillance and prevention efforts. These recommendations were developed by CDC in collaboration with state public health professionals and other injury surveillance and prevention specialists to provide background information on external-cause coding in the United States, discuss external-cause coding in state-based hospital discharge data systems (HDDS) and hospital emergency department (ED) data systems (HEDDS), and offer recommended strategies for improvement. Upon completion of this educational activity, the reader should be able to 1) describe the burden of injury in the United States, 2) describe the current status of external-cause coding in the United States, 3) describe the need for high quality external-cause-of-injury coded data in state-based morbidity data systems, 4) describe the challenges for improving external cause-of-injury coding in state-based morbidity data systems, and 5) describe the benefits of improving external-cause-of-injury coded data for use in injury surveillance activities at the local, state, and national levels. To receive continuing education credit, please answer all of the following questions. 1. An estimated 50 million injured U.S. residents need medical attention each year, and injuries account for approximately one third of ED visits and 6% of hospitalizations in the United States. A. True. B. False.
8. Almost all states have laws requiring external cause-of-injury coding for injury-related hospitalizations in their statewide HDDS but not for injury-related visits in their statewide HEDDS. A. True. B. False.
2. Completeness of external cause-of-injury coding in the United States has been consistently higher for mortality data than for morbidity data because the underlying cause of death on the death certificate for injury-related deaths is required to be an external cause. A. True. B. False.
9. Which represents a challenge to improving external cause-of-injury coding in statewide HDDS and HEDDS? A. Standards for quality assurance practice. B. Training for clinicians and health information personnel. C. Timely and ready access to data from HDDS and HEDDS by public health professionals, policy makers, and the public. D. All of the above.
3. The leading external cause of nonfatal injury-related ED visits in the United States is… A. motor-vehicle traffic. B. struck by/against. C. fall. D. cut/pierce. 4. Although the lack of external cause-of-injury coding has affected the usefulness of nonfatal injury data for injury surveillance and prevention activities in states, it has had little or no effect on national statistics. A. True. B. False. 5. Which revision of the International Classification of Diseases (ICD) is used for external cause-of-injury coding in state-based morbidity data systems in the United States? A. ICD-10. B. ICD-9. C. ICD-9-CM. D. None of the above. 6. The phrase “high-quality external cause-of-injury coding” refers to the completeness, accuracy, and specificity of external-cause-of-injury codes recorded in statewide HDDS and HEDDS data systems. A. True. B. False. 7. Which of the following is not important in obtaining high-quality external cause-of-injury coded data for injury surveillance and prevention activities in states? A. Adequate documentation of the circumstances of the injury incident in the medical record by physicians and other health-care providers. B. Adequate documentation on the medical procedures used. C. Complete and accurate coding the external cause by hospital information specialists. D. Routine recording of external cause-of-injury codes in statewide HDDS and HEDDS.
10. High-quality external cause-of-injury-coded data in statewide HDDS and HEDDS are necessary for… A. a complete and accurate picture of the injury burden. B. data-driven decisions about public health policy. C. assessment of the impact of targeted, cause-specific prevention efforts. D. all of the above. 11. Which best describes your professional activities? A. Physician. B. Nurse. C. Health educator. D. Office staff. E. Other. 12. I plan to use these recommendations as the basis for… (Indicate all that apply.) A. health education materials. B. assessing inclusion of external cause-of-injury codes in hospital reimbursement policies. C. local practice guidelines. D. public policy. E. other. 13. Overall, the length of the journal report was… A. much too long. B. a little too long. C. just right. D. a little too short. E. much too short. 14. After reading this report, I am confident I can describe the burden of injury in the United States. A. Strongly agree. B. Agree. C. Undecided. D. Disagree. E. Strongly disagree.
Fax Number
Phone Number
ZIP Code
Suite
Check One CME Credit CME for nonphysicians Credit CEU Credit CNE Credit CHES Credit
[ [ [ [ [ [ [ [ [ [ [ [ [ [ [
]B ]B ]B ]B ]B ]B ]B ]B ]B ]B ]B ]B ]B ]B ]B
[ ]D
[ [ [ [ [ [ [
[ ]C
[ [ [ [ [ [ [
]D ]D ]D ]D ]D ]D ]D
[ ]D
[ ]C
]C ]C ]C ]C ]C ]C ]C
[ ]D
[ ]C
[ [ [ [ [
]E ]E ]E ]E ]E
16. 17. 18. 19. 20. 21. 22. 23. 24. 25. 26. 27. 28.
[ [ [ [ [ [ [ [ [ [ [ [ [
]A ]A ]A ]A ]A ]A ]A ]A ]A ]A ]A ]A ]A
[ [ [ [ [ [ [ [ [ [ [ [ [
]C ]C ]C ]C ]C ]C ]C ]C ]C ]C ]C [ ]C
[ [ [ [ [ [ [ [ [ [ [
]D ]D ]D ]D ]D ]D ]D ]D ]D ]D ]D
[ [ [ [ [ [ [ [ [ [ [
]E ]E ]E ]E ]E ]E ]E ]E ]E ]E ]E [ ]D [ ]E
[ [ [ [ [ [ [ [ [ [ [ [ ]F
Date I Completed Exam
]B ]B ]B ]B ]B ]B ]B ]B ]B ]B ]B ]B ]B
Recommendations and Reports
Signature
]A ]A ]A ]A ]A ]A ]A ]A ]A ]A ]A ]A ]A ]A ]A
17. After reading this report, I am confident I can describe the challenges for improving external cause-of-injury coding in state-based morbidity data systems. A. Strongly agree. B. Agree. C. Undecided. D. Disagree. E. Strongly disagree.
[ [ [ [ [ [ [ [ [ [ [ [ [ [ [
16. After reading this report, I am confident I can describe the need for high quality external cause-of-injury coded data in state-based morbidity data systems. A. Strongly agree. B. Agree. C. Undecided. D. Disagree. E. Strongly disagree.
1. 2. 3. 4. 5. 6. 7. 8. 9. 10. 11. 12. 13. 14. 15.
15. After reading this report, I am confident I can describe the current status of external cause-of-injury coding in the United States. A. Strongly agree. B. Agree. C. Undecided. D. Disagree. E. Strongly disagree.
E-Mail Address Fill in the appropriate blocks to indicate your answers. Remember, you must answer all of the questions to receive continuing education credit!
State
or
First Name
City
Apartment
Street Address or P.O. Box
Last Name (print or type)
To receive continuing education credit, you must 1. provide your contact information (please print or type); 2. indicate your choice of CME, CME for nonphysicians, CEU, CNE, or CHES credit; 3. answer all of the test questions; 4. sign and date this form or a photocopy; 5. submit your answer form by March 28, 2010. Failure to complete these items can result in a delay or rejection of your application for continuing education credit.
Strategies to Improve External Cause-of-Injury Coding in State-Based Hospital Discharge and Emergency Department Data Systems Recommendations of the CDC Workgroup for Improvement of External Cause-of-Injury Coding
MMWR Response Form for Continuing Education Credit March 28, 2008/Vol. 57/No. RR-1 Vol. 57 / No. RR-1 CE-3
18. After reading this report, I am confident I can describe the benefits of improving external cause-of-injury coded data for use in injury surveillance activities at the local, state, and national levels. A. Strongly agree. B. Agree. C. Undecided. D. Disagree. E. Strongly disagree.
19. The learning outcomes (objectives) were relevant to the goals of this report. A. Strongly agree. B. Agree. C. Undecided. D. Disagree. E. Strongly disagree.
20. The instructional strategies used in this report (text, tables, figures, and appendix) helped me learn the material. A. Strongly agree. B. Agree. C. Undecided. D. Disagree. E. Strongly disagree.
Detach or photocopy. (Continued on pg CE-4)
MMWR
21. The content was appropriate given the stated objectives of the report. A. Strongly agree. B. Agree. C. Undecided. D. Disagree. E. Strongly disagree. 22. The content expert(s) demonstrated expertise in the subject matter. A. Strongly agree. B. Agree. C. Undecided. D. Disagree. E. Strongly disagree. 23. Overall, the quality of the journal report was excellent. A. Strongly agree. B. Agree. C. Undecided. D. Disagree. E. Strongly disagree. 24. These recommendations will improve the quality of my practice. A. Strongly agree. B. Agree. C. Undecided. D. Disagree. E. Strongly disagree.
March 28, 2008
25. The availability of continuing education credit influenced my decision to read this report. A. Strongly agree. B. Agree. C. Undecided. D. Disagree. E. Strongly disagree. 26. The MMWR format was conducive to learning this content. A. Strongly agree. B. Agree. C. Undecided. D. Disagree. E. Strongly disagree. 27. Do you feel this course was commercially biased? (Indicate yes or no; if yes, please explain in the space provided.) A. Yes. B. No. 28. How did you learn about the continuing education activity? A. Internet. B. Advertisement (e.g., fact sheet, MMWR cover, newsletter, or journal). C. Coworker/supervisor. D. Conference presentation. E. MMWR subscription. F. Other. Correct answers for questions 1–10. 1. A; 2. A; 3. C; 4. B; 5. C; 6. A; 7. B; 8. B; 9. D; 10. D.
CE-4
Vol. 57 / RR-1
Recommendations and Reports
Uses of E-Coded Data for Injury Prevention Decision Making States with quality E-coded HDDS data provide public health authorities with key data on the injury burden that help to facilitate better decision making for injury prevention (35). Collection and ready access to complete and reliable E-coded injury data have assisted federal, state, and local public health authorities in making data-driven decisions regarding public health policy and in setting priorities (8). Public health authorities have used high-quality injury morbidity data on health-care use and costs associated with specific external causes of injury to estimate the impact of targeted, cause-specific prevention efforts on the health-care system and society (36,37). Local hospital community health programs have used external cause-of-injury data to target the causes of specific injuries in their communities and make strategic decisions regarding where services should be offered. For example, in 1989, the Massachusetts Department of Health partnered with Cape Code Hospital, which had a high level of E-coding, to summarize hospital discharge data by age. Falls among older adults were the primary cause of hospitalization in this area, which had a high percentage of retirees. Hospital staff met with staff of local organizations that provided services to older adults to integrate prevention of falls into the routine services of these agencies. In addition, on the basis of an analysis of the data, the state health department channelled funds from an Office of Disability Prevention grant to a local agency to conduct home visits focused on fall prevention among older adults (Holly Hackman, MD, Massachusetts Department of Health, personnel communication, 2007). Health officials in local jurisdictions have used populationbased injury morbidity data to evaluate injury prevention efforts (14). The California Department of Public Health has used E-coded HDDS data to describe nonfatal drowning in swimming pools and spas among toddlers. E-coded data were used in 1995 to describe nonfatal drowning rates, demographic risk factors, and hospital charges (38). A later study compared drowning deaths with hospitalized nonfatal drowning cases to calculate a fatality-to-case ratio of 1:3.5 (39). Partly as a result of these and other uses of E-coded HDDS data, cities, counties, and the state began enacting pool safety requirements. For instance, in 1998, California enacted the Swimming Pool Safety Act to create a uniform statewide construction standard for safety devices for family pools and spas. Beginning in 1998, the Colorado Department of Public Health and Environment (CDPHE) used E-coded data on deaths and hospitalizations to analyze the burden of suicide and nonfatal self-harm injuries, leading to the establishment of an Office of Suicide Prevention (OSP) within CDPHE in
9
2000 (40). In 2006, OSP used information from E-coded data in obtaining federal funding for suicide prevention work, including funds from the Garrett Lee Smith Memorial Act. The analysis of E-coded data identified differences in the populations at risk for suicide compared with nonfatal self-harm hospitalizations. In Colorado, for example, the suicide rate was determined to be highest for men aged >65 years, whereas the rate of nonfatal self-harm hospitalization was determined to be highest for women aged 18–24 years (Colorado Department of Public Health and Environment, unpublished data, 2007) (2). Quality E-coded data in statewide HDDS and HEDDS also have been used by federal agencies that collect and use state injury data to monitor trends, set priorities for funding prevention programs, and assess program effectiveness in reducing nonfatal injuries. For example, CDC uses E-coded injury data from statewide HDDSs in its annual state injury indicators report to measure improvements in injury surveillance capacity of state grantees (29–31). CDC also collects external cause-of-injury data in national morbidity data systems used widely by federal and state agencies for public health policy decisions, including the National Hospital Discharge Survey, the National Hospital Ambulatory Medical Care Survey, and the National Health Interview Survey (4). The Agency for Healthcare Research and Quality (AHRQ) has established a nationwide inpatient sample and makes available statewide hospital discharge and ED data sets as part of its Healthcare Cost and Utilization Project (HCUP) (41). These surveys and data sets include E-codes (with the same limitations of accuracy, specificity and completeness as statewide HDDSs and HEDDSs) and are made available for analysis by public health researchers, medical researchers, economists, and others interested in health-care utilization, patient safety, and medical care cost issues (12,42). The Health Resources and Services Administration (HRSA) Maternal and Child Health Bureau uses available E-coded data at the state and national levels to set program objectives targeting injury prevention among children (43). The National Highway Traffic Safety Administration (NHTSA) collects E-coded data from ED and hospital discharge records as part of its state-based Crash Outcome Data Evaluation System (CODES) to help make policy decisions aimed at reducing motor-vehicle traffic-related injuries (44). Professional organizations and other nonprofit entities (e.g., the American College of Emergency Physicians, the American College of Surgeons [ACS], the American Academy of Pediatrics, the American Medical Association, the National Safety Council, the Suicide Prevention Action Network, Safe Kids, the Home Safety Council, the American Trauma Society, CSTE, STIPDA, and SAVIR]) use E-coded data in their injury prevention activities. For example, ACS has established a National Trauma Data Bank (NTDB) that contains trauma
10
MMWR
registry data from approximately 700 U.S. trauma center hospitals located across the country (45). Participating trauma centers routinely collect E-codes in their trauma registries, and these external cause-of-injury data are required for submission to NTDB (45). CDC also has worked with the ACS Committee on Trauma to establish a national sample of trauma centers that submit data to NTDB (45). CDC data are made available to medical and injury researchers to assess the quality of trauma care and to characterize injured patients, injury circumstances, injury severity, and health outcomes. The uses of E-coded data in statewide HDDS and HEDDS complements those from trauma registries of severe trauma patients treated in trauma centers by characterizing a broader representation of the injured patient population. E-codes also have been used by automobile insurance companies, health plans, health-care purchasers, and other private entities interested in injury prevention and safety issues (e.g., identifying causes associated with injuries to workers in the workplace and their families outside of the workplace and causes associated with injuries in motor-vehicle crashes). E-coded statewide HDDS and HEDDS data have been used to help identify key causes of injuries requiring medical attention that could be addressed by implementing safety measures and policies, which has resulted in cost savings to these companies. For example, hospital discharge data from the Healthcare Cost and Utilization Project—Nationwide Inpatient Sample (HCUP-NIS) were used to estimate the cost of fall-related hospitalizations in the United States (41).
Recommended Strategies for Improving E-Coding The workgroup made the following recommendations to improve E-coding in statewide HDDS and HEDDS databases.
Improve Communication Among Stakeholders Regarding E-Codes CDC should facilitate a federal effort involving agencies with relevant research, programmatic, and regulatory activities in injury prevention (e.g., AHRQ, CMS, the National Institutes of Health, HRSA, NHTSA, the Bureau of Labor Statistics, the U.S. Fire Administration, the U.S. Department of Defense, and the Veteran’s Administration) to • discuss the need and uses of high-quality E-coded nonfatal injury data for interagency collaborative efforts in injury prevention, and • assess the inclusion of E-codes in federal morbidity data systems, surveys, and data standards to facilitate routine
March 28, 2008
collection of high-quality E-codes in statewide HDDS and HEDDS databases. In collaboration with CMS and state health departments, CDC should explore the possibility of linking E-codes to uniform billing procedures used for reimbursement in government health insurance systems. CDC should facilitate a meeting of state and federal injury surveillance and prevention experts with representatives from the health plan industry; medical, nursing, and hospital administrators’ professional associations; and other health-care professional organizations to • discuss how E-coding and injury surveillance can be better used to drive injury prevention efforts in healthcare settings, at work, and at home; • solicit ideas and facilitate dialogue with these representatives regarding the efforts needed to improve E-coding in HDDS and HEDDS; • discuss efforts to make narrative documentation and coding of external cause of injury required data elements in electronic health and patient record systems and associated forms and software; • discuss how to work with electronic health record vendors to facilitate integration of plain language E-code dictionaries into software for easy point of care coding; and • demonstrate the potential business case for E-coding, from a health-care provider and purchaser perspective, such as using E-coded data to assess health-care system demands and costs of care associated with specific causes of injury (e.g., falls among older adults in nursing homes); In collaboration with STIPDA and CSTE, CDC should help facilitate implementation of the new STIPDA Injury Surveillance Workgroup recommendations for injury surveillance in all state and territorial health departments (25), including • examining the use of financial incentives, enforcements, and mandates to improve the completeness and specificity of E-coding, and • developing methods to track improvement in the completeness, accuracy, and specificity of E-codes in HDDS and HEDDS among states and territories. CDC, through the International Collaborative Effort on Injury Statistics, a group of international data experts whose focus is on the standardization of injury data (46), should communicate and share ideas and methodologies on improving external cause coding in morbidity data system with international injury data experts and researchers, WHO injury prevention program representatives, and other interested groups.
Vol. 57 / RR-1
Recommendations and Reports
Improve Collection of E-Codes In collaboration with STIPDA and CSTE, CDC should develop uniform methods to improve E-coding through costeffective quality assurance practices and evaluation, considering effective approaches already in place in certain states. Activities should include the following: • CDC should develop uniform quality assurance practices (e.g., methods for ongoing evaluation to monitor completeness, accuracy and specificity of E-codes) to ensure high-quality E-codes and require demonstration of these practices in injury surveillance capacity-building cooperative agreements with states. • State injury prevention programs should conduct ongoing evaluation to assess the completeness, accuracy, and specificity of E-coding in hospitals within their jurisdiction. • State injury prevention programs should provide feedback to data providers regarding the quality and usefulness of E-coded data (e.g., reports of the completeness and accuracy of E-coded data from their hospital; written reports to clinicians, coders, and hospital administrators showing how the data are being used). CDC, in collaboration with STIPDA and CSTE, should develop training curricula for use in educational institutions (e.g., medical schools, nursing programs, health information specialist programs) and hospitals (e.g., continuing education) aimed at raising the awareness of physicians, nurses, health information specialists, and health plan and hospital administrators regarding their role in improving external cause-ofinjury data, including training curricula for • physicians and nurses on methods to document circumstances (i.e., who, what, when, where, and how) of injury incidents in the medical record, • health information specialists with specific examples of how E-codes are used and the need for accuracy and specificity in E-coding, and • hospital and health plan administrators regarding the importance of high quality E-coded data for injury- and violence-related public health surveillance and prevention activities, and the need for hospital policies aimed at requiring high quality E-coded data. CDC, in collaboration with STIPDA and CSTE, should work with professional organizations of clinicians, nurses, medical records specialists, and health plan and hospital administrators to develop incentives and approaches to training their members on their role in collecting high quality external cause-of-injury data.
11
Improve the Usefulness of E-Coded Data for Injury Prevention Efforts CDC should engage in activities with state epidemiologists and state injury prevention directors to educate health-care workers, hospital association members, health plan staff, and the public regarding the uses of E-coded data for prevention efforts. State health departments should work with local health departments to develop and implement approaches, using local nonfatal injury data, to highlight injury as a public health concern and the importance of injury prevention in their community. All state health departments with an existing statewide HDDS should participate in CDC’s Injury Indicators Project to help improve communication among states on the use of E-coded data for injury prevention efforts. State health departments should develop and implement methods for timely and easy access to E-coded data by policy makers, program planners, researchers, and the public through the internet (e.g., reports, slide sets, fact sheets, and web-based query systems) (25).
Conclusions E-codes can provide data to guide public health decisions to reduce injuries and health-care costs in the United States. Improving E-coding in state-based hospital discharge and ED data systems is likely to help overcome current limitations of external cause-of-injury data in many states as a result of inadequate completeness and specificity. The strategies recommended in this report could facilitate communication among federal, state, and nongovernment stakeholders to determine collaborative approaches and methods for improving E-coding in these administrative data systems. These strategies are designed to improve data collection, coding, QA practices, analysis, reporting, and dissemination of E-coded data to policy makers, public health professionals, and the public. The goal is to have high-quality morbidity data by external cause of injury from all states and U.S. territories for use in monitoring trends, characterizing patterns, setting priorities for injury prevention programs, and assessing healthcare costs to reduce the burden of injury in the United States. Lessons learned in efforts to improve the quality and usefulness of E-coded data from state-based morbidity data systems have pertinence to the World Health Organization’s (WHO) Health Metrics Network (HMN) and its global initiatives to improve health data systems in developing countries (47). QA practices that have been demonstrated to be effective in collecting high-quality E-coded data in statewide
12
MMWR
HDDS and HEDDS databases could be recommended for inclusion in the HMN global initiatives. Acknowledgments
This report is based, in part, on data contributed by H Hackman, MD, Division of Violence and Injury Prevention, Massachusetts Dept of Public Health; B Hume, MPH, M McKenna, MPH, Injury Surveillance Program, Massachusetts Dept of Public Health; M Bauer, MS, S Hardman, Bur of Injury Prevention, New York State Dept of Health. References 1. Corso P, Finkelstein E, Miller T, Fiebelkorn I, Zaloshnja E. Incidence and lifetime costs of injuries in the United States. Inj Prev 2006;12:212–8. 2. CDC. Web-based Injury Statistics Query and Reporting System (WISQARS™). Atlanta, GA: US Department of Health and Human Services, CDC; 2007. Available at http://www.cdc.gov/ncipc/wisqars/ default.htm. 3. Kozak LJ, DeFrances CJ, Hall MJ. National hospital discharge survey: 2004. Annual summary with detailed diagnosis and procedure data. Vital Health Stat 2006;13(162):38. 4. Bergen G, Chen L, Warner M, Fingerhut LA. Injury in the United States, 2007 chartbook. Hyattsville, MD: US Department of Health and Human Services, CDC, National Center for Health Statistics; 2008. 5. CDC. Surveillance for fatal and nonfatal injuries—United States, 2001. In: Surveillance Summaries, September 3, 2004. MMWR 2004;53 (No. SS-7). 6. World Health Organization. International statistical classification of diseases and related health problems. Vol. 1. 10th Rev. Geneva, Switzerland: World Health Organization; 1992. 7. Miniño AM, Heron MP, Murphy SL, Kochanek KD. Deaths: final data for 2004. Natl Vital Stat Rep 2007;55:1–120. 8. US Department of Health and Human Services. Healthy people 2010 (conference ed. in 2 vols). Washington, DC: US Department of Health and Human Services; 2000. Available at http://www.healthypeople.gov. 9. CDC. Clinical modification, (ICD-9-CM). In: International classification of diseases. 6th ed. 9th rev. Hyattsville, MD: US Department of Health and Human Services, CDC; 2007. Available at http://www. cdc.gov/nchs/datawh/ftpserv/ftpicd9/ftpicd9.htm. 10. Abellera J, Annest JL, Conn JM, et al. How states are collecting and using cause of injury data: 2004 update to the 1997 report. Atlanta, GA: Council of State and Territorial Epidemiologists; 2004. Available at http://www.cste.org/pdffiles/newpdffiles/ECodeFinal3705.pdf. 11. CDC. Fatalities and injuries from falls among older adults—United States, 1993–2003 and 2001–2005. MMWR, 2006;55:1221–4. 12. Stevens JA, Corso PS, Finkelstein EA, Miller TR. The costs of fatal and non-fatal falls among older adults. Inj Prev 2006;12:290–5. 13. CDC. Falls among older adults: figures and maps. Atlanta, GA: US Department of Health and Human Services, CDC; 2006. Available at http://www.cdc.gov/ncipc/duip/adultfallsfig-maps.htm. 14. Wadman MC, Muelleman RL, Coto JA, Kellermann AL. The pyramid of injury: using ecodes to accurately describe the burden of injury. Ann Emerg Med 2003;42:468–78. 15. Rivara FP, Morgan F, Bergman AB, Maier RV. Cost estimates for statewide reporting of injuries by E coding hospital discharge abstract data base systems. Public Health Rep 1990;105:635–8.
March 28, 2008
16. Bonnie RJ, Fulco CE, Liverman CT, eds. Reducing the burden of injury: advancing prevention and treatment. Washington, DC: National Academy Press; 1999. 17. Annest JL, Conn JC, McLoughlin E, Fingerhut LA, Pickett D, Gallagher S. How states are collecting and using cause of injury data. American Public Health Association; 1998. 18. Gallagher S. E codes: the missing link in injury prevention. Newton, MA: EDC; 1994. 19. Council of State and Territorial Epidemiologists. Position statement 07-INJ-01 Improving external cause coding in hospital discharge data. Available at http://www.cste.org/position%20statements/searchby year2007final.asp. 20. American Public Health Association. Position statement: improving external cause coding in hospital discharge data. Washington, DC: American Public Health Association. 2008. Available at http://www. apha.org/advocacy/policy/policysearch/default.htm?id=1352. 21. State and Territorial Injury Prevention Directors Association. Policy resolution; improving external cause coding in hospital discharge data. Marietta, GA: State and Territorial Injury Prevention Directors Association.; 2007. Available at http://www.stipda.org/associations/5805/ files/External%20Cause%20Coding%202007.pdf. 22. Society for the Advancement of Violence and Injury Research. Policy resolution: improving external cause coding in hospital discharge data. Washington, DC: Society for the Advancement of Violence and Injury Research; 2008. Available at http://www.savirweb.org/content/ index.php?pid=93. 23. Association of State and Territorial Health Officers. Position statement: improving external cause coding in hospital discharge data. Arlington, VA: Association of State and Territorial Health Officers. Available at http://www.astho.org/pubs/E-codepositionstatement-FINAL1007.pdf. 24. State and Territorial Injury Prevention Directors’ Association. Consensus recommendations for injury surveillance in state health departments. Marietta, GA: State and Territorial Injury Prevention Directors’ Association; 1999. Available at http://www.stipda.org/associations/ 5805/files/injurysurveillance_recs.pdf. 25. State and Territorial Injury Prevention Directors’ Association. Consensus recommendations for injury surveillance in state health departments. Marietta, GA: State and Territorial Injury Prevention Directors’ Association; 2007. Available at http://www.stipda.org/displaycommon. cfm?an=8. 26. CDC. ICD-9-CM official guidelines for coding and reporting. Hyattsville, MD: US Department of Health and Human Services, CDC; 2007. Available at http://www.cdc.gov/nchs/datawh/ftpserv/ ftpicd9/icdguide07.pdf. 27. Mikkelsen G, Aasly J. Narrative electronic patient records as source of discharge diagnoses. Comput Meth Programs Biomed 2003;71:261–8. 28. LeMier M, Cummings P, West TA. Accuracy of external cause of injury codes reported in Washington state hospital discharge records. Inj Prev 2001;7:334–8. 29. CDC. State injury indicators report. Atlanta, GA: US Department of Health and Human Services, CDC; 2001. Available at http://www. cdc.gov/ncipc/pub-res/stateindicators.htm. 30. CDC. State injury indicators report—1999 data. 2nd ed. Atlanta, GA: US Department of Health and Human Services, CDC; 2004. Available at http://www.cdc.gov/ncipc/pub-res/indicators/default.htm.
Vol. 57 / RR-1
Recommendations and Reports
31. CDC. State injury indicators report 2004 data. 3rd ed. Atlanta, GA: US Department of Health and Human Services, CDC; 2007. Available at http://www.cdc.gov/ncipc/profiles/core_state/siir_2004.htm. 32. Langley J, Stephenson S, Thorpe C, Davie G. Accuracy of injury coding under ICD-9 for New Zealand public hospital discharges. Inj Prev 2006;12:58–61. 33. MacIntyre CR, Ackland MJ, Chandraraj EJ, Pilla JE. Accuracy of ICD-9-CM codes in hospital morbidity data, Victoria: implications for public health research. Aust N Z J Public Health 1997;21:477–82. 34. Hunt PR, Hackman H, Berenholz G, McKeown L, Davis L, Ozonoff V. Completeness and accuracy of International Classification of Disease (ICD) external cause of injury codes in emergency department electronic data. Inj Prev. 2007;13:422–5. 35. Minnesota Department of Health. Minnesota Data Access System (MIDAS). St. Paul, MN: Minnesota Department of Health; 2007. Available at http://www.health.state.mn.us/injury/midas/index.cfm. 36. Public Health Data Standards Consortium. Using external cause of injury codes: states’ compelling stories. Baltimore, MD: Public Health Data Standards Consortium; 2006. Available at http://www.phdsc.org/ default.asp. 37. Cohen L, Davis R, Cantor J, et al. Reducing health care costs through prevention. working document. Los Angeles, CA: Prevention Institute and the California Endowment with the Urban Institute; 2007. Available at http://www.preventioninstitute.org/healthcare.html. 38. Ellis AA, Trent RB. Hospitalizations for near drowning in California: incidence and costs. Am J Public Health 1995;85(8 Pt 1):1115–8. 39. Ellis AA, Trent RB. Swimming pool drownings and near-drownings among California preschoolers. Public Health Rep 1997;112:73–7.
13
40. Colorado State Public Law. Colorado’s Office of Suicide Prevention. Colorado Statute Title 25 Health: Administration: Article 1.5 Powers and duties of the Department of Public Health and Environment: Part 1. General powers and duties: 25-1.5-101. Denver, CO: Colorado State Government, May 1, 2000. 41. Agency for Healthcare Research and Quality. Healthcare costs and utilization project (HCUP). Rockville, MD: Agency for Healthcare Research and Quality; 2007. Available at http://www.hcup-us.ahrq.gov. 42. Coben JH, Steiner CA, Barrrett M, Merrill CT, Adamson D. Completeness of cause of injury coding in healthcare administrative databases in the United States, 2001. Inj Prev 2006;12:199–201. 43. Health Resources and Services Administration. Child health USA 2006. Washington, DC: US Department of Health and Human Services, Health Resources and Services Administration; 2006. Available at http://www.mchb.hrsa.gov/chusa_06/healthstat/0300hs.htm. 44. National Highway Traffic Safety Administration. Crash outcome data evaluation system (CODES). Washington DC: National Highway Traffic Safety Administration; 2007. Available at http://www.nrd.nhtsa. dot.gov/departments/nrd-30/ncsa/CODES.html. 45. American College of Surgeons. National trauma data bank (NTDB). Chicago, IL: American College of Surgeons; 2007. Available at http://www.facs.org/trauma/ntdb.html. 46. CDC. International collaborative effort on injury statistics. Hyattsville, MD: US Department of Health and Human Services, CDC; 2007. Available at http://www.cdc.gov/nchs/advice.htm. 47. World Health Organization. Health Metrics Network: registering births and deaths: “the job that no one wants.” Geneva, Switzerland: World Health Organization; 2007. Available at http://www.who.int/health metrics/en.
14
MMWR
March 28, 2008
Acronyms Used in This Report ACS AHRQ APHA-ICEHS ASTHO CDPHE CHHA CMS CODES CSTE DHHS E-coding ED HCUP HDDS HEDDS HMN HRSA ICD-10 ICD-9-CM NCHS NCIPC NIS NTDB OSP QA SAVIR STIPDA WHO
American College of Surgeons Agency for Healthcare Research and Quality Injury Control and Emergency Health Services Section of the American Public Health Association Association of State and Territorial Health Officers Colorado Department of Public Health and Environment Colorado Health and Hospital Association Centers for Medicare and Medicaid Services Crash Outcome Data Evaluation System Council of State and Territorial Epidemiologists Department of Health and Human Services External cause-of-injury coding Emergency department Healthcare Cost and Utilization Project Hospital discharge data system Hospital ED data system Health Metrics Network Health Resources and Services Administration International Statistical Classification of Diseases and Related Health Problems, Tenth Revision International Classification of Diseases, Ninth Revision, Clinical Modification National Center for Health Statistics National Center for Injury Prevention and Control Nationwide Inpatient Sample National Trauma Data Bank Office of Suicide Prevention Quality assurance Society for the Advancement of Violence and Injury Research State and Territorial Injury Prevention Directors Association World Health Organization
Vol. 57 / RR-1
Recommendations and Reports
15
CDC Workgroup for Improvement of External Cause-of-Injury Coding Co-chairs: Joseph L. Annest, PhD, National Center for Injury Prevention and Control, CDC; Lois A. Fingerhut,* MA, National Center for Health Statistics, CDC. Members: Susan S. Gallagher,† MPH, Tufts University School of Medicine, Boston, Massachusetts; David C. Grossman, MD, Group Health Cooperative, Seattle, Washington; Holly Hedegaard, MD, Colorado Department of Public Health and Environment, Denver, Colorado; Renee L. Johnson,§ MSPH, National Center for Injury Prevention and Control, CDC; Mel Kohn,§ MD, Oregon Department of Human Services, Portland, Oregon; Donna Pickett, MPH, National Center for Health Statistics, CDC; Karen E. Thomas, MPH, National Center for Injury Prevention and Control, CDC; Roger B. Trent,¶ PhD, California Department of Public Health, Sacramento, California. * Member, Council of State and Territorial Epidemiologists (CSTE), State and Territorial Injury Prevention Directors Association (STIPDA), and Society for the Advancement of Violence and Injury Research (SAVIR). † Member, STIPDA and SAVIR. § Member, CSTE and STIPDA. ¶ Member, STIPDA.
MMWR
The Morbidity and Mortality Weekly Report (MMWR) Series is prepared by the Centers for Disease Control and Prevention (CDC) and is available free of charge in electronic format. To receive an electronic copy each week, send an e-mail message to
[email protected]. The body content should read SUBscribe mmwrtoc. Electronic copy also is available from CDC’s Internet server at http://www.cdc.gov/mmwr or from CDC’s file transfer protocol server at ftp://ftp.cdc.gov/pub/ publications/mmwr. Paper copy subscriptions are available through the Superintendent of Documents, U.S. Government Printing Office, Washington, DC 20402; telephone 202-512-1800. Data in the weekly MMWR are provisional, based on weekly reports to CDC by state health departments. The reporting week concludes at close of business on Friday; compiled data on a national basis are officially released to the public on the following Friday. Data are compiled in the National Center for Public Health Informatics, Division of Integrated Surveillance Systems and Services. Address all inquiries about the MMWR Series, including material to be considered for publication, to Editor, MMWR Series, Mailstop E-90, CDC, 1600 Clifton Rd., N.E., Atlanta, GA 30333 or to
[email protected]. All material in the MMWR Series is in the public domain and may be used and reprinted without permission; citation as to source, however, is appreciated. Use of trade names and commercial sources is for identification only and does not imply endorsement by the U.S. Department of Health and Human Services. References to non-CDC sites on the Internet are provided as a service to MMWR readers and do not constitute or imply endorsement of these organizations or their programs by CDC or the U.S. Department of Health and Human Services. CDC is not responsible for the content of these sites. URL addresses listed in MMWR were current as of the date of publication.
✩U.S. Government Printing Office: 2008-723-026/41081 Region IV
ISSN: 1057-5987