(1983). 35 days (similar to a half-life, e-folding refers to the c Kent and ...... Planet. Sci., v. 21, p. 427â452. Woods, A. W., 1988, The fluid dynamics and thermody-.
Stratospheric Loading of Sulfur from Explosive Volcanic Eruptions 1 Gregg J. S. Bluth, William I. Rose, Ian E. Sprod, 2 and Arlin J. Krueger 3 Department of Geological Engineering and Sciences, Michigan Technological University, Houghton, Michigan 49931
ABSTRACT This paper is an attempt to measure our understanding of volcano/atmosphere interactions by comparing a box model of potential volcanogenic aerosol production and removal in the stratosphere with the stratospheric aerosol optical depth over the period of 1979 to 1994. Model results and observed data are in good agreement both in magnitude and removal rates for the two largest eruptions, El Chicho´n and Pinatubo. However, the peak of stratospheric optical depth occurs about nine months after the eruptions, four times longer than the model prediction, which is driven by actual SO 2 measurements. For smaller eruptions, the observed stratospheric perturbation is typically much less pronounced than modeled, and the observed aerosol removal rates much slower than expected. These results indicate several limitations in our knowledge of the volcano-atmosphere reactions in the months following an eruption. Further, it is evident that much of the emitted sulfur from smaller eruptions fails to produce any stratospheric impact. This suggests a threshold whereby eruption columns that do not rise much higher than the tropopause (which decreases in height from equatorial to polar latitudes) are subject to highly efficient self-removal processes. For low latitude volcanoes during our period of study, eruption rates on the order of 50,000 m 3 /s (dense rock equivalent) were needed to produce a significant global perturbation in stratospheric optical depth, i.e., greater than 0.001. However, at high (.40°) latitudes, this level of stratospheric impact was produced by eruption rates an order of magnitude smaller.
Introduction The mechanism by which large eruptions affect climate is generally accepted: injection of sulfur into the stratosphere and conversion to sulfate aerosol, which in turn reduces the solar energy reaching the earth’s surface. The sulfate aerosols produced by large eruptions also lead to depletion of stratospheric ozone through a series of chemical processes. Reactions on the surfaces of sulfate particles remove chlorine-scavenging nitrogen species, which ultimately favors chlorine-catalyzed destruction of ozone (Prather 1992). Although global sulfur emissions from volcanoes are one to two orders of magnitude less than those from anthropogenic sources (e.g., Kellogg et al. 1972; Friend 1973; Stoiber and Jepsen 1973; Holland 1978; Mo¨ller 1984; Stoiber et al. 1987; Spiro et al. 1992; Bluth et al. 1993), the climatic impact of volcanic activity is disproportionately large because explo-
sive volcanism has the ability to inject sulfur directly into the stratosphere. Bluth et al. (1993) estimated an average of 2 megatonnes (Mt) of volcanogenic SO 2 per year is injected into the stratosphere, roughly 1% of man-made tropospheric emissions; this rate was greatly influenced by just two events, Pinatubo and El Chicho´n, in their 14-year study period. However, they also related eruption rates to the historical record of Simkin (1993) and concluded that the domination of the volcanogenic contribution to the atmosphere by a few large eruptions was probably typical of the past 200 years. Climatic impacts of recent large eruptions, for example El Chicho´n and Pinatubo, on global climate have been established by examining changes in global temperatures by both surface-based records (Mass and Portman 1989) and satellite observations (Hansen et al. 1992). Jakosky (1986) investigated the linkage between volcanic column height and resulting climatic perturbation from major eruptions, including the relationships among eruption rate, latitude, and plume height. Low-latitude eruptions were generally considered more likely to
1 Manuscript received January 21, 1997; accepted June 3, 1997. 2 CIRES, Campus Box 449, University of Colorado, Boulder, CO 80309. 3 Laboratory for Atmospheres, NASA/Goddard Space Flight Center, Greenbelt, MD 20771.
[The Journal of Geology, 1997, volume 105, p. 671–683] 1997 by The University of Chicago. All rights reserved. 0022-1376/97/10506-0008$01.00
671
672
GREGG J. S. BLUTH ET AL.
affect global climate because they are more efficiently distributed into both hemispheres. Robock and Free (1995) recently summarized the major volcano activity indices (including dust and aerosol measurements, eruption explosivity, satellite and petrologic data), and evaluated the ability of these indices along with the ice core acidity record in making long-term connections between a large volcanic event and the resulting stratospheric aerosol loading. The impacts of smaller eruptions, which make up the remainder of the volcanogenic stratospheric loading, are not easily evaluated. The climatic perturbation caused by an eruption depends on its ability to inject material into the stratosphere, and it is much more difficult to predict which non-major eruptions will or will not have a measurable effect on global climate. The elevation difference between volcano summit and tropopause, implicit when considering the latitudinal factor, is crucial for the less powerful eruptions. The approach we take here is to evaluate volcano-climate connections by examining as many potential climateperturbing events as possible rather than focusing on the few largest. The Total Ozone Mapping Spectrometer (TOMS) provides near-continuous global coverage of the whole Earth on a daily basis. The data have been used to quantify sulfur dioxide from volcanic emissions based on the attenuation of wavelengthspecific reflected UV radiation by volcanic clouds (Krueger et al. 1995). Through the Nimbus and later Meteor TOMS-bearing platforms, we have a nearly continuous observation of global volcanism from 1979 to 1994. Exceptions to a truly global record include high latitude (.60°) eruptions in hemispheric winter which, because of low-light conditions, are difficult to detect and quantify. Further, the resolution of the TOMS instrument (,66 km average resolution), while ideal for very large events such as the Pinatubo eruption, cannot capture all types of eruptions, especially the numerous low-level or non-explosive eruptions from volcanoes such as Mt. Etna. The level of volcanogenic perturbation of the stratosphere can be measured by optical depth, which is the attenuation of solar irradiance by the atmosphere. It is defined as the ratio of incoming to transmitted solar energy for a particular wavelength of light (e.g., 0.55 µm). The attenuation is determined by the sum of absorption and scattering by air molecules plus any other particulates such as volcanic aerosols. The stratospheric optical depth record has been reconstructed during the period 1850 to 1990 by Sato et al. (1993); they have made
these and updated data accessible over the World Wide Web (http:/ /www.giss.nasa.gov/Data/ STRATAER/; updated June 15, 1995 by R. E. Schmunk). Sato et al. (1993) calculated stratospheric aerosol optical depth (AOD) using a variety of satellite and ground-based sources. Based on the observed variations in AOD in their dataset, we are able to link changes due to volcanogenic stratospheric impact, from pre-eruption background to post-eruption peak, of 0.0001 or greater. Large eruptions, as we will discuss here, produce changes in the global total an order of magnitude greater, which we define as ∆AOD . 0.001. Our objective is to apply, to the TOMS data of SO 2 emissions, rates of SO 2 to sulfate conversion and the removal rate of sulfate from the atmosphere, and to compare this model of potential volcanogenic aerosol loading to the record of stratospheric aerosol optical depth. We hope that these satellite data allow us a new way to evaluate sulfur pathways between the solid earth and the atmosphere. A Model of Potential Aerosol Loading Our model is constructed as follows: (1) using the TOMS SO 2 database, we apply an input of volcanogenic SO 2 injections; (2) consider the conversion rate of SO 2 to H 2 SO 4 aerosol; (3) apply a continuous removal rate to the aerosol; and (4) make a daily summation of all sulfate aerosol by reconciling the processes of addition and removal. The other major source of aerosol to the stratosphere, which maintains the non-volcanogenic background stratospheric aerosol level, is supplied by the constant oceanic emission of carbonyl sulfide (OCS). Our model includes a continuous (daily) contribution to the stratospheric aerosol by OCS, using the rate of 3.0 3 10 10 g (0.03 Mt) of sulfur per year (Chin and Davis 1995). TOMS Inventory of Volcanic SO 2 Emissions. From 1979 to 1994, the TOMS instrument detected SO 2 clouds from over 50 separate volcanic eruptions and roughly 100 individual SO 2 clouds (Bluth et al. 1993; Krueger et al. 1995) and provides the most comprehensive observation of major explosive volcanism during this period. All eruptions with Volcanic Explosivity Index (VEI: Newhall and Self 1982) values of 4 and above, those most likely to penetrate the stratosphere, have been detected during the times TOMS has been in operation. By definition, events of VEI 3 may also reach the tropopause; compared to the known record, the TOMS instrument observes about one-third of these eruptions (Bluth et al. 1993).
Journal of Geology
Table 1.
673
STRATOSPHERIC LOADING OF VOLCANIC SULFUR
SO 2 and Tephra Emissions, VEI $ 3 Eruptions, 1979–1994 a
Volcano
Date of Eruption
Sierra Negra Nyamuragira St. Helens Ambrym Hekla Ulawun Alaid Pagan Nyamuragira El Chicho´n Galunggung Galunggung Colo Pavlof Soputan Ruiz Ulawun Augustine Nyamuragira Chikurachki Chikurachki Banda Api Makian Redoubt Kelut Pinatubo Hudson Spurr Spurr Spurr La´scar Rabaul Kliuchevskoi
11/13/79 1/30/80 5/18/80 7/23/80 8/17/80 10/6/80 4/27/81 5/15/81 12/25/81 4/4/82 6/24/82 7/13/82 7/23/83 11/14/83 5/24/84 11/13/85 11/20/85 3/27/86 7/16/86 11/19/86 12/2/86 5/9/88 7/17/88 12/14/89 2/11/90 6/15/91 8/12/91 6/27/92 8/18/92 9/17/92 4/21/93 9/19/94 10/1/94
Latitude of Volcano 0.8 1.4 46.2 16.2 64.0 5.0 50.8 18.1 1.4 17.3 7.2 7.2 0.2 55.4 1.1 4.9 5.0 59.4 1.4 50.3 50.3 4.5 0.3 60.4 7.8 15.1 45.9 61.3 61.3 61.3 23.3 4.3 56.1
S S N S N S N N S N S S S N N S S N S N N S N N S N S N N N S S N
Volcano Height (km a.s.l.) 1.5 3.1 2.5 1.3 1.5 2.3 2.3 0.6 3.1 1.1 2.2 2.2 0.5 2.5 1.8 5.4 2.3 1.2 3.1 1.8 1.8 0.6 1.4 3.1 1.7 1.7 2.5 2.1 2.1 2.1 5.6 0.2 4.8
VEI
TOMS SO 2 Emitted (Mt) b
Max Tephra Height (km a.s.l.)
3 3 5 3 3 3 3 4 3 5 3 3 4 3 3 3 3 4 3 3 3 3 3 3 4 6 5 3 3 3 3 4 4
1.2 .2 1.0 .01 .5 .2 1.1 .3 4.0 7 .4 .4 .2 .05 .2 .7 .08 ,.05 .8 .5 .2 .2 .05 .2 ,.05 20 1.5 .2 .4 .23 .4 .2 .1
14 na 30 15 15 20 15 16 8 25 14 16 15 10 16 31 8 9 na 11 na 16 15 13 12 30 18 14.5 13.7 13.9 23 20 20
Eruption Rate (m 3 /s) 3,100 73,000 4,500 4,200 12,500 3,300 7,200 70 41,700 2,500 4,600 5,600 400 5,200 54,800 130 470 900 7,200 4,400 1,200 1,400 81,900 7,400 3,000 2,300 2,500 11,700 19,600 6,800
Sources. Sierra Negra: Smithsonian/SEAN (1989); Nyamuragira: Smithsonian/SEAN (1989); Mt. St. Helens: Holasek and Self (1995); Ambrym: J. Eissen, written communication, 1991; Hekla: Gro¨nvold et al. (1983); Ulawun: Sawada (1987), Smithsonian/SEAN (1989); Alaid: Sawada (1983); Pagan: Sawada (1983); El Chicho´n: Hofmann and Rosen (1983); Galunggung: Sawada (1987); Colo: Katili and Sudradjat (1984); Pavlof: McNutt (1987); Soputan: Sawada (1987); Nevado del Ruiz: Naranjo et al. (1986); Augustine: Holasek and Rose (1991); Chikurachki: SEAN Bulletin (1986a, 1986b); Banda Api: Casadevall et al. (1989); Makian: SEAN Bulletin (1988); Redoubt: Casadevall (1994); Kelut: SEAN Bulletin (1990); Pinatubo: McCormick et al. (1995); Hudson: Schoeberl et al. (1993); Spurr: Rose et al. (1995b); La´scar: Francis et al. (1993); Rabaul: Rose et al. (1995a); Kliuchevskoi: SEAN Bulletin (1994). a Eruption date 5 eruption associated with the SO2 emissions measured by the TOMS satellite instrument; a.s.l. 5 above sea level; VEI 5 Volcanic Explosivity Index, after Newhall and Self (1982); eruption rate calculated by the method of Wilson et al. (1978); na 5 no data available. b TOMS SO2 tonnages calculated using version 6 of the production algorithm.
The TOMS database of VEI $ 3 eruptions (table 1) in some cases combines closely spaced SO 2 emissions from the same event, but otherwise lists individual eruption emission data. For example, Galunggung has only two eruptions listed, although over 25 separate SO 2 clouds were identified during its eruptive activity in 1982 (Bluth et al. 1994). Both El Chicho´n and Pinatubo produced sizable SO 2 clouds prior to their cataclysmic eruptions; however we list only the major event because in both
cases the larger eruptions made discrimination of the SO 2 signal from the smaller eruptions impossible. Conversion of SO 2 to sulfate. We assume that all SO 2 injected into the stratosphere is oxidized to sulfate (e.g., Turco et al. 1983; Pinto et al. 1989). The overall conversion of SO 2 to H 2 SO 4 can be thus described by the generic reaction (Bekki 1995): SO 2 1 OH 1 3H 2 O ⇒ H 2 SO 4 (1) 1 HO 2
(1)
674
GREGG J. S. BLUTH ET AL.
Table 2. Estimations of Removal Rates for Volcanic Injections of SO2
Method Measurement (SBUV 2 Solar Backscatter Ultraviolet) a Model (one and two-dimensional photochemical) b Model (one-dimensional aerosol microphysical and photochemical) c Measurement (TOMS) d Measurement (TOMS, SBUV and MLS 2 Microwave Limb Sounder) e
Eruption
Loss Rate (e-folding) (days)
El Chicho´n
30–40
El Chicho´n
30–40
El Chicho´n
39
Pinatubo Pinatubo
35 33
a
Heath et al. (1983). McKeen et al. (1984). c Pinto et al. (1989). d Bluth et al. (1992). e Read et al. (1993). b
For the average conversion rate of stratospheric SO 2 to sulfate aerosol, we use an e-folding time of 35 days (similar to a half-life, e-folding refers to the time for an exponential decay process to remove 1/e of the initial amount). This conversion rate is in good agreement with other published values, all of which fall within the range of 30–40 days, derived from both other satellite data for various eruptions and modeling efforts (table 2). Our SO 2 conversion rate was derived from the observed decrease in cloud SO 2 mass using TOMS data, following the eruption of Mt. Pinatubo (Bluth et al. 1992). There is some uncertainty in this number, as the TOMS estimates of SO 2 masses include a number of possible errors; Krueger et al. (1995) report a typical uncertainty for a single cloud tonnage of 630%. Removal Rate of Sulfate Aerosol. Sulfate removal is dominated by gravitational sedimentation; however this rate is also dependent on the season and the size of the particles (table 3). For example, Ja¨ger and Carnuth (1987) used lidar backscatter measurements to compare aerosol decay between winter and summer periods following the El Chicho´n eruption and calculated that the net removal rate was approximately 20% slower in the wintertime. Hofmann and Rosen (1987) studied the aerosols created after the Fuego 1974 and El Chicho´n 1982 eruptions and determined different aerosol lifetimes based on particle size. The larger aerosols had a measurably shorter residence time (approximately 2 months) in the atmosphere. Pinto et al. (1989) discussed the implications of major injections of SO 2 into the atmosphere (referring to erup-
Table 3. Estimations of Removal Rates for VolcanicDerived Sulfate Aerosols
Method lidar backscatter a high altitude filter collection b satellite optical depth measurements c balloon-borne particle counters d lidar backscatter e balloon-borne particle counters f satellite optical depth measurements g
Eruptions Fuego Fuego Sierra Negra, St. Helens, Ulawun, Alaid, Pagan El Chicho´n
Removal Rate (e-folding) (months) 11.6 11.2–1.2 5–8
7.6
El Chicho´n St. Helens Alaid Fuego El Chicho´n
11.5–14.3 3.6 6.6 8–10.3 10.4–12.3
El Chicho´n
14
a
McCormick et al. (1978). Sedlacek et al. (1983). c Kent and McCormick (1984). d Hofmann and Rosen (1984). e Ja¨ger and Carnuth (1987). f Hofmann and Rosen (1987). g Yue et al. (1991). b
tions larger than El Chicho´n) and concluded that the process can be considered somewhat selflimiting: that is, the greater the sulfur mass emitted by the eruption, the larger the aerosol particles formed, and the faster they will fall out by gravity. In spite of this logic, larger eruptions appear to generally have longer residence rates in the atmosphere. Kent and McCormick (1984) studied five mid-range eruptions (Sierra Negra, St. Helens, Ulawun, Alaid, Pagan) and estimated from satellite data an average removal rate of 5–8 months. These results generally agree with Ja¨ger and Carnuth’s (1987) results using lidar (3.6 and 6.6 months for St. Helens and Alaid, respectively). The published rates listed in table 3 suggest that explosive eruptions emitting large amounts of SO 2 (Fuego and El Chicho´n) exhibit removal rates on the order of 12 months, while less productive eruptions (e.g., St. Helens, Alaid) yield removal rates on the order of 6 months. The modifying influences that seasonal fluctuations and particle sizes impart on decay rates were not considered in our simple model, as we are initially concerned with broad trends, although this is certainly a concern for more complex simulation efforts. Therefore, in our
Journal of Geology
STRATOSPHERIC LOADING OF VOLCANIC SULFUR
675
Figure 1. The main inputs and output of our potential aerosol loading model, illustrated by a subsection of results from 1991 to 1994. This period highlights the effects of the Pinatubo eruption of SO 2 (bold line) in June 1991. The conversion of SO 2 to sulfate is demonstrated with a rapid decrease in the SO 2 mass, and a corresponding increase in the sulfate aerosol mass (thin line). The rate of decay and removal of the sulfate is disturbed by subsequent injections of SO 2 (bold lines) from Hudson (August 1991), Spurr (June, August, and September 1992) and La´scar (April 1993). The observed aerosol optical depth (AOD) data (points) from Sato et al. (1993) are plotted for comparison.
model we used two different categories of sulfate removal rates based on the eruption type: El Chicho´n and Pinatubo SO 2 emissions were modeled to decay at the 12-month e-folding time, and all smaller eruptions were assumed to decay at the 6month e-folding rate. Derivation of Potential Aerosol Loading. Our model of potential stratospheric loading is demonstrated in figure 1, and the model results are presented in figure 2. The individual SO 2 injections from eruptions, and the running aerosol loading estimates, are shown along with the stratospheric aerosol index over the same time period. Our model of the sulfate loading is mainly driven by three major episodes during the period 1979–1994: the eruptions of Sierra Negra, St. Helens, and Alaid in the period 1979–1981; two closely spaced eruptions, Nyamuragira in late 1981 and El Chicho´n in mid-
1982; and the eruption of Pinatubo, followed two months later by that of Cerro Hudson, in 1991. The decay rate of the aerosol mass following these episodes was interrupted by smaller eruptions such as the ,1 Mt SO 2 eruptions by Ruiz (1985), Nyamuragira (1986), Chikurachki (1986), three eruptions of Mt. Spurr (1992), and Kliuchevskoi (1994). Discussion Evaluation of our Potential Aerosol Loading Mod-
The two most visible contrasts between our model results and the observed aerosol optical depth (figure 2) are the relative magnitudes of volcanogenic perturbations, and the timing of peak aerosol loadings and decay rates. Note that the aerosol optical depth cannot be directly related to mass in this figure; this would require detailed el.
676
GREGG J. S. BLUTH ET AL.
Figure 2. Model results of emitted masses of SO 2 (bold lines) from TOMS data and potential sulfate aerosol mass loading (thin line). This plot was generated by using the TOMS database from 1979 to 1994 of SO 2 emissions and applying rates of SO 2 to H 2 SO 4 conversion and aerosol removal to produce a potential aerosol load. Individual eruptions are listed in table 1. The stratospheric aerosol optical depth (AOD, plotted as individual points) data at λ 5 0.55 µm are determined from satellite measurements (Sato et al. 1993); the AOD is not equated with mass loading in this figure. Note the lag between the post-eruption model aerosol production versus the AOD peaks, and the differences between modeled and observed aerosol decay rates.
knowledge of aerosol composition and particle size distribution for each eruption cloud. However, independent evaluations of the El Chicho´n (12 Mt) and Pinatubo (30 Mt) mass loadings (e.g., McCormick et al. 1995) suggest that our model adequately describes the peak aerosol loading for at least the two major eruptions. The modeled perturbations for the range of smaller-sized eruptions show many deviations from the observed record. In the period prior to the eruption of El Chicho´n, five eruptions (Sierra Negra, St. Helens, Ulawun, Alaid, and Pagan) identified by Kent and McCormick (1984) in the hemispheric record cannot be as easily distinguished in the global record of Sato and coworkers. From 1979 to late 1981, the AOD record exhibits much smaller perturbations due to volcanic eruptions
than is suggested by our simulations. An obvious limitation of our model is that all emitted sulfur is assumed to produce a sulfate aerosol, which the optical depth record indicates did not occur. Still, the overall increase in aerosol loading predicted by our mass-loading model from 1979 to 1982 is in agreement with the optical depth record, which suggests that the cumulative effect of these eruptions was significant. Following the eruption of El Chicho´n in 1981, the optical depth record shows a gradual decrease in aerosols punctuated by several small injections; this trend continues for nearly 10 years until the eruption of Pinatubo. The optical depth record shows a jump at the beginning of 1985, which does not appear in the aerosol mass records derived by Hofmann (1990) from balloon soundings. This peak
Journal of Geology
STRATOSPHERIC LOADING OF VOLCANIC SULFUR
is not discussed by Sato et al. (1993), but it coincidentally occurs close to when SAGE II (the stratospheric aerosol and gas experiment—II) data were first used to derive a stratospheric optical depth record. Since there are no known eruptions occurring at this time, we suspect that this anomaly is instrumental and not related to a volcanic event. The eruption of Nevado del Ruiz produced a sharp signal in the record at the end of 1985. The eruptions of Nyamuragira in July 1986 and Chikurachki in late 1986 do not appear as spikes in the global record but can be discerned in the hemispherical optical depth data of Sato et al. (1993). As before, the volcanogenic perturbations to the AOD record are much less pronounced than our model predicts. The eruption of Kelut, Indonesia in February 1990 has been connected to a global impact (e.g., McCormick and Veiga 1992), but Yue et al. (1994) indicated that the Kelut cloud was confined to the southern hemisphere; this conclusion is in agreement with the latitudinal optical depth data from Sato et al. (1993). The latitudinal data (in 10 degree bands) indicate that an increase in optical depth at the low southern latitudes began in February and lasted approximately 3 months before returning to previous levels. Possibly related to the Kelut eruption is a second increase in the AOD record that occurred at high southern latitudes in June and lasted for several months. However, the Sato et al. (1993) data show that a global-scale aerosol signal first occurred in January 1990, originating in high northern latitudes. This corresponds to the timing and location of the December 1989 eruption of Mt. Redoubt, Alaska. Based on the data of Sato et al. (1993) it thus appears that the global perturbation in optical depth during early 1990 was associated with the Redoubt, rather than the Kelut eruption. The timing of the peak optical depth perturbation typically lags behind that of the modeled aerosol peak loading, which suggests a discrepancy in the rate of SO 2 to sulfate aerosol conversion. We do not know the reason for this offset. The lag is somewhat greater for the large eruptions: for the El Chicho´n and Pinatubo eruptions, the peak occurred approximately 9 months later, which would require an SO 2 e-folding decay rate of about 4.5 months. The rates of SO 2 removal (table 2) were derived from a variety of measurements and models, and it seems unlikely that they are all wrong by a factor of four. One possibility is that the formation of sulfate aerosol (McKeen et al. 1984; Pinto et al. 1989) lags behind the destruction of SO 2 because this process is the result of a series of reactions, and only the first of these (the removal of SO 2 by the
677
OH radical) is detected by the TOMS instrument as the SO 2 decreases. Consequently, in our model we equate the removal of SO 2 with the simultaneous creation of sulfate aerosol. These results suggest that another reaction in the sequence leading to sulfate aerosol is rate-limiting. The aerosol decay rate (12 month e-folding) for the two largest eruptions matches well with the optical depth record. Yue et al. (1991) noted that the aerosol removal time following the Ruiz eruption was similar to that of El Chicho´n, although smaller-sized eruptions is general display a more rapid removal rate than do El Chicho´n and Pinatubo (as suggested by the published rates in table 3). The small anomalies produced by several events between 1987 and 1991 show a rapid decrease, as also generally predicted from the literature. But in the broader sense, the AOD record clearly deviates from the modeled aerosol removal. For example, the period from 1986 to 1991 demonstrates a much slower overall AOD decay than predicted; this observed rate represents an e-folding of about 4 years, approximately eight times the rate measured for mid-sized eruptions. There is little information regarding the cumulative effects of multiple eruptions, nor the viability of the aerosol removal rates beyond the first few e-folding periods. The rates are typically derived in the periods immediately following the eruptions until a subsequent eruption muddies the picture. Several perturbations between 1987 and 1991 occur in the AOD record but not in the model (i.e., the TOMS SO 2 record). There are most likely gaps in potential loading due to errors in the original SO 2 database, for example when considering the eruptions that TOMS either does not observe or only partially detects. Most notable are the high-latitude eruptions that occur in Kamchatka and Alaska during the winter months. It is quite possible that eruptions in these areas are underrepresented in the TOMS data and therefore in our model. For example, the March 1986 eruption of Mt. St. Augustine, Alaska, was a VEI 4 eruption but was observed by TOMS for only one day with an estimated emission of less than 50 kilotons SO 2 (unpublished data). Likewise, the December 1989 eruption of Redoubt, Alaska was not observed by TOMS until it passed over Nevada two days later, when approximately 100 kilotons were observed; the total tonnage of this VEI 3 eruption was estimated to be 175 kilotons SO 2 based on an assumed SO 2 decay rate over those two days (Schnetzler et al. 1994). Therefore, although it is unlikely that our potential aerosol loading model accurately replicates the actual loading produced by the 15 years of volcanism, it should
678
GREGG J. S. BLUTH ET AL.
at least capture the major features of the period as imparted on the stratospheric chemistry. These examples illustrate the difficulty in interpreting the global stratospheric optical depth record in the context of volcanic eruptions. It is possible to match many known volcanic eruptions with an optical depth signal, yet there are enough ‘‘unknown’’ anomalies and gaps in the data to make this a risky effort. The contribution from large eruptions appears fairly straightforward, and by our analyses it looks like perhaps 5–10 more eruptions during the 15 years of observation can be connected, either individually or as combined closely spaced events, to changes in the global record. In general however, the optical depth signals of all these smaller eruptions are muted. What follows is an attempt to discover why this is true. Eruption Rates and Stratospheric Impact. The period from 1979 to 1994 included a number of highly explosive events (i.e., VEI 4 and 5; see table 1) that have little or no global impact. The ability of an eruption to affect the stratosphere can be related to its explosivity and emitted sulfur mass, as well as latitude and summit altitude (i.e., vertical distance from the tropopause). Here we attempt to place some useful constraints on an energy threshold for volcanic activity, below which eruptions are unlikely to penetrate the tropopause. Wilson et al. (1978; derived from Morton et al. 1956) presented a simple relationship by which average eruption rates could be calculated from volcanic eruption cloud heights, by the following equation: H 5 8.2 Q 1/4
(2)
Q 5 βυs(θ 2 θ a )F
(3)
and
where H is the final height that a buoyant column will rise, in meters, and Q is the steady state of energy release. Its components (and values used here, in parentheses) are bulk rock density β (2500 kg/ m 3 ), eruption rate υ (to be solved for, in m 3 /s), specific heat s (1.1 3 10 3 Jkg21 K21 ), temperatures of eruption products and their ultimate cooled temperature, θ 2 θ a (900 K), and thermal efficiency, F (70%). Details and justifications of these relationships can be found in Wilson et al. (1978). Equations (2) and (3) can then be manipulated to produce a relationship to determine eruption rates, knowing the maximum cloud heights:
υ 5 (H/8.2)4 /1.7325 3 10 9
(4)
Wilson et al. (1978) note that this relationship assumes a sustained eruption rate, whereas the column heights used are maximum observed values; therefore, these rates are best considered as maximum energy releases. We now compare the stratospheric impacts of volcanic eruptions during the period 1979 to 1995 as functions of their latitudinal position and calculated eruption rates. In table 1, we have assembled information on the column heights for as many of the eruptions as possible. Using equation (4), the eruption rates are derived for each eruption and plotted according to latitude in figure 3. The measure of ‘‘stratospheric impact‘‘ is taken directly from the aerosol optical depth database of Sato et al. (1993), with values shown in table 4. The eruption impact levels in figure 3 reflect the magnitude of the observed change in global aerosol optical depth (AOD) at λ 5 0.55 µm before and after the eruption. Some eruptions (e.g., Kelut) produced no noticeable change in the global database yet were associated with an observable change at the latitudinal level. Changes in global AOD level of .0.01 occurred only for two eruptions, El Chicho´n (net increase of 0.0856) and Pinatubo (net increase of 0.1439). Significant changes on the order of 0.001 to 0.01 can be easily discerned from background levels (figure 2). This level of perturbation occurred following five eruptions, four at high latitudes (St. Helens, Alaid, Redoubt and Hudson) and one at low latitudes (Ruiz). Small changes in the global AOD, between 0.0001 and 0.001, occurred following eruptions of Sierra Negra and Ulawun. However, changes of this magnitude also occur with no associated volcanism, and may be within the uncertainty of the optical depth data. The importance of the elevation difference between the volcano and the stratosphere can be demonstrated by the observation in figure 3 that highlatitude eruptions can produce large (.0.001) changes in AOD at lower (approximately an order of magnitude) eruption rates than equatorial eruptions. There are, however, many uncertainties associated with these data, not the least of which include the limited number of observed eruptions. Some of the data on eruption column heights are poorly known (e.g., Chikurachki), which makes it difficult to assign absolute values based on the short period of record we are examining here. We have assumed that changes in the optical depth record associated both in time and space with known
Journal of Geology
STRATOSPHERIC LOADING OF VOLCANIC SULFUR
679
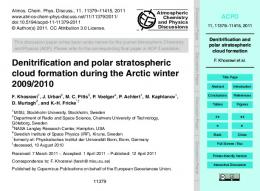
Figure 3. The stratospheric impact of explosive eruptions as defined by latitudinal location and eruption rate (calculated after Wilson et al. 1978) during the period 1979–1994. Unfilled triangles indicate eruptions that remained below the tropopause; filled triangles represent eruptions that reached the stratosphere. Those eruptions that were determined to produce a measurable perturbation to the global aerosol optical depth levels are categorized by increasing symbol size. The level of stratospheric impact of an eruption was determined using the data of Sato et al. (1993) to identify the magnitude of associated change in global optical depth.
eruptions are indeed related, which may not be strictly true. In figure 3 we do not discriminate amongst emitted sulfur levels for the eruptions, although the amount of sulfur injected into the stratosphere varies widely, as shown in figure 2. The general (log-log) connection between emitted sulfur and explosivity has been earlier discussed by Bluth et al. (1993) and is further explored by Schnetzler et al. (1997) using the same TOMS SO 2 dataset. The fissure eruption of Nyamuragira in December 25, 1981 has a low reported column height and consequently a relatively low eruption rate. Originally termed the ‘‘mystery eruption’’ it is now recognized as having reached the tropopause (e.g., Hofmann 1990; Krueger et al. 1996), although it is not recognizable in the Sato et al. (1993) database. Thordarson and Self (1996) described a mechanism by which effusive eruptions (e.g., Columbia River basalts) are capable, due to massive emissions from
tightly constrained fissures, of sustaining eruption columns capable of reaching the upper troposphere and stratosphere. A more reasonable eruption rate calculation requires assumptions about vent geometry and eruptive activity for which we have no data, and therefore we do not include Nyamuragira in figure 3. The changes in background levels during this time can be seen in table 4 and are displayed graphically in figure 2. This is important because the ability to discern an individual eruption’s impact also depends on previous global volcanic activity. For example, following the eruption of Pinatubo changes in global optical depth from smaller-sized eruptions are masked (the change in AOD values following Hudson are estimated from the latitudinal record before the influence of Pinatubo’s eruption reached the high southern latitudes). Therefore, an eruption such as Sierra Negra, which occurred during a relatively ‘‘clean’’ period, may
680 Table 4. sphere
GREGG J. S. BLUTH ET AL.
Volcanogenic Perturbations of the Strato-
Volcano
Eruption Date
Change in Stratospheric AOD (background $ post-eruption peak) a
Sierra Negra St. Helens Ulawun Alaid Pagan Nyamuragira El Chicho´n Ruiz Chikurachki Redoubt Kelut Pinatubo Hudson La´scar Kliuchevskoi
11/13/79 5/18/80 10/6/80 4/27/81 5/15/81 12/25/81 4/4/82 11/13/85 11/19/86 12/14/89 2/11/90 6/15/91 8/12/91 4/21/93 10/1/94
.0025 $ .0030 .0030 $ .0053 .0051 $ .0053 .0042 $ .0054 latitudinal latitudinal .0056 $ .0912 .0096 $ .0157 latitudinal .0053 $ .0074 latitudinal .0053 $ .1492 (.0010 2 .0100) b latitudinal latitudinal
Numbers refer to change in global optical depth level at λ 5 0.55 µm following the eruption, using the database of Sato et al. (1993). ‘‘Latitudinal’’ refers to observable changes in latitudinal (10° band) aerosol optical depth levels, but no noticeable change in global values. b Changes following the eruption of Hudson are estimated, due to masking effect of Pinatubo. a
have produced no noticeable stratospheric impact had it occurred in either the post-El Chicho´n or post-Pinatubo era. Likewise, the three eruptions of Mt. Spurr in 1992 may well have produced stratospheric perturbations that could not be observed due to the influence of Pinatubo. The connection between latitude and stratospheric impact can be explained by a cloud’s ability to rapidly rise through the tropopause. Also, eruptions with insufficient eruption rates appear to be much more rapidly removed from the atmosphere. Woods and Kienle (1994), following the model of Woods (1988), calculated expected column heights based on mass eruption rates and noted that column heights do not rise steadily in the troposphere but instead increase much more slowly near the tropopause. The tropopause is a region of minimum temperatures in the vertical atmospheric profile. Because the buoyancy of a volcanic cloud depends on its warmth relative to the surrounding air mass, the tropopause could serve as a cold trap, which either partially or fully prevents volcanic (water-rich) clouds from reaching the stratosphere. Once a cloud passes through the tropopause the rate of buoyant rise must decrease or stop completely, which would increase removal of material by sedimentation. The enhanced ability of high-latitude eruptions
to penetrate the tropopause has been noted by earlier authors; here we were able to add some numerical constraints based on a broad range of eruptions during a 15-year period of observations. Based on our dataset, eruption rates of greater than 40,000 m 3 /s dense rock equivalent are needed to produce a significant stratospheric impact (∆AOD . 0.001) on the global optical depth levels from low (,30°) latitudes. In contrast, high (.40°) latitude eruptions appear to have affected similar global levels with eruptions rates as little as 1000 m 3 /s. Conclusions A box model of atmospheric aerosol loading was constructed using the database of volcanic SO 2 emissions for the period 1979–1994 from the Total Ozone Mapping Spectrometer (TOMS), and assumed rates of SO 2 conversion to H 2 SO 4 and aerosol removal. The model results were compared to the aerosol optical depth reconstructions by Sato et al. (1993). The modeled and observed perturbations by the 1982 eruption of El Chicho´n and 1991 eruption of Pinatubo are in general agreement, suggesting that the TOMS SO 2 tonnages and aerosol removal rates adequately model the effects of large eruptions. However, the peak aerosol formation in our model, derived from published rates of post-eruption SO 2 decay, occurs approximately four times faster than the observed AOD peaks. This lag is of research interest because it may highlight a way to clarify the processes of sulfate formation. Since the destruction of SO 2 occurs faster than the rise of aerosol, the longer period of sulfate buildup may be controlled by another, subsequent reaction. The use of multiple remote sensing tools seems to be a productive avenue of research for examining this process. For the range of smaller eruptions, the observed stratospheric perturbation is typically muted compared to the model, and the observed aerosol removal rates at up to eight times slower than expected. The comparison of our potential loading model and the optical depth record strongly suggests that measurable stratospheric perturbations are generated by combined injections from closely spaced eruptions, thus the effect of volcanic activity on climate is not confined to the few large eruptions that occur every few decades, such as El Chicho´n and Pinatubo. The cumulative effect of smaller-sized eruptions on the stratosphere is also indicated because of slow aerosol removal rates observed in the 8 year period following the El Chicho´n
Journal of Geology
STRATOSPHERIC LOADING OF VOLCANIC SULFUR
eruption. These results suggest that our knowledge of the volcano-atmosphere reactions and pathways in the few months following an eruption is somewhat limited; detailed mass balance analyses of sulfur dioxide and sulfate aerosol are needed to explore these conversion and decay rates in closer detail. Comparison of our model and observations demonstrates that much of the potential sulfur loading from mid-range eruptions (VEI 3–4) is removed before reaching the stratosphere, thus greatly limiting the effect that these eruptions can have on climate. The characteristic temperature minimum at the tropopause acts as a barrier to volcanic columns by reducing their rate of buoyant ascension, and by acting as a cold trap to remove ‘‘wet’’ air (water 1 adsorbed particles 1 dissolved gases) entrained by the eruption column from the lower atmosphere. These removal processes are most efficient for eruptions that reach to or only slightly above the tropopause. We have made some simple calculations of eruption rates in order to begin to quantify the relationships among eruption intensity, vol-
681
cano-tropopause elevation difference, and stratospheric impact (∆AOD). During the period of 1979– 1994, at low latitudes (,30°) only eruptions with eruption rates .40,000 m 3 /s dense rock equivalent produced a significant global impact (∆AOD . 0.001). In contrast, the eruption rates of high-latitude (.40°) eruptions, which have a relatively shorter path to reach the stratosphere, were sufficient to produce global-scale stratospheric loading with an order of magnitude less intensity. ACKNOWLEDGMENTS
This work was supported by grants to GJSB from NASA’s Volcano-Climate and Aerosol programs. We thank C. Schnetzler and two anonymous reviewers for numerous helpful suggestions to improve this paper. This research has benefited from many discussions with our colleagues in the TOMS SO 2 working group at NASA’s Goddard Space Flight Center, namely S. Doiron, N. Krotkov, C. Schnetzler, and L. Walter.
REFERENCES CITED
Bekki, S., 1995, Oxidation of volcanic SO 2 : a sink for stratospheric OH and H 2O: Geophys. Res. Lett., v. 22, p. 913–916. Bluth, G. J. S.; Casadevall, T. J.; Schnetzler, C. C.; Doiron, S. D.; Walter, L. S.; Krueger, A. J.; and Badruddin, M., 1994, Evaluation of sulfur dioxide emissions from explosive volcanism: The 1982–1983 eruptions of Galunggung, Java, Indonesia: Jour. Volc. Geotherm. Res., v. 63, p. 243–256. ———; Doiron, S. D.; Krueger, A. J.; Walter, L. S.; and Schnetzler, C. C., 1992, Global tracking of the SO 2 clouds from the June, 1991 Mount Pinatubo eruptions: Geophys. Res. Lett., v. 19, p. 151–154. ———; Schnetzler, C. C.; Krueger, A. J.; and Walter, L. S., 1993, The contribution of explosive volcanism to global atmospheric sulphur dioxide concentrations: Nature, v. 366, p. 327–329. Casadevall, T. J., 1994, The 1989–1990 eruptions of Redoubt volcano, Alaska: Impacts on aircraft operations: Jour. Volc. Geotherm. Res., v. 62, p. 301–316. ———; Pardyanto, L.; Abas, H.; and Tulus, 1989, The 1988 eruptions of Banda Api volcano, Mauku, Indonesia: Geol. Indonesia, v. 12, p. 603–635. Chin, M., and Davis, D. D., 1995, A reanalysis of carbonyl sulfide as a source of stratospheric background sulfur aerosol: Jour. Geophys. Res., v. 100, p. 8993– 9005. Francis, P. W.; Self, S.; Oppenheimer, C. M.; and Rothery, D. A., 1993, The April 1993 eruption of La´scar, north
Chile: observations and inferences: Eos, Trans. Am. Geophys. Union (abs.), v. 74, p. 651. Friend, J. P., 1973, The global sulfur cycle, in Rasool, S. I., ed., Chemistry of the Lower Atmosphere: New York, Plenum Press, p. 177–201. Gro¨nvold, K.; Larsen, G.; Einarsson, P.; Thorarinsson, S.; and Saemundsson, K., 1983, The Hekla eruption 1980–1981: Bull. Volc., v. 46–4, p. 349–363. Hansen, J.; Lacis, A.; Ruedy, R.; and Sato, M., 1992, Potential climate impact of Mount Pinatubo eruption: Geophys. Res. Lett., v. 19, p. 215–218. Heath, D. F.; Schlesinger, B. M.; and Park, H., 1983, Spectral change in the ultraviolet absorption and scattering properties of the atmosphere associated with the eruption of El Chicho´n: Stratospheric SO 2 budget and decay: Eos Trans. Am. Geophys. Union (abs.), v. 64, p. 197. Hofmann, D. J., 1990, Increase in the stratospheric background sulfuric acid aerosol mass in the past 10 years: Science, v. 248, p. 996–1000. ———, and Rosen, J. M., 1983, Stratospheric sulfuric acid fraction and mass estimate for the 1982 volcanic eruption of El Chichon: Geophys. Res. Lett., v. 10, p. 313– 316. ———, and ———, 1984, On the temporal variation of stratospheric aerosol size and mass during the first 18 months following the 1982 eruptions of El Chicho´n: Jour. Geophys. Res., v. 89, p. 4883–4890. ———, and ———, 1987, On the prolonged lifetime of
682
GREGG J. S. BLUTH ET AL.
the El Chicho´n sulfuric acid aerosol cloud: Jour. Geophys. Res., v. 92, p. 9825–9830. Holasek, R. E., and Rose, W. I., 1991, Anatomy of 1986 Augustine volcano eruptions as recorded by multispectral image processing of digital AVHRR weather satellite data: Bull. Volc., v. 53, p. 420–435. ———, and Self, S., 1995, GOES weather satellite observations and measurements of the May 18, 1980, Mount St. Helens eruption: Jour. Geophys. Res., v. 100, p. 8469–8487. Holland, H. D., 1978, The Chemistry of the Atmosphere and Oceans: New York, Wiley, 351 p. Ja¨ger, H., and Carnuth, W., 1987, The decay of the El Chichon stratospheric perturbation, observed by lidar at northern midlatitudes: Geophys. Res. Lett., v. 14, p. 696–699. Jakosky, B. M., 1986, Volcanoes, the stratosphere, and climate: Jour. Volc. Geotherm. Res., v. 28, p. 247–255. Katili, J. A., and Sudradjat, S., 1984, The devastating 1983 eruption of Colo Volcano, Una-Una Island, Central Sulawesi, Indonesia: Geologisch. Jarb., v. A75, p. 27– 47. Kellogg, W. W.; Cadle, R. D.; Allen, E. R.; Lazrus, A. L.; and Martell, E. A., 1972, The sulfur cycle: Science, v. 175, p. 587–596. Kent, G. S., and McCormick, M. P., 1984, SAGE and SAM II measurements of global stratospheric aerosol optical depth and mass loading: Jour. Geophys. Res., v. 89, p. 5029–5041. Krueger, A. J.; Walter, L. S.; Bhartia, P. K.; Schnetzler, C. C.; Krotkov, N. A.; Sprod, I.; and Bluth, G. J. S., 1995, Volcanic sulfur dioxide measurements from the Total Ozone Mapping Spectrometer (TOMS) instruments: Jour. Geophys. Res., v. 100, p. 14,057–14,076. ———; Schnetzler, C. C.; and Walter, L. S. 1996, The December 1981 eruption of Nyamuragira Volcano (Zaire) and the origin of the ‘‘mystery cloud’’ of early 1982: Jour. Geophys. Res., v. 101, p. 15,191–15,196. Mass, C. F., and Portman, D. A., 1989, Major volcanic eruptions and climate: A critical evaluation: Jour. Climate, v. 2, p. 566–593. McCormick, M. P., and Veiga, R. E., 1992, SAGE II measurements of early Pinatubo aerosols: Geophys. Res. Lett., v. 19, p. 155–158. ———; Swissler, T. J.; Chu, W. P.; and Fuller, W. H., Jr., 1978, Post-volcanic stratospheric aerosol decay as measured by lidar: Jour. Atmos. Sci., v. 35, p. 1296– 1303. ———; Thomason, L. W.; and Trepte, C. R., 1995, Atmospheric effects of the Mt. Pinatubo eruption: Nature, v. 373, p. 399–404. McKeen, S. A.; Liu, S. C.; and Kiang, C. S., 1984, On the chemistry of stratospheric SO 2 from volcanic eruptions: Jour. Geophys. Res., v. 89, p. 4873–4881. McNutt, S. R., 1987, Eruption characteristics and cycles at Pavlof volcano, Alaska, and their relation to regional earthquake activity: Jour. Volc. Geotherm. Res., v. 31, p. 239–267. Mo¨ller, D., 1984, Estimation of the global man-made sulphur emission: Atmos. Environ., v. 18, p. 19–27.
Morton, B. R.; Taylor, G.; and Turner, J. S. 1956, Turbulent gravitational convection from maintained and instantaneous sources: Proc. Royal Soc., Series A, v. 234, p. 1–23. Naranjo, J. L.; Sigurdsson, H.; Carey, S. N.; and Fritz, W., 1986, Eruption of the Nevado del Ruiz volcano, Colombia, on 13 November 1985: tephra fall and lahars: Science, v. 233, p. 961–963. Newhall, C. G., and Self, S., 1982, The volcanic explosivity index (VEI): An estimate of explosive magnitude for historical volcanism: Jour. Geophys. Res., v. 87, p. 1231–1238. Pinto, J. P.; Turco, R. P.; and Toon, O. B., 1989, Selflimiting physical and chemical effects in volcanic eruption clouds: Jour. Geophys. Res., v. 94, p. 11,165– 11, 174. Prather, M., 1992, Catastrophic loss of stratospheric ozone in dense volcanic clouds: Jour. Geophys. Res., v. 97, p. 10,187–10,191. Read, W. G.; Froidevaux, L.; and Waters, J. W., 1993, Microwave Limb Sounder measurement of stratospheric SO 2 from the Mt. Pinatubo volcano: Geophys. Res. Lett., v. 20, p. 1299–1302. Robock, A., and Free, M. P., 1995, Ice cores as an index of global volcanism from 1850 to the present: Jour. Geophys. Res., v. 100, p. 11,549–11,567. Rose, W. I.; Delene, D. J.; Schneider, D. J.; Bluth, G. J. S.; Krueger, A. J.; Sprod, I.; McKee, C.; Davies, H. L.; and Ernst, G. G. J., 1995a, Ice in Rabaul eruption cloud of 19–21 September 1994: Nature, v. 375, p. 477– 479. ———; Kostinski, A. B.; and Kelley, L., 1995b, Real-time C-band radar observations of 1992 eruption clouds from Crater Peak, Mount Spurr Volcano, Alaska, in Keith, T. E. C., ed., U. S. Geol. Survey Bull. 2139, p. 19–26. Sato, M.; Hansen, J. E.; McCormick, M. P.; and Pollack, J. B., 1993, Stratospheric aerosol optical depth, 1850– 1990: Jour. Geophys. Res., v. 98, p. 22,987–22,994. Sawada, Y., 1983, Analysis of eruption clouds by the 1981 eruptions of Alaid and Pagan volcanoes with GMS images: Pap. Meteor. Geophys., v. 34, p. 307–324. ———, 1987, Study on analyses of volcanic eruptions based on eruption cloud image data obtained by the Geostationary Meteorological Satellite (GMS): Seismology and Volcanology Research Division, Meteorological Research Institute, Japan, 335 p. Schnetzler, C. C.; Bluth, G. J. S.; Krueger, A. J.; and Walter, L. S., 1997, A proposed volcanic sulfur dioxide index (SEI): Jour. Geophys. Res., in press. ———; Doiron, S. D.; Walter, L. S.; and Krueger, A. J., 1994, Satellite measurement of sulfur dioxide from the Redoubt eruptions of 1989-1990: Jour. Volc. Geotherm. Res., v. 62, p. 353–357. Schoeberl, M. R.; Doiron, S. D.; Lait, L. R.; Newman, P. A.; and Krueger, A. J., 1993, A simulation of the Cerro Hudson SO 2 cloud: Jour. Geophys. Res., v. 98, p. 2949–2955. SEAN Bulletin, 1986a, Chikurachki volcano, v. 11, no. 11, p. 2–3.
Journal of Geology
STRATOSPHERIC LOADING OF VOLCANIC SULFUR
———, 1986b, Chikurachki volcano, v. 11, no. 12, p. 5– 7. ———, 1988, Makian volcano, v. 13, no. 8, p. 6. ———, 1990, Kelut, v. 15, no. 1, p. 2–3. ———, 1994, Kliuchevskoi, v. 19, no. 9, p. 2–3. Sedlacek, W. A.; Mroz, E. J.; Lazrus, A. L.; and Gandrud, B. W., 1983, A decade of stratospheric sulfate measurements compared with observations of volcanic eruptions: Jour. Geophys. Res., v. 88, p. 3741–3776. Simkin, T., 1993, Terrestrial volcanism in space and time: Ann. Rev. Planet. Sci., v. 21, p. 427–452. Smithsonian/SEAN, 1989, Global Volcanism, 1975– 1985: McClelland, L., et al., eds., Englewood Cliffs, New Jersey, Prentice Hall, 655 p. Spiro, P. A.; Jacob, D. J.; and Logan, J. A., 1992, Global inventory of sulfur emissions with a 1° by 1° resolution: Jour. Geophys. Res., v. 97, p. 6023–6036. Stoiber, R. E., and Jepsen, A., 1973, Sulfur dioxide contributions to the atmosphere by volcanoes: Science, v. 182, p. 577–578. ———; Williams, S. N.; and Huebert, B., 1987, Annual contribution of sulfur dioxide to the atmosphere by volcanoes: Jour. Volc. Geotherm. Res., v. 33, p. 1–8. Thordarson, Th., and Self, S., 1996, Sulfur, chlorine and fluorine degassing and atmospheric loading by the Roza eruption, Columbia River Basalt Group, Wash-
683
ington, U.S.A.: Jour. Volc. Geotherm. Res., v. 74, p. 49–73. Turco, R. P.; Toon, O. B.; Whitten, R. C.; Hamill, P.; and Keesee, R. G., 1983, The 1980 eruptions of Mount St. Helens: physical and chemical processes in the stratospheric clouds: Jour. Atmos. Res., v. 88, p. 5299–5319. Wilson, L.; Sparks, R. S. J.; Huang, T. C.; and Watkins, N. D., 1978, The control of volcanic column heights by eruption energetics and dynamics: Jour. Geophys. Res., v. 83, p. 1829–1836. Woods, A. W., 1988, The fluid dynamics and thermodynamics of eruption columns: Bull. Volc., v. 50, v. 169– 193. ———, and Kienle, J., 1994, The injection of volcanic ash into the atmosphere, in Volcanic Ash and Aviation Safety: Proc. First Int. Symposium on Volcanic Ash and Aviation Safety: U.S. Geol. Survey Bull. 2047, p. 101–106. Yue, G. K.; McCormick, M. P.; and Chiou, E. W., 1991, Stratospheric aerosol optical depth observed by Stratospheric Aerosol and Gas Experiment II: Decay of the El Chichon and Ruiz volcanic perturbations: Jour. Geophys. Res., v. 96, p. 5209–5219. ———; Veiga, R. E.; and Wang, P. -H., 1994, SAGE II observations of a previously unreported stratospheric volcanic aerosol cloud in the northern polar summer of 1990: Geophys. Res. Lett., v. 21, p. 429–432.