Proceedings of the 2005 Winter Simulation Conference M. E. Kuhl, N. M. Steiger, F. B. Armstrong, and J. A. Joines, eds.
STRESS TESTING A SUPPLY CHAIN USING SIMULATION Sanjay Jain
Swee Leong
School of Business The George Washington University Funger Hall, 2201 G Street, NW Washington, DC 20052, U.S.A.
National Institute of Standards and Technology 100 Bureau Drive Gaithersburg, MD 20899, U.S.A.
ABSTRACT
•
Simulation provides the capability to evaluate performance of a system operating under current or proposed configurations, policies and procedures. It is very applicable to evaluation of strategic and operational level plans for supply chains. It is especially useful for exploring the viability of a supply chain before beginning production. This paper describes the use of simulation for determining the readiness of a supply chain designed by a small company for providing sub-systems to a defense contractor. The supply chain had to be stress tested at surge and mobilization volume levels to meet the requirements. Simulation provided the ideal methodology to identify and demonstrate the behavior of the supply chain under stress and evaluate strategies to meet the defined volumes. It was used to prove the readiness of the supply chain reducing perceived risks in using the virtual operation. 1
• • •
Evaluation of the proposed supply chain configuration for meeting defined demand scenarios including those that highly stress the supply chain. Identification of areas that potentially limit the ability of the supply chain. Development and validation of supply chain configuration enhancements that allow it to meet the requirements. Report to the defense contractor and the involved government agency personnel and satisfy their requirements.
A simulation model of the proposed supply chain was built using the discrete event simulation software, ARENA, from Rockwell Automation. The model was based on data describing the supply chain from the tier II suppliers through the SME to delivery to the defense contractor. Data for each of the manufacturers in the supply chain was collected. This included data on the manufacturing process of the components of the subassemblies and on the logistics processes in-between the manufacturing stages. Simulation modeling has been actively applied in supply chain context as indicated by more than 80 papers reported in a recent survey (Terzi and Cavalieri 2004). In the context of the topic of this paper, there has been limited work in the area of using simulation to evaluate supply chains under stress such as twice to four times increase in volumes. Helo (2000) proposed use of systems dynamics simulation to analyze the impact of surge and includes an experiment with 50% surge in demand. Similarly, there are few reports of supply chain simulation efforts involving SMEs. Byrne and Heavey (2004) point out that supply chain simulation efforts are generally targeted at large corporations, but are needed for SMEs also. A case study for application at a vertically integrated SME is presented. The lack of work on evaluating supply chain behavior under huge increases in volumes is likely due to the fact that commercial industrial supply chains generally do not experience sudden increases in demand of 200-400%.
INTRODUCTION
U.S. manufacturers, particularly the Small and Medium Enterprises (SMEs), continue to face challenges due to the global economy, outsourcing, and consolidation of the manufacturing industry. Improved engineering designs, manufacturing methodologies and information technology are needed to rapidly respond to changes in demand requirements. The SMEs need support to equip themselves and adopt the advances in information technology to address the changing needs of the global economy (Thompson 2005). This paper describes a project that was initiated as a demonstration of how supply chain simulation can reduce an Original Equipment Manufacturer’s (OEM) perceived risk of sourcing from an SME. Simulation was used to determine how the proposed supply chain would be able to meet deliveries under a variety of conditions. The project goals were as follows.
1650
Jain and Leong There are rare cases of 372% year to year demand surge reported in semiconductor industry (Tsai and Wang 2004). The requirement is, however, relevant in defense industry since its participants have to maintain their readiness to meet increased demands in case of wars and conflicts. Indeed, upside production flexibility, that is, the capability of unplanned sustained increase in production to support a two-major-theatre war scenario has been recommended as a key performance indicator for defense industry (Klapper et al 1999). This section introduced the topic and the context of the project and briefly reviewed relevant work. Section 2 describes the scope of the study and the simulation model, followed by the description of the data collection effort in section 3. Section 4 addresses the approach used for development of the simulation model. Section 5 presents the results of simulation experiments for evaluating the performance of the supply chain under normal, surge and mobilization scenarios. The lessons learned from this experience are recounted in section 6 followed by a conclusion of the paper in section 7. 2
• •
The scope of the simulation model required for this project can also be specified using the SCOR model. The SCOR model provides a commonly accepted terminology for description of the supply chain (Supply Chain Council, 2005). The simulation model should include the three stages of the supply chain with PLAN, SOURCE, MAKE and DELIVER activities defined at level 2 of SCOR model. For the fourth stage of the supply chain, that is, the end customer, only the SOURCE activity needs to be included again at level 2 of the SCOR model. Using the SCOR model based specification convention proposed in Jain (2006), the needed simulation model can be classified as (P-2, S-2, M-2, D-2)X3>(S-2). The simulation model included ten nodes of the supply chain spread across the four stages, including 3 tier II suppliers, 5 tier I suppliers, the SME itself, and the defense contractor. The model was used to evaluate the performance of the supply chain under the defense readiness requirements of normal operation, surge (twice the volume of normal operation) and mobilization (four times the volume of normal operation).
SCOPE
The study required a balance between the strategic level goals of supply chain design and the operational level goals for the readiness evaluation requirement. The operation of the supply chain needed to be simulated from tier II suppliers on one end to the end customer at the other end. The level of detail needed to be sufficient to evaluate the capability of the complete supply chain based on its configuration and the operational policies. The configuration includes the node network, the assignment of production to nodes, and the assignment of capacities at each node to meet the production needs. The operational policies include the strategic levels of finished goods and raw material inventories at each node and the associated replenishment policies. Specifically, evaluating the readiness of a supply chain requires simulating the following aspects. • •
Transport of material from suppliers to their immediate customers. Tracking of desired performance measures.
3
DATA COLLECTION
The data gathering effort to meet the above scope was planned jointly with the personnel from the SME. A questionnaire was prepared to request input from all the Tier I and II suppliers. The suppliers were expected to fill in the questionnaires in sufficient level of detail to provide the data needed for simulation. The data requested was intended to satisfy two objectives: 1) simulation and 2) value stream mapping for continuous improvement efforts over a longer time frame. The second objective required more detailed data than the first one given the scope of the simulation study defined above. The data requested from the suppliers included:
Generation of end-customer orders to trigger the pull signal for the supply chain. At each node in the supply chain: − processing of orders from customers immediately downstream of the node, − order fulfillment from finished goods inventory, − generation of production orders if warranted under the stocking policy, − assignment of raw material inventory to the production orders, and − generation of replenishment orders if warranted under raw material inventory policy.
• •
• •
1651
product bill of materials, supply chain network configuration: − nodes, − supplier-customer relationships, and, − transport times between nodes; For end customer node: − ordering pattern; For each manufacturing node: − components produced, − order process times, − manufacturing sequence description times, − manufacturing capacity for each step,
and
Jain and Leong −
•
operational policies: * finished goods stocking policies, * production batching policy, and, * raw material inventory policies.
• •
Only a limited number of responses were received from the suppliers and most of them did not have the sufficient level of detail desired for simulation analysis or the planned value-stream mapping. Given the lack of response, members of the project team visited each supplier site to collect the required data. In addition to discussing the proposed processes to build the desired components, the visits also helped the team understand each supplier’s capabilities, product range, and capacity availability. These supplier site visits added quite a bit of time to the project. The visits had to be set up at mutually convenient times for the suppliers and the project team and hence had to be done over several weeks to months. 4
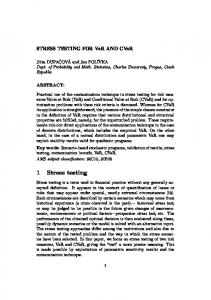
Development of a simulation model requires significant expertise in the modeling process and in coding with the selected software. Development of a generic simulator with basic features requires even more advanced expertise. The generic simulator for this model was developed by project team members with many years of industry and simulation experience. Figure 1 shows a screenshot of the supply chain simulation model. The flow of materials is from left to right on the screen. On the left are the three tier-II suppliers. One of the tier-II suppliers acts as a tier-I supplier also and hence two separate production activities are represented for the node, marked as “Supplier II-1.” Next there are 5 tierI supplier nodes represented. One of the tier-I suppliers, “Supplier I-4,” supplies two distinct groups of subassemblies that are dependent on two separate tier-II suppliers. Again, this is represented using two separate production activity models. The suppliers provide the component and sub-assemblies to the SME for assembly into a completed sub-system unit. The SME ships the units to the defense contractor for assembly into the end product that is supplied to the armed forces.
SIMULATION MODEL DEVELOPMENT
The simulation model was developed to be completely data-driven. This allows the simulation model to be a generic supply chain simulator. While a number of capabilities will have to be developed in the simulator to be truly generic, the intention was to build a basic set of capabilities that can be data driven. A data-driven simulator can be utilized using the following steps. 1.
interface with Microsoft Excel, typically used for storing manufacturing data, model debugging facilities, and representative animation.
5
SIMULATION RESULTS
Analyze the collected data to develop distributions representing the modeled phenomenon. Arrange the data including the developed distributions in a pre-defined format. Read the data describing the supply chain into the simulation model. Configure the simulation model based on the data. Execute the simulation runs.
The simulation scenarios required for readiness evaluation were:
The development of a generic supply chain simulator requires advanced modeling capabilities both on the part of the simulation analyst and the simulation software. The simulator for this study was built using ARENA. As a general rule, any selected simulation software should provide a good graphical user interface to capabilities that include definition of the process to be simulated, simulation clock management, management of entities that go through the process (orders, materials, transportation, etc), provisions for data input, and output data analysis. To support the project goal of building a basic supply chain simulator, any selected simulation software should possess the following features:
Simulation was used to analyze each scenario and determine the ability of the supply chain to meet the desired volume levels.
2. 3. 4. 5.
• •
• • •
Normal operation, with defined volume level, Surge operation, with twice the volume level of normal operation, and, Mobilization operation, with four times the volume level of normal operation.
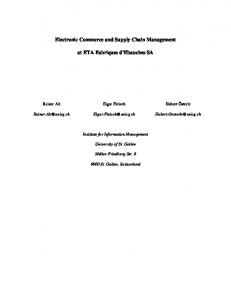
5.1 Normal Operation Key outputs from the simulated performance were tracked to understand the behavior of the supply chain. The bottlenecks in the flow were identified and the associated capacities adjusted in consultation with the suppliers until a smooth flow was achieved. The modified design allowed meeting the normal volumes with no backlog orders at the SME. Figure 2 shows the variation in supply chain inventory for this scenario. The figure shows that the desired performance is achieved with an average investment of $2.33 million across the supply chain. The
constructs allowing data driven models, flexibility in coding the model,
1652
Jain and Leong
Figure 1: Screenshot of the Supply Chain Simulation Model
Dollars in Millions
Normal Operation: Supply Chain Inv ($) $2.80 $2.60
Average: $2.33 Million
$2.40 $2.20 $2.00 0
10
20
30
40 Week
50
60
70
80
Supply Chain Inv ($)
Figure 2: Supply Chain Inventory Variations to Support the Normal Operation Volumes results showed the capability of the proposed supply chain to meet the normal operation volumes.
ventory throughout the supply chain to begin building up to surge level immediately on receiving this notification. The simulation of surge operation was set up to allow the supply chain to function at steady state normal operation before receiving notification of surge volume. After the notification, the supply chain ramps up inventories in response to increased inventory target levels. Once the 13week ramp up period has elapsed, the end customer order volume jump up to the surge level, i.e., twice the normal volume levels.
5.2 Surge Operation Surge operation requires the supply chain to provide double the normal operation volumes. The model assumes that the supply chain has a defined period (assumed to be 13 weeks) to ramp up to the required production level once notification of surge is received. The model allows the in-
1653
Jain and Leong The supply chain configuration was modified to meet the surge volumes. A simple inspection of the design capacity at the SME indicated that it was not sufficient to meet the surge demand rate. The capacity at the SME was increased by 25% to ensure that the production rate matched the demand rate. The SME management confirmed that it was feasible to add the manual assembly workstations needed to add this 25% capacity. The other nodes in the supply chain already had a sufficiently high production rate to meet the surge demand rate. Figure 3 shows the results from the surge operation scenario. With the increase in the SME capacity, the supply chain is able to handle the stress of increased volumes and achieve the goal of no backlog. However, this performance comes at the cost of increased inventory levels as shown in the graph in Figure 3. The graph shows that the total inventories in the supply chain increase from an average of $2.33 Million to an average of $3.62 Million. The simulation thus confirmed the capability of the supply chain to meet the surge operation volumes, with an increase in inventory levels and increased production capacity at the SME.
duction under mobilization. All the other nodes already had a sufficiently high production rate to meet the mobilization demand rate. Figure 4 shows the results from the mobilization operation scenario. The graph in Figure 4(a) shows that with the proposed production modifications and the increased inventory levels through the supply chain, the supply chain is able to sustain the stress of the mobilization volume for a limited period only. It falls behind by a week after 25 weeks of sustaining the mobilization volume, and does not catch back up. This performance comes at the cost of average increased inventory levels of $5.91 million, as shown in the graph in Figure 4(b). 5.4 Mobilization Operation with Modified Configuration Simulation was used to determine the capacities and inventories needed at different nodes to meet the mobilization volumes. Several iterations were made using different levels of capacity and inventories. Simulation results indicated that the supply chain can sustain the mobilization level volumes with a slight increase in capacities at the five nodes that were originally matched to the demand rate. The capacities at these five nodes needed to be increased by another 3% to achieve the required volumes. All manufacturers involved indicated this change could be easily implemented. The slight increase in the capacity enabled the supply chain to recover from occasional inventory shortfalls by producing at a rate slightly higher than the demand rate. The results from simulation of mobilization operation with the modified configuration are shown in Figure 5. The supply chain inventory levels are slightly lower than the base mobilization case, at an average of $5.62 Million.
5.3 Mobilization Operation Mobilization operation requires the supply chain to provide four times the normal operation volumes. Similar to surge operation, once the supply chain receives the notification of mobilization volume, it has an assumed 13-week period to ramp up to that level. Once the 13-week ramp up period has elapsed, the end customer order volume jumps up to the mobilization level, i.e., four times the normal volume levels. The supply chain required significant modification to meet the mobilization volumes. Production capacity was increased at five of the manufacturing nodes, including the SME, so the production rate matched the demand rate. The SME again confirmed the feasibility of adding manual assembly stations to increase their capacity, while the other suppliers indicated their ability to assign more of their commercial product capacity to the required defense pro-
5.5 Conclusions from Simulation Study The study concluded that the proposed supply chain could provide the required volume levels under normal, surge and mobilization scenarios. Simulation iterations were
Dollars in Millions
. Surge Operation: Supply Chain Inv ($) $4.50 $4.00 $3.50
Average after surge: $3.62 Million
$3.00 $2.50 $2.00 0
10
20
30
40
Inventory buildup initiated Week Order volume to 2X
50
60
70 Supply Chain Inv ($)
Figure 3: Supply Chain Inventory Variations to Support the Surge Operation Volumes
1654
80
Jain and Leong made to fine tune the supply chain configuration parameters and operational policies for the normal operation. The identified sets of design parameters and policies form the primary design and operation recommendations for the supply chain. The plans can be quickly executed once the notification for surge or mobilization is received. The SME that serves as the primary interface to the customer should identify manpower and tooling sources that will be rapidly accessed for ramping up the volume. Other identified suppliers should define procedures for diverting commercial capacities to the production of this defense product. The impact on their commercial production plans should be pre-determined and their supply contract should provide a provision for potential delay in commercial production should a defense situation warrant a surge or mobilization scenario.
The study also underlined the value of the simulation for evaluation of performance of proposed supply chains. Any proposed major changes in the supply chain should be evaluated using simulation before implementation. 5.6 Impact on Stakeholders All the stakeholders of this project were very satisfied with the simulation study. The primary customers, the armed forces, and the large defense manufacturers were convinced of the capability of the supply chain to meet their requirements and supported the contract award to the SME. The SME leading the product concept effort found that the simulation helped the customers visualize the supply chain concept much better. Simulation also helped the SME understand the relationships between the major factors in the supply chain design. Based on that understanding and the
Mobilization Operation: Customer Order Backlog at the SME
Units
150 100 50 0 0
10
20
30
40
50
60
Week
70
80
Backlog
Figure 4(a): Backlog at the SME Supplying to the End-customer Under Mobilization Operation Scenario
Dollars in Millions
Mobilization Operation: Supply Chain Inv ($) $7.00 $6.00 $5.00 $4.00 $3.00 $2.00 $1.00 $0.00
Average after mobilization: $5.91 Million
0
10
20
Inventory buildup initiated
30
40
Order volume to 4X
50
60
Week
70
80
Supply Chain Inv ($)
Figure 4(b): Supply Chain Inventory Variations to Support the Mobilization Operation Volumes
Dollars in Millions
Modified Mobilization Operation: Supply Chain Inv ($) $7.00 $6.00 $5.00 $4.00 $3.00 $2.00 $1.00 $0.00
Average after mobilization: $5.62 Million
0
10
20
30
40
Inventory buildup initiated Week Order volume to 4X
50
60
70 Supply Chain Inv ($)
Figure 5: Supply Chain Inventory Variations to Support the Modified Mobilization Operation Volumes 1655
80
Jain and Leong simulation results, the SME is able to assess the potential impact and implement solutions to mitigate risks and reduce costs. 6
The use of simulation techniques helped the SME win the business. The study also highlighted the potential of simulation for continued applications to support the supply chain for operational planning including responding to unplanned events. Lessons were learned that would make the future applications more efficient. These include identified data elements tied to the defined scope of the simulation study, questionnaires and interviewing techniques to help get to the needed information for simulation, organization of data for easy representation and validation, use of a primarily data-driven simulation model, and use of visualization techniques for rapid understanding of the results.
LESSONS LEARNED
The study reaffirmed the following major guidelines for the simulation process: •
•
•
•
•
7
Commit enough resources to gather the required data in a timely fashion. This study took longer than expected primarily due to the extensive effort needed to collect the data. Use the right level of abstraction for the simulation model. Too much detail will unnecessarily bog down the project team in an extensive effort to collect data and build the model. Too little detail results in a model that doesn’t provide the needed answers. Spend data collection effort for critical data elements. Initially build the model with data that is easily available. Exercise the model to understand the impact of the major factors. Spend time improving the accuracy of the data that has a large impact on the outputs. Focus on key outputs. Simulation models can generate multitudes of data. The key performance metrics for the decision should be identified upfront and the model output reports designed to generate those parameters. Verify and validate the model as much as possible. Build internal cross checks for verifying the model code. For example, the supply chain cost calculations were carried out in two different ways and compared to ensure that model was working as designed. For a model of this nature where there is no operating system with which to compare, the model is validated based on expert reviews.
DISCLAIMER The simulation studies presented in this paper were conducted using ARENA as the simulation tool. This does not imply a recommendation or endorsement of the tool by the authors or NIST, nor does it imply that this simulation tool is necessarily the best available for the purpose. REFERENCES Byrne, P.J., and C. Heavey. 2004. Simulation, a framework for analysing SME supply chains. Proceedings of the 2004 Winter Simulation Conference, Eds: R.G. Ingalls, M.D. Rossetti, J.S. Smith, and B.A. Peters. Dec. 5-8, pp. 1167 – 1175. Piscataway, New Jersey: Institute of Electrical and Electronics Engineers. Helo, P.T. 2000. Dynamic Modelling of Surge Effect and Capacity Limitation in Supply Chains. International Journal of Production Research, Vol. 38, No. 17, pp 4521-4533. Jain, S. 2006 (forthcoming). A Comprehensive Framework for Supply Chain Modeling & Simulation, International Journal of Simulation and Process Modeling, Special issue on Supply Chain Modeling, expected publication Fall 2006. Klapper, L.S., N. Hamblin, L. Hutchison, L. Novak, and J. Vivar. 1999. Supply Chain Management: A Recommended Performance Measurement Scorecard, Logistics Management Institute, Report No. LG803R1, Available via http://www.eitoolkit.com/tools /initiation/sc_mgmt_scorecard.pdf [Accessed July 25, 2005]. Supply Chain Council. 2003. Supply-Chain Operations Reference-Model Version 6.0. Supply Chain Council, Inc., Pittsburgh, PA. Terzi, S., and S. Cavalieri. 2004. Simulation in the supply chain context: a survey. Computers in Industry, Vol. 53, pp. 3-16. Thompson, D. 2005. Using Virtual Manufacturing to Improve Supply Chain Effectiveness. Proceedings of the Diminishing Manufacturing Sources and Material
CONCLUSION
The simulation model identified the bottlenecks in each scenario and allowed the team to develop and evaluate strategic changes that will allow the supply chain to meet the requirements. The identified strategic changes through simulation were found to be reasonable enhancements achievable by the supply chain within defined response time parameters. The simulation results thus proved the readiness of the supply chain to meet the defense readiness requirements. The defense contractor gained confidence in the capability of the supply chain to meet their goals. Representatives of the armed services also reviewed the simulation results and they too were convinced of the capabilities of the supply chain.
1656
Jain and Leong Shortages conference, Available via http://www.dmsms2005.utcdayton.com [Accessed on July 21, 2005]. Tsai, T.P. and Faa-Ching Wang. 2004. Improving Supply Chain Management: a model for Collaborative Quality Control. IEEE Conference and Workshop on Advanced Semiconductor Manufacturing (ASMC '04), May 4-6, pp. 36 – 42.
grated manufacturing automation systems for the automotive, aerospace, pharmaceutical, and process industries since 1978. His research interests are in modeling and simulation applications for the manufacturing industries and engineering tools integration program at NIST. Currently, Swee manages the Simulation Standards Consortium at NIST. He is the chairman of the Core Manufacturing Simulation Data Product Development Group at the Simulation Interoperability Standards Organization (SISO). He received his Bachelor and Master Degrees in Industrial Engineering from Purdue University in West Lafayette, Indiana in 1976 and 1978. He is a senior member of the Society of Manufacturing Engineers. His e-mail address is
[email protected].
AUTHOR BIOGRAPHIES SANJAY JAIN is an Assistant Professor in the Department of Management Science, School of Business at the George Washington University (GWU). Prior to joining GWU, he was a research faculty member at Grado Industrial & Systems Engineering Department at Virginia Tech for over three and a half years. Before moving to academia, he accumulated many years of industrial R&D and consulting experience working at Accenture in Reston, VA, USA, Singapore Institute of Manufacturing Technology, Singapore, and General Motors North American Operations Technical Center in Warren, MI, USA. His research interests are in the development and application of decision science techniques to complex systems with current focus on supply chain networks, emergency response project management and the intersection of the two. He received a Bachelors of Engineering from Indian Institute of Technology (IIT)-Roorkee, India in 1982, a Post Graduate Diploma from National Institute for Training in Industrial Engineering, Mumbai, India in 1984, and a Ph.D. in Engineering Science from Rensselaer Polytechnic Institute, Troy, New York in 1988. Sanjay serves as an associate editor of the International Journal of Simulation and Process Modeling and also as a member of the editorial board of International Journal of Industrial Engineering. He is a senior member of the Institute of Industrial Engineers and a member of APICS - The Association for Operations Management. His email address is
[email protected] and his Web address is http://home.gwu.edu/~jain. SWEE LEONG is a senior manufacturing engineer in the Manufacturing Simulation and Modeling Group at the U.S. National Institute of Standards and Technology (NIST) Manufacturing System Integration Division, since 1994. Prior to joining NIST, he was a process engineer at Ford Motor Company responsible for high volume automotive body assembly production, he was a manufacturing systems engineer at John Deere responsible for shop floor management and control applications, and he was an automation project lead at IBM, responsible for the automation of printers and typewriters printed circuit board products. He was also a consultant at IBM Systems Integration Division serving IBM’s global manufacturing customers in different industries. He has extensive experience in the design, development, and implementation of inte-
1657