THE JOURNAL OF BIOLOGICAL CHEMISTRY VOL. 281, NO. 26, pp. 18216 –18226, June 30, 2006 © 2006 by The American Society for Biochemistry and Molecular Biology, Inc. Printed in the U.S.A.
Structural, Biochemical, and Dynamic Characterizations of the hRPB8 Subunit of Human RNA Polymerases*□ S
Received for publication, December 13, 2005, and in revised form, April 19, 2006 Published, JBC Papers in Press, April 21, 2006, DOI 10.1074/jbc.M513241200
Xue Kang‡, Yunfei Hu‡§, You Li‡¶, Xianrong Guo‡¶, Xiaolu Jiang¶, Luhua Lai¶, Bin Xia‡§¶, and Changwen Jin‡§¶1 From the ‡Beijing Nuclear Magnetic Resonance Center, the ¶College of Chemistry and Molecular Engineering, and the §College of Life Sciences, Peking University, Beijing 100871, China The RPB8 subunit is present in all three types of eukaryotic RNA polymerases and is highly conserved during evolution. It is an essential subunit required for the transcription of nuclear genes, but the detailed mechanism including its interactions with different subunits and oligonucleotides remains largely unclear. Herein, we report the three-dimensional structure of human RPB8 (hRPB8) at high resolution determined by NMR spectroscopy. The protein fold comprises an eight-stranded -barrel, six short helices, and a large unstructured ⍀-loop. The overall structure of hRPB8 is similar to that of yRPB8 from Saccharomyces cerevisiae and belongs to the oligonucleotide/oligosaccharide-binding fold. However, several features of the tertiary structures are notably different between the two proteins. In particular, hRPB8 has a more clustered positively charged binding interface with the largest subunit RPB1 of the RNA polymerases. We employed biochemical methods to detect its interactions with different single-stranded DNA sequences. In addition, single-stranded DNA titration experiments were performed to identify the residues involved in nonspecific binding with different DNA sequences. Furthermore, we characterized the millisecond time scale conformational flexibility of hRPB8 upon its binding to single-stranded DNA. The current results demonstrate that hRPB8 interacts with single-stranded DNA nonspecifically and adopts significant conformational changes, and the hRPB8/single-stranded DNA complex is a fast exchanging system. The solution structure in conjunction with the biochemical and dynamic studies reveal new aspects of this subunit in the molecular assembly and the biological function of the human nuclear RNA polymerases.
The three eukaryotic RNA polymerases (RNAPs)2 consist of a number of subunits and play central roles in the transcription of nuclear genes (1–3). Transcription is regulated by protein interactions between the subunits and/or transcription factors during the initiation, elongation, and termination processes. Although extensive studies have been performed in probing the structures and functions of transcription fac-
* This work was supported by National Natural Science Foundation of China Grants 30125009 (to B. X.) and 30325010 (to C. J.) and in part by Grant 2004CB520801 from the National Key Basic Research Program of China. The costs of publication of this article were defrayed in part by the payment of page charges. This article must therefore be hereby marked “advertisement” in accordance with 18 U.S.C. Section 1734 solely to indicate this fact. □ S The on-line version of this article (available at http://www.jbc.org) contains supplemental figures. The atomic coordinates and structure factors (code 2F3I) have been deposited in the Protein Data Bank, Research Collaboratory for Structural Bioinformatics, Rutgers University, New Brunswick, NJ (http://www.rcsb.org/). 1 To whom correspondence should be addressed: Beijing Nuclear Magnetic Resonance Center, Peking University, Beijing 100871, China. Tel.: 86-10-6275-6004; Fax: 86-106275-3790; E-mail:
[email protected]. 2 The abbreviations used are: RNAP, RNA polymerase; OB, oligonucleotide/oligosaccharide-binding; ssDNA, single-stranded DNA; SPR, surface plasmon resonance; HSQC, heteronuclear single quantum coherence; NOE, nuclear Overhauser effect; h, human.
18216 JOURNAL OF BIOLOGICAL CHEMISTRY
tors, limited knowledge is available about the structures and modes of regulation of the RNAPs. In eukaryotic cells, five subunits (RPB5, RPB6, RPB8, RPB10␣, and RPB10) are conserved in all the three RNAPs, which play essential roles for cell viability (4, 5). The structure and function of Saccharomyces cerevisiae RNAP II is the most extensively studied (6 –10). In the case of human RNAPs, only the structures of hRPB6 and hRPB4/hRPB7 subunits have been reported thus far (11, 12). RPB8 (hRPB8 or hRPABC17 in human) is a common subunit in all the three types of eukaryotic RNAPs but is absent in both prokaryotes and archaebacteria (13, 14), suggesting that it represents a unique feature in the eukaryotic transcription machinery. This subunit is highly conserved throughout the evolution and plays an essential role in eukaryotic cells (4, 5, 15). Although little is known about the exact function of the RPB8 subunit in transcription, the fact that RPB8 is one of the small subunits present in all three types of eukaryotic RNAPs suggests that it might be important for common characteristics shared by all RNAPs such as transcriptional efficiency, nuclear localization, enzyme stability, and coordinate regulation of rRNA, mRNA, and tRNA synthesis (4). Homology analysis indicates that hRPB8 shares about 33% sequence identity with the S. cerevisiae homologue yRPB8 (or yRPABC14.5), which structurally belongs to the oligonucleotide/oligosaccharidebinding (OB) fold and was proposed to be involved in single-stranded oligonucleotide binding (13). However, no experimental evidence of the oligonucleotide binding activity has been presented thus far. Previous studies demonstrated that hRPB8 could complement yRPB8 mutant in S. cerevisiae (16, 17), suggesting strong conservations in both structure and function of RPB8 from yeast to human. However, differences still exist between the two homologues because a temperature-sensitive growth defect on the complementation of yRPB8 with hRPB8 was observed (16, 17). To better understand its role in the molecular architecture and biological function of the human RNAPs, the three-dimensional structure of hRPB8 must be known. Herein, we present the solution structure of hRPB8 at high resolution using NMR spectroscopy. In addition, we performed biochemical and NMR titration experiments to characterize its interaction with single-stranded DNA (ssDNA). Moreover, the internal dynamics provided insights into the millisecond time scale conformational fluctuations of this subunit upon its nonspecific binding to ssDNA.
EXPERIMENTAL PROCEDURES Expression and Purification of Recombinant hRPB8—The hRPB8 gene was cloned into pET24a expression vector and expressed in Escherichia coli Rosetta (DE3) strain (Novagen). The culture was grown in LB medium, centrifuged, and resuspended in M9 minimal medium with antibiotics and 15NH4Cl in the presence or absence of 13C6-glucose for preparation of 13C/15N-labeled or 15N-labeled sample, respectively. The hRPB8 protein was purified by ion exchange chromatography (DEAE) ¨ KTA fast proand subsequently gel filtration (Superdex-75) using an A
VOLUME 281 • NUMBER 26 • JUNE 30, 2006
Solution Structure of hRPB8 tein liquid chromatography system (Amersham Biosciences). The purity was determined to be greater than 95% as judged by SDS-PAGE. NMR samples were prepared with 1.0 mM hRPB8 in a buffer containing 20 mm sodium phosphate and 10 mM dithiothreitol (pH 6.2) in 95% H2O, 5% D2O. Gel Shift Analysis—Gel shift experiments using both native PAGE and agarose gel electrophoresis were performed to characterize the interactions of hRPB8 with different ssDNA sequences. The native PAGE was performed at a constant electronic current of 8 mA at 4 °C. The concentration of hRPB8 was 0.3 M, and that of ssDNA varied from 0.06 to 0.6 M. The gel was stained with Coomassie Brilliant Blue. The DNA electrophoresis using agarose gel was performed at 25 °C. The ssDNA fragments were kept at a constant concentration of 0.01 M, and that of hRPB8 varied from 0.005 to 0.05 M. The gel was stained with ethidium bromide. The ssDNA sequences used in the experiment were 5⬘-CCGATATTGATTTTTCG-3⬘ and 5⬘-CTGGTGTCTCG-3⬘. Surface Plasmon Resonance—Surface plasmon resonance (SPR) experiments were performed using the BIAcore 3000 system (Biacore AB) to detect the interactions between hRPB8 and ssDNA and to determine the thermodynamic constants. Recombinant hRPB8 was diluted in a buffer containing 10 mM sodium acetate (pH 3.5) and immobilized onto a BIAcore sensor chip CM5 as recommended by the manufacturer. The final active hRPB8 concentration was determined to be 0.5 M. The ssDNA sequence of 5⬘-CCGATATTGATTTTTCG-3⬘ with various concentrations (0.1, 0.15, 0.3, 0.45, 0.6, 0.65, 0.75, 0.8, 0.85, 1.0, and 1.3 mM) and that of 5⬘-TAATGTTAGAAAAGCGT-3⬘ with different concentrations (0.083, 0.17, 0.33, 0.50, 0.67, 0.83, 1.0, and 1.3 mM) were dissolved in the elution buffer containing 20 mM sodium phosphate (pH 6.2) for binding analysis by SPR. These ssDNA sequences were used for different projects in this laboratory and were randomly selected for the experiment. The measurements were performed at 25 °C, with a flow rate of 30 l/min. The apparent equilibrium dissociation constant KD was determined by curve fitting of the steady state binding level as a function of the ssDNA concentration using Equation 1,
R eq ⫽ C 䡠 Rmax/共KD ⫹ C 䡠 n兲
(Eq. 1)
where Req is the steady state binding level, Rmax is the theoretical binding capacity, C is the concentration of ssDNA, and n specifies the number of averaged binding sites on one analyte molecule (18). All of the data were fitted with a nonlinear least square method using BIAevaluation 4.0 software following the manufacturer’s instructions. The fitting was tested by using different values of n and examined by F tests. NMR Spectroscopy—The NMR experiments were carried out at 30 °C on Bruker Avance 500- and 800-MHz spectrometers equipped with four RF channels and triple-resonance probes with pulsed field gradients. The chemical shifts were referenced to internal 2,2-dimethyl-2-silapentanesulfonic acid. Two-dimensional 15N- and 13C-edited heteronuclear single quantum coherence (HSQC) and three-dimensional HNCA, HNCO, HNCACB, HBHA(CO)NH, CBCA(CO)NH, (H)CC(CO)NHTOCSY, (H)CCH-COSY, and 15N-edited TOCSY-HSQC (mixing time, 80 ms) experiments were performed to obtain the backbone and side chain assignments (19–23). The three-dimensional 15N- and 13C-edited NOEHSQC spectra (mixing times, 50 and 100 ms) were collected to confirm the assignments and generate distance restraints for structure calculations. The three-dimensional HNHA experiment was recorded to obtain the dihedral angle restraints (24). A series of hydrogen-deuterium exchange experiments were collected to obtain hydrogen bonding information. All NMR spectra were processed using the program NMRPipe (25) and analyzed using the program NMRView (26).
JUNE 30, 2006 • VOLUME 281 • NUMBER 26
Structure Calculations—The structure calculations were performed using the program package CYANA (27) and refined by AMBER (28). Distance restraints were derived from the inter-proton NOE. Dihedral angles ( and ) were determined from backbone chemical shifts using TALOS (29), and angles were confirmed by the HNHA experiment (24). Hydrogen bond restraints were obtained from the hydrogen-deuterium exchange experiments and intermediate range NOEs in combination with the secondary structural information. Two hundred structures were calculated by CYANA, and the 100 lowest energy structures were used as initial structures and refined using AMBER. Finally, the 20 lowest energy structures were selected to represent the hRPB8 subunit. The final structures were analyzed using the program packages MOLMOL (30) and PROCHECK_NMR (31). ssDNA Titration Experiments—The ssDNA titration experiments were performed and monitored by a series of two-dimensional 15Nedited HSQC experiments. The spectra were collected on a Bruker Avance 800 MHz NMR spectrometer at 30 °C. The hRPB8 sample for structure determinations was used, and the ssDNA sequences used in the titration experiments were 5⬘-CCGATATTGATTTTTCG-3⬘ and 5⬘-TAATGTTAGAAAAGCGT-3⬘, respectively. The molar ratio of ssDNA to hRPB8 protein ranged from 0.2 to 3.0. Measurements of Conformational Exchanges—The transverse relaxation-optimized spectroscopy based relaxation compensated CarrPurcell-Meiboom-Gill pulse sequence was used to characterize the conformational exchanges on the millisecond time scale (32, 33). The measurements were performed on a Bruker Avance 800 MHz NMR spectrometer at 30 °C. Spectral widths of 8802.8 Hz for 1H and 1986.8 Hz for 15N were used. The experiments were performed by measuring the peak intensities with the relaxation delay of 40 ms using different cp values of 1 and 10 ms, where cp is the delay between 15N 180° pulses in the Carr-Purcell-Meiboom-Gill pulse train. Theoretically, the peak intensities are independent of the cp values if there is no chemical or conformational exchange involved (33). In case the residue is involved in conformational exchange on the observed time scale (0.5–5 ms in the current study), the peak intensities decrease with increasing cp values because of the shortened transverse relaxation time constant. Therefore, the conformational exchanges were determined by comparing the peak intensities at different cp values. Forty-eight transients were collected for each experiment. For each cp value, the measurements were repeated three times to estimate the experimental uncertainties and confirm the extracted conformational exchanges. The Rex value reflecting the conformational exchanges is defined by Rex ⫽ (I1ms ⫺ I10ms)/I1ms, where I1ms and I10ms are the averaged peak intensities when cp equals 1 and 10 ms.
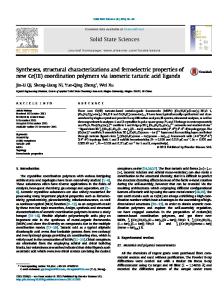
RESULTS AND DISCUSSION Biochemical Characterizations of the hRPB8 Subunit—The nonspecific DNA binding is an important feature of RNAPs and plays essential roles during the basal transcription processes. We performed the SPR measurements to probe the interactions between hRPB8 and ssDNA sequences and further determine the thermodynamic constants. As shown in Fig. 1, the results clearly indicate that hRPB8 interacts with the two ssDNA sequences in a similar manner, demonstrating the nonspecific binding. In addition, the sensorgrams (Fig. 1, A and C) suggest that the interaction between hRPB8 and ssDNA involves fast association and dissociation. The SPR data were fitted using models with different values of n (see “Experimental Procedures”). The F test results strongly favored n ⫽ 1 and suggested that hRPB8 binds with ssDNA by the molar ratio of 1:1. Subsequently, the apparent equilibrium dissociation constant KD values extracted from the SPR analysis (Fig. 1, B and D) were
JOURNAL OF BIOLOGICAL CHEMISTRY
18217
Solution Structure of hRPB8
FIGURE 1. SPR analysis of the interaction between hRPB8 and ssDNA. A and C show the sensorgrams for the reactions between hRPB8 and different ssDNA sequences. Recombinant hRPB8 (0.5 M) was immobilized onto a BIAcore chip. During the SPR analysis, the ssDNA sequences of 5⬘-CCGATATTGATTTTTCG-3⬘ (A) and 5⬘-TAATGTTAGAAAAGCGT-3⬘ (C ) with concentrations (0.10, 0.15, 0.30, 0.45, 0.60, 0.65, 0.75, 0.80, 0.85, 1.0, and 1.3 mM) and (0.083, 0.17, 0.33, 0.50, 0.67, 0.83, 1.0, and 1.3 mM) were used, respectively. The ssDNAs were dissolved in the elution buffer containing 20 mM sodium phosphate (pH 6.2) for the binding reaction. The experiments were performed at 25 °C with a flow rate of 30 l/min. The curve fittings of the steady state responses of A and C as a function of the ssDNA concentrations by assuming 1:1 binding are shown in B and D, respectively. The apparent equilibrium dissociation constants KD were estimated to be ⬃0.7 ⫾ 0.1 and 1.2 ⫾ 0.1 mM for the two ssDNA sequences, respectively.
⬃0.7 ⫾ 0.1 and 1.2 ⫾ 0.1 mM for the two ssDNA sequences, respectively. The binding of hRPB8 with different ssDNA sequences and lengths was also analyzed by gel shift assays using both native PAGE and agarose gel electrophoresis. Fig. 2 (A and B) show the native PAGE analysis of hRPB8/ssDNA interaction. The protein concentration was fixed, whereas the DNA concentration varied. The formation of the hRPB8䡠ssDNA complex gradually increased with the increase of the DNA concentration. Fig. 2 (C and D) show the agarose gel analysis of hRPB8/ssDNA interaction. The DNA concentration remained constant, whereas the protein concentration was changed. The results were similar to the protein electrophoresis using native PAGE. Different lengths and sequences of ssDNA were used, and the results clearly indicated that hRPB8 binds ssDNA in a sequence-independent manner. In addition, the gel electrophoresis demonstrated that upon hRPB8 binding to ssDNA, only a single form of complex was formed. Therefore, the SPR analysis and gel shift assays strongly indicate the nonspecific binding of hRPB8 with ssDNA sequences. This result is also
18218 JOURNAL OF BIOLOGICAL CHEMISTRY
supported by the ssDNA titration experiments probed by NMR spectroscopy (see below). Solution Structure of the hRPB8 Subunit—By using the triple-resonance NMR spectra described above, more than 90% of the chemical shift assignments for backbone and side chain atoms of hRPB8 were obtained, with the exception of residues Leu5, Leu6, Val43, Asn44, Val50, Leu52, Gly53, Ala61, Val91, Met92, Tyr118, Gly120, and Leu121. A table containing the chemical shift assignments of 1H, 13C, and 15N atoms has been deposited in the BioMagResBank data base under accession number 7020. The two-dimensional 15N-edited HSQC spectrum showing the 1H and 15N resonance assignments of hRPB8 is shown in Fig. 3. The hRPB8 structure has been determined using the inter-proton NOE-derived distance restraints in combination with the dihedral angle and hydrogen bond restraints. The 20 superimposed representative structures, together with the ribbon diagram of the energy-minimized mean structure of hRPB8, are shown in Fig. 4. The structural statistics for hRPB8 are summarized in Table 1. The hRPB8 protein comprises an eight-stranded -barrel with a shear number of nine -strands (1, 6 –17; 2, 25–32; 3, 38 – 44; 4,
VOLUME 281 • NUMBER 26 • JUNE 30, 2006
Solution Structure of hRPB8
FIGURE 2. Gel shift assays of the nonspecific binding of the hRPB8 subunit with ssDNA. A and B, native gel shift analysis of the interactions between hRPB8 and different ssDNA sequences. The experiments were performed at a constant electronic current of 8 mA at 4 °C. The hRPB8 was kept at a constant concentration of 0.3 M. Lane 1 shows hPRB8 without ssDNA. For lanes 2–7, the concentrations of ssDNA are 0.06, 0.15, 0.25, 0.3, 0.45, and 0.6 M, respectively. The ssDNA sequences used in the experiment were 5⬘-CCGATATTGATTTTTCG-3⬘ (A) and 5⬘-CTGGTGTCTCG-3⬘ (B), respectively. C and D, DNA electrophoresis shows the binding of hRPB8 to ssDNA. The experiments were performed using the same ssDNA sequences as in A and B at 25 °C. The two ssDNA fragments were kept at a constant concentration of 0.01 M. Lane 1 shows ssDNA without hRPB8. For lanes 2–7, the concentrations of hRPB8 are 0.005, 0.007, 0.01, 0.013, 0.02, and 0.05 M, respectively.
FIGURE 3. Two-dimensional 15N-edited HSQC spectrum of the uniformly 15N-labeled hRPB8. The sample was dissolved in a buffer containing 20 mM sodium phosphate and 10 mm dithiothreitol (pH 6.2) in 95% H2O/5% D2O. The spectrum was collected on a Bruker Avance 800 MHz spectrometer at 30 °C. The assignments are annotated by the resonance peaks with the one-letter amino acid code and the sequence number.
56 – 61; 5, 90 –92; 6, 94 –97 7, 112–118; 8, 121–127; and 9, 143–147) and six 310 helical regions (H1, 20 –23; H2, 45– 48; H3, 64 – 66; H4, 99 –102; H5, 129 –132; and H6, 137–140). As shown in Fig. 4 (A–D), the core of hRPB8 adopts a compact OB fold structure consisting of an eight-stranded anti-parallel -barrel surrounded by six short helices. In addition, hRPB8 contains a large unstructured flexible region (⍀-loop) with 23 residues (residue 67– 89), which was
JUNE 30, 2006 • VOLUME 281 • NUMBER 26
proposed to be dispensable in the previous studies (34). The overall backbone root mean square deviation from the mean structure is 2.60 ⫾ 0.41 Å, and that of the regular secondary structural elements is 0.62 ⫾ 0.15 Å after excluding the residues at the C terminus and those in the large unstructured ⍀-loop. The residues in regions 16 –25, 60 – 88, 100 –110, 132–136 and those near the C terminus showed a certain degree of motional flexibility, which was reflected
JOURNAL OF BIOLOGICAL CHEMISTRY
18219
Solution Structure of hRPB8
FIGURE 4. Solution structure of the hRPB8 subunit and its comparison with yRPB8. The superimposition of 20 representative structures with the lowest energy of hRPB8 are shown in A and B, and the orientations are with a 90° rotation. The ribbon diagrams of the mean structure of hRPB8 are shown in C and D with the secondary structural elements labeled. The orientations of C and D are related by a 90° rotation. The figures were generated using MOLMOL (30). E and F show the overlay of C␣ trace of hRPB8 (blue) with that of yRPB8 (red, Protein Data Bank entry 1A1D). The unstructured ⍀-loop is not displayed in F for clarity.
by the fewer NOE-derived distance restraints and bigger root mean square deviation values than that of the well structured regions. This fact was further demonstrated by the low {1H}-15N heteronuclear
18220 JOURNAL OF BIOLOGICAL CHEMISTRY
NOEs (supplemental material). Such a structural feature of the hRPB8 subunit suggests that the unstructured loops adopt significant conformational exchanges.
VOLUME 281 • NUMBER 26 • JUNE 30, 2006
Solution Structure of hRPB8 TABLE 1 Structural statistics of hRPB8 Distance restraints Intraresidue unambiguous NOEs Sequential unambiguous NOEs Medium range unambiguous NOEs Long range unambiguous NOEs Total unambiguous NOEs Total ambiguous NOEs Dihedral angles ( and ) Hydrogen bonds S-S bond
883 589 180 369 2021 867 89 42 0
Root mean square deviation from mean structure Secondary structure backbone atoms Secondary structure heavy atoms All backbone atoms All heavy atoms
0.62 ⫾ 0.15 1.23 ⫾ 0.21 2.60 ⫾ 0.41 2.99 ⫾ 0.43
Energy (kcal/mol) Mean AMBER energy NOE distance restraint violation energy Torsion angle restraint violation energy
⫺8116.43 ⫾ 8.24 22.33 ⫾ 1.03 2.56 ⫾ 0.22
Restraint violations Distance (⬎0.3 Å) Dihedral angle (⬎5°)
1 7
Ramachandran statistics Residues in most favored regions (%) Residues in additional allowed regions (%) Residues in generously allowed regions (%) Residues in disallowed regions (%)
75.6 21.8 1.8 0.8
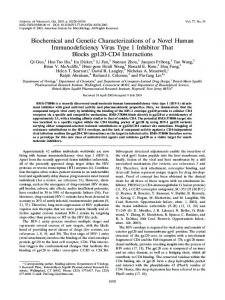
Notably, all 11 aromatic side chains are on the solvent exposed surface. Moreover, the basic and hydrophobic residues are mostly highly conserved on the proposed oligonucleotide-binding surface within the RPB8 sequences (Fig. 5A). Structural Comparison with yRPB8—An overlay of the C␣ trace of hRPB8 with that of yRPB8 (Protein Data Bank entry 1A1D) is shown in Fig. 4 (E and F). The root mean square deviation between the solution structures of hRPB8 and yRPB8 is 1.76 Å for 51 pairs of C␣ atoms determined using DALI (35) in the secondary structural elements. Overall, both proteins share a similar OB fold. However, certain features of the tertiary structures are notably different between the two proteins. A comparison of the electrostatic potential of the putative oligonucleotide-binding surface of hRPB8 and yRPB8 (Fig. 5, B and E) shows that hRPB8 has a more positively charged surface than that of yRPB8, and the positive charges are more clustered on strands 7 and 8. Based on the crystal structure of yeast RNAP II complex (Protein Data Bank entry 1WCM), the interaction surface of RPB8 with the largest subunit RPB1 can be identified to include helix H2, part of the ⍀-loop and -strands 5– 8 (as numbered in our structure). The different charge distributions on 7 and 8 of these two homologues may be adapted to the structural and charge differences of their binding partners, hRPB1 and yRPB1. In addition, the conserved GGLLM motif shared by RPB8 subunits was identified as the core-binding surface with the relatively conserved PXIXKPXXLWXGKQ motif in RPB1 (6, 7, 14). A comparison of the electrostatic potential near the GGLLM motif indicates that this region is less negatively charged and more hydrophobic in hRPB8 than that of yRPB8 (Fig. 5, C and F). As a result, hRPB8 may have different binding affinity when interacting with yRPB1, which might account for the observation of temperature-sensitive growth defect on the functional complementation of yRPB8 mutant by hRPB8 (16, 17). Based on the crystal structure of yRPB1 (Protein Data Bank entry 1WCM), we modeled the structure of the hRPB1 domain that interacts with hRPB8 using the software package three-dimensional JIGSAW (36). The modeled structure and the yRPB1 domain containing the yRPB8-binding surface (37) are shown in Fig. 5 (D and G), respectively.
JUNE 30, 2006 • VOLUME 281 • NUMBER 26
It indicates that most of the residues located in the binding motif of PXIXKPXXLWXGKQ in both hRPB8 and yRPB8 are aromatic and hydrophobic, and the distributions of the electrostatic potential in this region are quite similar. However, the charge distributions in the lower left part that forms a cavity are a bit different between the two structures (Fig. 5, D and G). The hRPB1 has a patch of positively charged residues lining the bottom of the cavity, whereas the same region in yRPB8 is negatively charged. This cavity is spatially close to strands 7 and 8 of the RPB8 subunit based on the crystal structure of yRPB1 (Protein Data Bank entry 1WCM). Because strands 7 and 8 in hRPB8 are more negatively charged, hRPB8 may bind to hRPB1 with higher affinity than yRPB1. However, ultimate conclusions can only be made with knowledge of the experimentally determined structure of hRPB1 and additional biochemical experiments. Site-specific Characterizations of the Nonspecific Binding of hRPB8 with ssDNA—To characterize the nonspecific DNA binding properties of the hRPB8 subunit at the atomic level, ssDNA titration experiments were performed and monitored by a series of two-dimensional 15Nedited HSQC spectra. An overlay of the HSQC spectra collected in the absence and presence of different concentrations of ssDNA is shown in Fig. 6A. The hRPB8 protein showed identical HSQC spectra at the same DNA/protein ratios when two different ssDNA sequences were used in the titration experiments. This observation demonstrates that the conformational change of hRPB8 is independent of the DNA sequence, which further confirms that the binding is nonspecific. In addition, the HSQC spectra of hRPB8 in the presence of different concentrations of ssDNA were overall similar to that of the free hPRB8 except a few cross-peaks exhibiting significant chemical shift changes during the titration experiments. This observation strongly suggests the structural similarity between the free hPRB8 and the hPRB8䡠ssDNA complex. Fig. 6B shows the composite chemical shift changes of hPRB8 amides (1H and 15N) upon binding to ssDNA. We performed a series of tripleresonance NMR experiments to assign the backbone chemical shifts of hRPB8 in the hRPB8䡠ssDNA complex. The largest chemical shift changes were observed at the region containing residues Asp14, Asp16, Glu18, His29, Cys30, and Leu39. Notably, these residues are spatially located at or close to the predicted single-stranded oligonucleotidebinding sites based on its OB fold structure (Fig. 6C). In addition, residues Lys20, Lys21, Phe22, Glu31, Glu33, Ser34, and Asp38 were missing in the NMR spectra of the hRPB8䡠ssDNA complex. Most of these missing residues are located near the putative single-stranded oligonucleotidebinding region (strands 2 and 3) except those (Ser105–Ala109 and Gly119) in the loop region of the hRPB8 structure (Fig. 6C). It is well documented that for the OB fold proteins, the exposed basic, aromatic and hydrophobic residues located on the -strands and loop regions bind single-stranded oligonucleotides through various interactions, such as stacking interactions with aromatic amino acid side chains, packing interactions with hydrophobic side chains or the aliphatic portions of more polar amino acids such as lysine and arginine, as well as hydrogen bonds between basic amino acids and DNA phosphates (34, 39). Among the residues that were perturbed upon binding to ssDNA, residues Asp16, Lys21, Phe22, Ser34, and Leu39 are highly conserved during evolution and may make major contributions to oligonucleotide interaction. Notably, during the titration experiments, only a single set of crosspeaks were observed in each of the two-dimensional 15N-edited HSQC spectra at each ssDNA concentration, especially when the ssDNA concentrations were lower than that of hRPB8. Moreover, each HSQC spectrum was different from that of the free hRPB8, indicating that only a single conformation of the hRPB8䡠ssDNA complex could be de-
JOURNAL OF BIOLOGICAL CHEMISTRY
18221
Solution Structure of hRPB8
FIGURE 5. Secondary structure alignment and structural comparisons. A, the secondary structure alignment of hRPB8 with its homologues. The conserved residues are highlighted in boxes. The protein sequences were obtained from GenBankTM. The alignment was performed with the program Clustal W (47) and generated using ESPript (48). B and E represent the electrostatic potential for the ssDNA binding surfaces of hRPB8 and yRPB8, respectively. The orientation of C and F are related to B and E by a 90° rotation, respectively. The coordinates of yRPB8 were obtained from the crystal structure of yeast RNA polymerase II (Protein Data Bank entry 1WCM). The surface exposed basic and hydrophobic residues are annotated with the one-letter amino acid code and the residue number in B and E, and the conserved residues GGLLM are indicated in C and F. D and G represent the RPB8-binding domains of yRPB1 and hRPB1 showing the binding surface, respectively. The yRPB1 domain containing residues 516 – 639 is shown in D, and that of hRPB8 (residues 530 – 669) modeled using the program three-dimensional JIGSAW (37) is shown in G. Highly conserved residues in the PXIXKPXXLWXGKQ motif at the binding surface are indicated. The figures were generated using MOLMOL (30).
18222 JOURNAL OF BIOLOGICAL CHEMISTRY
VOLUME 281 • NUMBER 26 • JUNE 30, 2006
Solution Structure of hRPB8
FIGURE 6. The interactions of the hRPB8 subunit with ssDNA. A, an overlay of the 15N-edited HSQC spectra in the absence (black) and presence of ssDNA at different concentrations. For clarity, only the spectra at two ssDNA concentrations are shown in red and blue, corresponding to the molar ratios of ssDNA:protein of 0.5:1.0 and 2.0:1.0, respectively. The spectra showing an overlay of the 15N-edited HSQC spectra in the absence (black) and presence of ssDNA at all concentrations in the titration experiments are given in supplemental material. The cross-peaks showing greater than the average value of chemical shift changes are annotated with the one-letter amino acid code and the residue number. B, the composite 1H and 15N chemical shift changes versus the amino acid sequence. The composite chemical shift changes were calculated using the empirical equation ‚␦comp ⫽ 公‚␦H2 ⫹ (0.17 ⫻ ‚␦N)2 where ‚␦H and ‚␦N are the chemical shift changes of 1H and 15N, respectively (38). C, mapping of the composite 1H and 15N chemical shift changes on the solution structure of hRPB8.
tected by NMR spectroscopy. This observation demonstrates that the hRPB8䡠ssDNA complex is a fast and dynamic exchanging system with the fast association and dissociation of ssDNA. Therefore, when the concentration of ssDNA was lower than that of protein, the observed cross-peaks were averaged from both the free hRPB8 and the hRPB8䡠ssDNA complex. This conclusion is supported by the fact that with the increase of the concentration of ssDNA, the cross-peaks moved toward a stationary position where the protein was saturated by ssDNA (Figs. 6A and 7, A–D). Based on the results from NMR titration experiments (Fig. 7), we extracted the dissociation constant KD between hRPB8 and ssDNA
JUNE 30, 2006 • VOLUME 281 • NUMBER 26
using the chemical shift changes of seven representative residues Ile9, Phe10, Asp14, Gly19, Cys30, Ile40, and Gly127 (40, 41). The apparent KD is ⬃0.1 mM, obtained by averaging over the individual KD values from the seven residues. As shown in Fig. 7E, the dissociation constant KD values obtained from different residues are in good agreement with each other. Furthermore, the thermodynamic constant determined by NMR titration experiments is in general agreement with that by the SPR measurements. Conformational Flexibility in the Single-stranded Oligonucleotidebinding Region of hRPB8—It is well understood that proteins adopt conformational exchanges while performing their biological functions
JOURNAL OF BIOLOGICAL CHEMISTRY
18223
Solution Structure of hRPB8
FIGURE 7. Determination of the thermodynamic constant by NMR titration experiments. The chemical shift changes of residues Ile9, Cys30, Phe10, and Gly127 of hRPB8 upon binding with different molar ratios of ssDNA to hRPB8 (0.0, 0.4, 0.8, 1.0, 1.2, and 1.6). The colors used to represent the ssDNA/hRPB8 ratios are indicated in the figure. The 1H, 15N, and the composite chemical shift change (38) for each residue is shown on the right sides of A–D. E, the apparent dissociation constants KD corresponding to residues Ile9, Phe10, Asp14, Gly19, Cys30, Ile40, and Gly127, were determined by fitting the chemical shift change of each residue as described (40, 41). The determined KD values are 0.12 ⫾ 0.09 mM (Ile9), 0.14 ⫾ 0.05 mM (Phe10), 0.14 ⫾ 0.01 mM (Asp14), 0.14 ⫾ 0.04 mM (Gly19), 0.04 ⫾ 0.02 mM (Gly27), 0.08 ⫾ 0.03 mM (Cys30), and 0.06 ⫾ 0.02 mM (Ile40).
18224 JOURNAL OF BIOLOGICAL CHEMISTRY
VOLUME 281 • NUMBER 26 • JUNE 30, 2006
Solution Structure of hRPB8
FIGURE 8. The millisecond time scale conformational exchanges of the hRPB8 subunit. A, the experimentally determined conformational exchanges (Rex, normalized values) versus the amino acid sequence for the free hRPB8 are shown in black, and that of the hRPB8䡠ssDNA complex are shown in red. The spectra for determining the conformational exchanges (Rex) were recorded on a Bruker Avance 800 MHz spectrometer at 30 °C. The secondary structural elements are shown at the top. B–D, mapping of the conformational exchanges (Rex) onto the ribbon structure of hRPB8 for the free hRPB8 (B), hRPB8 binds with ssDNA with a ratio of 1.0:0.5 (C ), and hRPB8 binds with ssDNA with a ratio of 1.0:1.5 (D). The residues showing conformational exchanges (Rex) on the millisecond time scale are represented with pink balls, and the missing residues are represented using gray balls.
(42). Understanding of these conformational fluctuations on various time scales is essential for understanding the biological processes in many cases. The conformational flexibility on the millisecond time scale plays especially important roles in many biological processes such as enzyme catalysis and protein-protein and protein-ligand interactions (43, 44). The NMR relaxation dispersion experiment is proven a well established tool for probing the conformational dynamics from picosecond to millisecond or even slower time scales at the atomic level (45). Nevertheless, only a little information is available on the conformational changes of proteins during their recognition and interaction with the partner molecules thus far. The hRPB8 subunit contributes to the positively charged groove on the back side of RNAP II and was proposed to involve in one of the two possible exit paths for nascent RNA by interacting with the singlestranded nucleic acids (15). The conformational dynamics may play a role in this process. Consequently, it is of biological importance to characterize the internal dynamics of hRPB8 during its recognition of singlestranded nucleic acids, especially the millisecond time scale conformational exchanges.
JUNE 30, 2006 • VOLUME 281 • NUMBER 26
The conformational exchanges of hRPB8 in the absence and presence of different ssDNA concentrations were measured, and the results are shown in Fig. 8. In the absence of ssDNA, residues Lys13, Asp14, Ile15, Gly19, Lys20, Lys21, His29, Cys30, Ser32, Phe35, Leu39, Ile40, Glu100, Thr104, Ala109, Arg111, and Gly127 of hRPB8 showed conformational exchanges (Rex) on the millisecond time scale. A mapping of the residues showing conformational exchanges onto the solution structure of hRPB8 indicates that these residues are located near the predicted single-stranded oligonucleotides binding region. Upon binding to ssDNA with a molar ratio to protein of 0.5:1.0, only residues Thr104, Ala109, Arg111, and Gly127 showed conformational exchanges on the millisecond time scale. In the presence of excess ssDNA (ssDNA/hRPB8 ⬃ 1.5: 1.0), no residues showing conformational exchanges around the binding site were observed. In addition, after binding to ssDNA, most residues in the first helix (H1) were missing except residue Glu19. This fact suggests that intermediate conformational exchanges are involved that resulted in the broadening of NMR signals being undetectable. The intermediate conformational exchanges are mainly due to the dynamic contacts between the hRPB8 and ssDNA.
JOURNAL OF BIOLOGICAL CHEMISTRY
18225
Solution Structure of hRPB8 The aforementioned results demonstrate that the millisecond conformational flexibility around the binding region of hRPB8 is significantly reduced upon its binding with ssDNA. The observed redistribution of conformational exchange after DNA binding is in good agreement with previous dynamic studies of DNA- or RNA-binding proteins (44). To obtain further insights into the motional properties, the heteronuclear {1H}-15N steady state NOEs for the free hRPB8 and the hRPB8䡠ssDNA complex were determined (supplemental material). Notably, upon binding with ssDNA, residues in several regions of the hRPB8䡠ssDNA complex, such as residues in helix H2, in the ⍀-loop or in the loops connecting H4-7 and 7-8, still showed lower than average NOE values. Because helix H2, part of the ⍀-loop, and -strands 5– 8 form the binding interface with subunit RPB1 based on the crystal structure of yeast RNAP II complex (Protein Data Bank entry 1WCM), we propose that the motional flexibility near these regions may be required for the interactions of hRPB8 with hRPB1 or probably with other subunits of the RNAPs or other proteins such as transcription factors. However, further evidence is required to demonstrate this hypothesis. Taken together, the conformational dynamics in combination with the titration experiments clearly indicate that the hRPB8䡠ssDNA complex is a fast exchanging system, along with intermediate conformational exchanges of hRPB8. Functional Implications—The solution structure of the hRPB8 subunit in conjunction with the biochemical and dynamic results provide important insights in understanding its biological function in the eukaryotic basal transcriptional machineries (8, 9). Residues around the single-stranded oligonucleotide-binding region of the free hRPB8 showed significantly different conformational flexibility before and after binding to ssDNA. In contrast, residues in several regions still showed strong internal motions on the picosecond to nanosecond time scales after binding with ssDNA, implying that these residues may be responsible for the interactions with other subunits in the assembled architecture of RNAPs and with other proteins like the transcription factors. Previous studies demonstrated that hRPB8 interacts in vivo with the biggest subunit hRPB1 and other subunits such as hRPB2, hRPB3, and hRPB5 of RNAP II (46). The changes of motional flexibility could be expected upon the interactions of hRPB8 with these subunits and other molecules. Further investigations are expected to address these issues. Concluding Remarks—We have determined the solution structure of the conserved hRPB8 subunit of human RNA polymerases at high resolution. The structural and biochemical studies in conjunction with the internal dynamics of the free protein and its ssDNA complex of the hRPB8 subunit clearly demonstrate that hRPB8 nonspecifically binds with ssDNA. The changes of conformational dynamics of hRPB8 on the millisecond time scale are strongly coupled to its interactions with single-stranded oligonucleotides. Therefore, the current studies reveal new aspects of the roles of this subunit in the molecular architecture of RNAPs and biological functions during transcription in eukaryotes. Acknowledgments—All NMR experiments were carried out at the Beijing Nuclear Magnetic Resonance Center, Peking University. We thank Dr. Mingjie Zhang (Hong Kong University of Science and Technology) for helpful suggestions. REFERENCES 1. Reeder, R. H. (1999) Prog. Nucleic Acids Res. Mol. Biol. 62, 293–327 2. Sims, R. J., III, Mandal, S. S., and Reinberg, D. (2004) Curr. Opin. Cell Biol. 16,
18226 JOURNAL OF BIOLOGICAL CHEMISTRY
263–271 3. Huang, Y., and Maraia, R. J. (2001) Nucleic Acids Res. 29, 2675–2690 4. Woychik, N. A., Liao, S.-M., Kolodziej, P. A., and Young, R. A. (1990) Genes Dev. 4, 313–323 5. Archambault, J., and Friesen, J. D. (1993) Microbiol. Rev. 57, 703–724 6. Cramer, P., Bushnell, D. A., Fu, J., Gnatt, A. L., Maier-Davis, B., Thompson, N. E., Burgess, R. R., Edwards, A. M., David, P. R., and Kornberg, R. D. (2000) Science 288, 640 – 649 7. Cramer, P., Bushnell, D. A., and Kornberg, R. D. (2001) Science 292, 1863–1876 8. Cramer, P. (2004) Curr. Opin. Genet. Dev. 14, 218 –226 9. Armache, K-J., Mitterweger, S., Meinhart, A., and Cramer, P. (2005) J. Biol. Chem. 280, 7131–7134 10. Woychik, N. A., and Hampsey, M. (2002) Cell 108, 453– 463 11. del Rio-Portilla, F., Gaskell, A., Gilbert, D., Ladias, J. A., and Wagner, G. (1999) Nat. Struct. Biol. 6, 1039 –1042 12. Meka, H., Werner, F., Cordell, S. C., Onesti, S., and Brick, P. (2005) Nucleic Acids Res. 33, 6435– 6444 13. Krapp, S., Kelly, G., Reischl, J., Weinzierl, R. O., and Matthews, S. (1998) Nat. Struct. Biol. 5, 110 –114 14. Briand, J. F., Navarro, F., Rematier, P., Boschiero, C., Labarre, S., Werner, M., Shpakovski, G. V., and Thuriaux, P. (2001) Mol. Cell. Biol. 21, 6056 – 6065 15. Westover, K. D., Bushnell, D. A., and Kornberg, R. D. (2004) Science 303, 1014 –1016 16. Shpakovski, G. V., Acker, J., Wintzerith, M., Lacroix, J. F., Thuriaux, P., and Vigneron, M. (1995) Mol. Cell. Biol. 15, 4702– 4710 17. McKune, K., Moore, P. A., Hull, M. W., and Woychik, N. A. (1995) Mol. Cell. Biol. 15, 6895– 6900 18. BIAevaluation 4.0 Software Handbook (2003) Biacore AB 2, Uppsala, Sweden. 19. Kay, L. E., Ikura, M., Tshudin, R., and Bax, A. (1990) J. Magn. Reson. 89, 496 –514 20. Wittekind, M., and Mu¨ller, L. (1993) J. Magn. Reson. B101, 201–205 21. Grzesiek, S., and Bax, A. (1993) J. Biomol. NMR 3, 185–204 22. Grzesiek, S., Anglister, J., and Bax, A. (1993) J. Magn. Reson. B101, 114 –119 23. Bax, A., Clore, G. M., Driscoll, P. C., Gronenborn, A. M., Ikura, M., and Kay, L. E. (1990) J. Magn. Reson. 87, 620 – 627 24. Kuboniwa, H., Grzesiek, S., Delaglio, F., and Bax, A. (1994) J. Biomol. NMR 4, 871– 878 25. Delaglio, F., Grzesiek, S., Vuister, G. W., Zhu, G., Pfeifer, J., and Bax, A. (1995) J. Biomol. NMR 6, 277–293 26. Johnson, B. A. (2004) Methods Mol. Biol. 278, 313–352 27. Gu¨ntert, P., Mumenthaler, C., and Wu¨thrich, K. (1997) J. Mol. Biol. 273, 283–298 28. Pearlman, D. A., Case, D. A., Caldwell, J. W., Ross, W. R., Cheatham, T. E., III, Ferguson, D., Seibel, G., and Kollman, P. (1995) Comp. Phys. Commun. 91, 1– 41 29. Cornilescu, G., Delaglio, F., and Bax, A. (1999) J. Biomol. NMR 13, 289 –302 30. Koradi, R., Billeter, M., and Wu¨thrich, K. (1996) J. Mol. Graph. 14, 29 –32 31. Laskowski, R. A., Rullmannn, J. A., MacArthur, M. W., Kaptein, R., and Thornton, J. M. (1996) J. Biomol. NMR 8, 51–55 32. Pervushin, K., Riek, R., Wider, G., and Wu¨thrich, K. (1997) Proc. Natl. Acad. Sci. U. S. A. 94, 12366 –12371 33. Loria, J. P., Rance, M., and Palmer, A. G., III (1999) J. Am. Chem. Soc. 121, 2331–2332 34. Voutsina, A., Riva, M., Carles, C., and Alexandraki, D. (1999) Nucleic Acids Res. 27, 1047–1055 35. Holm, L., and Sander, C. (1995) Trends Biochem. Sci. 20, 478 – 480 36. Bates, P. A., and Sternberg, M. J. E. (1999) Proteins 3, (suppl.) 47–54 37. Flores, A., Briand, J.-F., and Gadal, O. (1999) Proc. Natl. Acad. Sci. U. S. A. 96, 7815–7820 38. Mulder, F. A. A., Schipper, D., Bott, R., and Boelens, R. (1999) J. Mol. Biol. 292, 111–123 39. Theobald, D. L., Mitton-Fry, R. M., and Wuttke, D. S. (2003) Annu. Rev. Biophys. Biomol. Struct. 32, 115–133 40. Zuiderweg, E. R. P. (2002) Biochemistry 41, 1–7 41. Tossavainen, H., Permi, P., Purhonen, S. L., Sarvas, M., Kilpela¨inen, I., and Seppala, R. (2006) FEBS Lett. 580, 1822–1826 42. Gerstein, M., and Echols, N. (2004) Curr. Opin. Chem. Biol. 8, 14 –19 43. Kovrigin, E. L., and Loria, J. P. (2006) Biochemistry 45, 2636 –2647 44. Atkinson, R. A., and Kieffer, B. (2004) Prog. Nucl. Magn. Reson. Spectrosc. 44, 141–187 45. Palmer, A. G., III (2004) Chem. Rev. 104, 3623–3640 46. Acker, J., de Graaff, M., Cheynel, I., Khazak, V., Kedinger, C., and Vigneron, M. (1997) J. Biol. Chem. 272, 16815–16821 47. Thompson, J. D., Higgins, D. G., and Gibson, T. J. (1994) Nucleic Acids Res. 22, 4673– 4680 48. Gouet, P., Courcelle, E., Stuart, D. I., and Metoz, F. (1999) Bioinformatics 15, 305–308
VOLUME 281 • NUMBER 26 • JUNE 30, 2006