EU Project Meeting on Aircraft Integrated Structural Health Assessment (AISHA), Leuven, Belgium, June 2007 For more papers of this publication click: www.ndt.net/search/docs.php3?MainSource=69
Structural Health Monitoring of Slat Tracks using transient ultrasonic waves Helge Pfeiffer 1,2, Dieter De Baere 3, Fran Fransens 2,4, Geert Van der Linden 3, Martine Wevers 2 1
METALogic nv, Technologielaan 11, 3000 Leuven KU Leuven - Department of Metallurgy and Materials Engineering, Leuven, Belgium Phone: +32 16 32 12 32, Fax: +32 16 32 19 90; e-mail:
[email protected] 3 ASCO Industries, Weiveldlaan 2, 1930 Zaventem, 4 Groep T (Associatie K.U.Leuven), Vesaliusstraat 13, 3000 Leuven, Belgium 2
Abstract Slat tracks enable the load transmission and movement between slats and wings during the take-off and landing of airplanes. Although, structural damage of slat tracks due to fatigue loads is very unlikely, structural health monitoring might be of interest. The ultrasonic response of transient ultrasonic waves was investigated as a function of different defect sizes of artificial and real cracks. The results show that there is a realistic chance to predict the size of the crack by a relatively simple experimental setup. Keywords: Structural health monitoring, maraging steel, crack propagation, ultrasonic detection, slat tracks
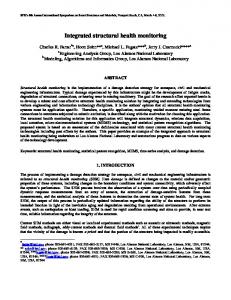
1. Introduction Extended slats enlarge the effective wing area of airplanes and thus enhance the lift during take-off and landing (Figure 1). Slat tracks are the moving beams enabling the load transmission and movement between wings and moving slats. Hence, this component is subjected to high fatigue loads (transferring all lift/drag from the slat to the fixed wing), high contact pressures (all loads are reacted against main and side rollers, allowing deployment of the slat) and all kinds of environmental degradation (salt, sand and dust, kerosene, hydraulic fluids, etc). These operational conditions lead to demanding material requirements. The aircraft manufacturers follow different design concepts when selecting materials and sizes. The slat tracks of the AIRBUS A320 manufactured by ASCO Industries are made of maraging steel and a damage tolerant concept is applied. In practice, there are almost no problems reported with those kinds of slat tracks. There is however a growing interest in structural health monitoring for different reasons.
Figure 1 Slat tracks (Left side: positions in airplane wing – Right side: dismounted)
1
A structural health monitoring technique able to reliably detect cracks at an early stage would reduce maintenance cost and enhance safety. Furthermore, structural health monitoring could have benefits for the design of a new generation of slat tracks. The investigation of the crack propagation behaviour required for the validation and certification of slat tracks is performed at dedicated test rigs at the Vrije Universiteit Brussel (VUB). If operational conditions are simulated, variable loads are applied varying between -2 kN and -5 kN and during a period of 2 seconds 40 turning points are reached. In validation tests up to 240.000 flights are simulated representing the fivefold lifetime (about 10.000.000 cycles) of an airplane. It is a characteristic feature of slat tracks that possible cracks are closed when the slat tracks are not loaded perpendicular to the beam axis. However, closed cracks challenge the options for traditional ultrasonic investigations [1]. In the recent years, various investigations were published dealing with structural health monitoring on slat track related structures [2-4]. The basic idea was to investigate the vibrational properties which gave unambiguous indications of structural damage. The occurrence of closed cracks must not be disadvantageous in that case. Another promising approach was established by using ultrasonic surface waves (Rayleigh waves) for the detection of crack properties [5-8]. However, the excitation of surface waves required the application of bulky wedge sensors which cannot be used in practice because within the mounted slat track there is only a slit of about 1 mm available for sensor installations.
2. Ultrasonic response in a steel bar There is a general agreement that sensors applied in structural health monitoring must be cheap and simple. This considers the fact that in most cases, a relatively big number of sensors would be required to establish a SHM system. But, even simple sensors can be tailored to specific materials, limited crack sizes etc., so that the requirements for high-end sensors, such as broad bandwidth, requirements for versatile handling etc must not be met.
Figure 2 Simplified representation of the steel beam with piezoelectric patches at four different positions.
When using Lamb waves for the damage detection in thin aluminium alloy sheets (such as stringer/frame constructions made of Al-2024), the application of adhesively bonded piezoelectric patches has been proposed, and successfully validated (see e.g. [9, 10]). At the KU Leuven, the question was investigated whether this concept can also be applied to thicker structures, such as slat tracks. Also in this case, the frequency response of the adhesively bonded sensors will deviate from the response spectrum of free piezoelectric ceramics. In order to prove this concept, investigations were started with a simple steel bar. The piezoelectric patches (PIEZOCERAM-PCM 81, thickness 1 mm, width 5 mm, length about 40 mm) were glued (LOCTITE 3880 - conducting glue) at four different
2
positions (Figure 2). The initial wave burst (5 counts – rectangular window) had a frequency of 2 MHz, and the sensors were driven by a function generator (IWATSU SG-4511) with an output voltage of 5Vpp. The signal was received by an oscilloscope (LeCroy 9310AM) and digitized by a PC-controlled read-out unit for further processing. It was investigated what kind of ultrasonic signals were obtained when the piezoelectric patches served as actuators and sensors in different combinations. Due to the perpendicular irradiation via the main surface, it was evident that there was a strong bulk wave propagating perpendicular through the material. Also the transmission between patches in diagonal positions was more than sufficient. For damages at the surface, the transmission of signals between adjacent patches at the same side was of special interest. A typical waveform is shown in Figure 4. The apparent wave velocity was determined to be about 4000 m/s. This is clearly slower than the bulk velocity of steel (about 6100 m/s), but it is faster than the shear and the Rayleigh velocity which are in the range of 3000 m/s [11]. It is concluded that the received ultrasonic wave is a superposition of direct and indirect wave modes arriving at that sensor position. It is beyond the scope of this paper to investigate the specific nature of these modes in detail. The actual question was whether the wave contains enough information on the simulated damage state of the steel beam.
Figure 3 Steel bar equipped with piezoelectric sensors in an electrical discharge machine (EDM at KU Leuven). The piezoelectric patches were driven by a 2 MHz wave burst.
In order to investigate the transmission of acoustic energy as a function of the simulated defect size, a thin slit (width of 0.25 mm) was applied by an electrical discharge machine (EDM). It was oriented in parallel with the orientation of the patches (Figure 3). The depth of the slit was increased in steps of 0.1 mm until a final slit depth of 0.8 mm was reached. After every step, the dielectric oil was carefully removed from the steel bar, and the ultrasonic signals were recorded. Due to the superposition of a multitude of direct and reflected modes, the analysis of the obtained wave bursts required the selection of an appropriate time gate. For the plot shown at the right side of Figure 4, the time gate between 20 and 30 µs gave a very good result to obtain a strong correlation between increasing slit size and decaying signal. The acoustic energy was expressed by the root mean square value and one can see that the transmitted energy decays from 0.0 mm until 0.8 mm down to about 50% of
3
its initial value. This shows that this time gate contains a high portion of acoustic energy that propagates directly at the surface so that they “feel” the removal of transmitting material.
0,06 100
0,04 90
80
RMS (%)
Signal (mV)
0,02
0,00
-0,02
70
60
-0,04
50
-0,06 0
10
20
30
40
50
Time (µs)
40 -0,1
0,0
0,1
0,2
0,3
0,4
0,5
0,6
0,7
0,8
0,9
1,0
1,1
Slit depth (mm)
Figure 4 left side: Waveform received at the sensor when excited by the actuator patch. The frequency of the initial waveburst was 2 MHz. The vertical lines show the time gate for determining the RMS value. Right side: RMS value (percentage of initial value) of the selected time gate as a function of the artificial slit depth
This set-up realised at the KU Leuven thus showed the principal feasibility of using glued simple patches for damage detection in thicker steel bars. From the scattering of the RMS values, one can estimate that the accuracy of the detection of the crack propagation could be in the range of ±0.2 mm. This might be astonishing because this would be much smaller than the effective wavelength which is in the range of 2-3 mm. However, reflected wave bursts which depend on a certain defect size were not observed, but a gradual reduction of the transmitted energy as a function of a gradual removing of transmitting material is registered.
3. Ultrasonic response in a slat track using electrical discharge machining The set-up used for the tests in the previous section was adapted for measuring real slat tracks. In this case, the slit representing the crack has an orientation of about 45° with respect to the side surfaces, which is typical for crack propagation in real slat tracks. An electrical discharge machine was used again.
PZT 1
PZT 2
d
Slit
Figure 5 Left side: Slat track with partially removed side surfaces and artificial crack (slit). Right side: Simplified presentation of the orientation of the slit.
4
Two piezoelectric patches (PI Ceramics PIC 151 with wrapped electrodes, thickness 0.5 mm, width 10 mm) were glued (LOCTITE HYSOL EA 9309 3NA) at a distance of about 50 mm (Figure 5, left side). The tests were performed at different frequencies (0.50 MHz, 1.07 MHz, 2.25 MHz, 4.40 MHz and 4.7 MHz) in order to find the best compromise between maximal signal transmission and optimal correlation between slit size and the decay of the ultrasonic signal. The choice of the appropriate frequency depends on many parameters. At lower frequencies, the effects of boundary conditions are very dominant, at very high frequencies absorption phenomena play a significant role. In contrast to the simple steel bar investigated in the previous section, the ultrasonic response in the case of the slat track is more complex. This especially regards the selection of the appropriate time gate. The information of the slit size is contained in the superposition of direct and reflected wave modes. Using an optimisation programme written in MatLab, the most appropriate time gate which gave the best correlation between increasing slit size and decaying RMS-signal was searched. Furthermore, the best correlation was found for a frequency of 4.40 MHz such as shown in Figure 6. It gives an almost smooth transmission curve. The outlier in the plot for 2.25 MHz might be a result of interferences between wavelength and crack dimensions. The critical crack depth when a slat track must be replaced during maintenance is in the range of 4 mm. Therefore, the reliable detection of the crack size would be crucial. In the present configuration, the detection of crack sizes with an accuracy of better than ±1 mm appears to be an achievable target. 1,1 1,0
artificial crack at 4.40 MHz artificial crack at 2.25 MHz
0,9 0,8
RMS (a.u.)
0,7 0,6 0,5 0,4 0,3 0,2 0,1 0,0 0
2
4
6
8
10
12
14
16
18
20
22
Crack depth (mm)
Figure 6 Decay of the RMS values of the ultrasonic transmission of the wave burst as a function of the slit length d, obtained in a real slat track. The optimum frequency appeared to be at 4.40 MHz. The grey bar indicates the crack depth when a slat-track has to be replaced. The photos show the slat track in the electrical discharge machine (KU Leuven)
5
4. Ultrasonic response in a slat track under realistic dynamic load The fatigue tests were performed with a dedicated hydraulic test rig (INSTRON). The uni-axial loading is applied perpendicular to the beam axis leading to a mode I crack opening. The crack initiation was triggered by a mechanical indent (size of about d=1.3 mm) before the dynamic loading was started. In the crack initiation phase, the loads were varied sinusoidally between 0 and 6 kN with a frequency of 5 Hz. After the crack initiation started, a specific load spectrum was used which was derived from the load spectrum recorded at a real flight [7]. The extend of crack propagation following the crack initiation was measured by crack propagation gauge (TK-09-CPA02) having a spacing of 0.25 mm [8]. An obvious feature of the crack propagation is the approximate plateau phase between 35,000 and 115,000 simulated flights (Figure 7). At this phase, about 80,000 flights were required to enable a crack growth of about 0.25 mm. This discontinuity is a result of the limit load test that had to be performed according to the demands of the respective qualification tests. The limit load creates a substantial increase of the plastic zone around the tip of the crack resulting in such a strong retardation of crack growth. 9 8
Crack depth (mm)
7 6 5 4 3 2 1 0 20000
40000
60000
80000
100000
120000
140000
Number of flights
Figure 7 Left side: Crack propagation as a function of the number of simulated flights (between 26,000 and 126,000). There is a characteristic plateau phase indicating the retardation of crack growth is due to the extension of the plastic zone of the crack induced by the limit load test. Right side: Hydraulic test rigs for applying dynamic load on slat tracks at the VUB.
Two piezoelectric patches (PI Ceramics PIC 151 with wrapped electrodes, thickness 0.5 mm, width 10 mm) were glued (LOCTITE HYSOL EA 9309 3NA) at a distance of about 50 mm (Figure 5, left side). A particular feature of this fatigue test is that the cracks are only open if the slat track is under load. Therefore, every time when a wire of the crack propagation gauge was broken, the fatigue process was interrupted and the ultrasonic tests were performed, under static load (3 kN) and without load 0 kN (Figure 8, left side). The Vpp-values in the case of the open crack show a characteristic decay. Due to technical reasons there is a gap in the data collection between crack size of 0 and 4 mm, partially due to the initial indent size of about 1.3 mm. In order to compare that values with those values obtained with the artificial slit in the previous set-up, the relative acoustic energy decay (represented by the RMS-value or Vpp) was plotted as a function of the slit and crack depth. Both measurements show a sufficient agreement (Figure 8, right side). It was mentioned above, that the critical crack depth when a slat track must be replaced during maintenance is in the range of 4 mm. From Figure 8 one
6
can derive that, using the given set-up, the slat track has to be replaced when the transmitted acoustic energy is decayed down to 50% of the initial energy. 1,1
1,0
1,0
0,9
0,9
Acoustic energy (a.u.)
1,1
0,8
Vpp (a.u.)
0,7 0,6 0,5 0,4 0,3
open crack closed crack
0,2 0,1
artificial open crack fatigue crack - open
0,8 0,7 0,6 0,5 0,4 0,3 0,2 0,1
0,0
0,0 0
1
2
3
4
5
Crack depth (mm)
6
7
8
9
0
2
4
6
8
10
12
14
16
18
20
22
Crack depth (mm)
Figure 8 Left side: Decay of the Vpp value at the slat track with open and closed crack due to fatigue load (measured at 4.30 MHz). Right side: Comparison of the decay of transmitted acoustic energy due to the artificial crack (using electrical discharge machining) at 4.40 MHz, and due to fatigue load measured at open crack at 4.30 MHz. The grey bars indicate the crack depth when the part has to be replaced according to the maintenance schedule.
If the crack is closed, the transmitted ultrasonic energy is approximately constant, despite of the increasing crack size determined by the crack propagation gauge (Figure 8, left side). An important exception is the discontinuity in the ultrasonic response at about 5 mm. This discontinuity is a result of the limit load test described above. Due to the sudden plastic deformation at the crack front, the crack will no longer be completely closed at zero-load. Acoustically, the results of the limit load are thus visible in the plot representing the closed crack, but not in the case of open crack. An essential point was the permanent interrogation of the quality of the sensor connections during the fatigue tests. Due to the periodic load, the connections between piezoelectric patches and slat track were under permanent stress, especially due to the mismatch of the tensile elasticity in both materials. In order to minimise possible consequences of this mismatch, the glue must be sufficiently elastic, without challenging the acoustic transmission. In order to trace the quality of the sensor connection, the impedance method was used [12]. In the case of a loosening of the sensor attachment, the impedance spectrum of the patches would be influenced. In our case, the impedance spectra at the end and at the beginning of the test were almost the same if measured under constant load-free conditions. Although promising results were obtained, the set-up has to be improved. In the present configuration, the achievable accuracy is in the range of ±1 mm. In order to detect cracks in an earlier stage, which is principally possible according to Figure 4, advanced data analysis should be applied. Moreover, the validation technique for small crack sizes must be redesigned because of the mechanical indents which are required to trigger the crack initiation. Furthermore, the sensors must be protected against environmental influences (salt, sand and dust, kerosene, hydraulic fluids, etc) and dedicated airworthy electronics must be developed. Finally, another glue with a wider temperature range has to be selected. However, the glue used in the present configuration already showed excellent performance concerning lifetime and acoustic properties. Finally, an
7
interesting option is the combination of the proposed approach with the techniques already presented in [2-8]. Acknowledgements This research was supported by the 6th Frame Programme of the European Commission (STREP Project Number: 502907 - Aircraft Integrated Structural Health Assessment (AISHA)). Furthermore, we want to thank Carlo Nijs (Metalogic), Johan Vanhulst (KU Leuven) and Bart Pelgrims (KU Leuven) for their technical support. References 1. 2. 3. 4.
5. 6. 7. 8. 9. 10.
11. 12.
D.K. Rehbein, R.B. Thompson and O. Buck, Fatigue Crack Characterization by Ultrasonic Inspection J. Test. Eval. 18 (1990) 421-429. S. Vanlanduit, E. Parloo and P. Guillaume, An on-line combined linear-nonlinear fatigue crack detection technique NDT E Int. 37 (2004) 41-45. S. Vanlanduit, E. Parloo and P. Guillaume, Combined damage detection techniques J. Sound Vibr. 266 (2003) 815-831. P. Verboven, P. Guillaume, B. Cauberghe, S. Vanlanduit and E. Parloo, A comparison of frequency-domain transfer function model estimator formulations for structural dynamics modelling J. Sound Vibr. 279 (2005) 775-798. J. Pohl. Risstiefenmessung mit Ultraschall-Rayleighwellen, 2001. http://www.ndt.net/article/dgzfp01/papers/p04/p04.htm R. Longo, S. Vanlanduit and P. Guillaume, Laser vibrometer measures surface acoustic waves for nondestructive testing SPIE Newsroom (2006). S. Vanlanduit, P. Guillaume and G. Van der Linden, On-line monitoring of fatigue cracks using ultrasonic surface waves NDT E Int. 36 (2003) 601-607. S. Vanlanduit, P. Guillaume, J. Vermeulen and K. Harri. Damage Assessment of Structures Vi, Trans Tech Publications Ltd, Zurich-Uetikon 2005, pp. 549-556. V. Giurgiutiu and A.N. Zagrai, Characterization of piezoelectric wafer active sensors J. Intell. Mater. Syst. Struct. 11 (2000) 959-976. V. Giurgiutiu, Tuned lamb wave excitation and detection with piezoelectric wafer active sensors for structural health monitoring J. Intell. Mater. Syst. Struct. 16 (2005) 291-305. D. Royer and D. Clorennec, An improved approximation for the Rayleigh wave equation Ultrasonics 46 (2007) 23-24. V. Giurgiutiu and A.N. Zagrai, Embedded self-sensing piezoelectric active sensors for on-line structural identification J. Vib. Acoust.-Trans. ASME 124 (2002) 116-125.
8