Structure and insertion properties of disordered and ordered LiNi0 ...
Recommend Documents
We study :he electronic structure of ferromagnetic Pd3Fe in ordered and disordered phases using the Linear Muffin Tin. Orbitals (LMTO) method. The ordered ...
Hydraulic permeability of ordered and disordered single-layer arrays of cylinders ... putational power since then facilitated simulations with a ..... ber of cylinders in a unit cell of the system only: The stan- ..... Suki, and H. E. Stanley, Phys.
Carbon nanotubes, a new form of elemental carbon, were dis- covered by Iijima1 in 1991 in cathode-tip deposits during the arc-dis- charge synthesis of ...
Sep 28, 2009 - Barisci, J.N.; Wallace, G.G.; Andrews, M.K.; Partridge, A.C.; Harris, P.D. Conducting ... interface: an X-ray reflection and grazing incidence X-ray diffraction study. ... Davis, F.; Higson, S.P.J. Structured thin films as functional .
otubes9,10 exhibited only two lines at about 1350 and 1580 cm 1 corresponding to ... ion batteries.12 Carbon nanotubes produced by the arc-discharge method have been ... iron oxide. Reactions were carried out in a fixed-bed flow reactor,.
Tetsuo Kondo consideration of a new generation of approaches for controlled nanoassembly. (Whaley et al. 2000). In biological systems, skeletal materials such ...
In this paper, F- and Cr3+ are selected to improve the rate capability via .... Mn3+, and O2â atoms in the spinel phase were successfully substituted by Cr3+ and ...
B Matlab Code for Phonon Density of States and Mode Patterns. 119. B.1 Generation of ..... Vibrational properties are also of fun- damental importance to ...
Oct 23, 1995 - with direct, large scale energy-minimizing simulations. Relaxed energies are obtained without having to compute relaxed geometries.
and Gary W. Daughdrill*. ,2,3 ... Whelan and Goldman 2001; Kosiol et al. 2007; Anisimova ...... matrix and for ordered proteins is from Goldman et al. 1998.) FIG.
Mod. Phys. Lett. B 1997.11:867-875. Downloaded from www.worldscientific.com by FLINDERS UNIVERSITY LIBRARY on 02/07/15. For personal use only.
Graphene, the most promising materials for electronic, mechanical, optical and so other versatile applications ... results and the phonon frequencies described by the simple harmonic oscillator model. ...... The tunable energy gap open- ing and ...
Dec 28, 2014 - the thermal transport properties of superionic conductors in terms of enhancing ... Keywords: thermal conductivity, superionic crystal, molecular ...
We investigated the transition between disordered and ordered foraging in ants. In many ants, foragers lay pheromone trails from food sources back to their nest.
related with the composition x, while the band edge of CBM is sensitive to the ..... alloy have broken points and darkness in a variety, which originates from the ...
Abstract: We investigate the far field of a spatial dispersive shock wave generated from a Gaussian beam propagating in nonlinear nonlocal col-.
Jul 14, 2015 - dered alloys at the same 50-50% composition. We find or- dering-induced band-gap narrowing with respect to the lin- early averaged gaps of ...
Nov 13, 2018 - Disorder has been estimated in both datasets using ESpritz and Mobi 2.0 for the disordered and ordered datasets respectively. (See Methods).
tion is obtained by a Fourier transformation to real space. This technique can ... Ruthenium is a rare metal that is used in many catalysts, .... ured dead-time).
Jul 18, 2013 - dialects (for example, Romagna, Novara, and Cuneo) in which the pre- ... Butler, Jonathan L. (1972) "Schwa-Deletion or Schwa-Insertion in ...
incident X - ray w ill pump electrons from the valence band to the conduction band. ...... ovs k ite structure for a generic compound ABO 3 is sho w n in Fig. 3 . 1 .
I – Structure and Properties of Polymers - Pavel Kratochvíl ... application, the
requirements for properties are specific and there are a number of ways to meet
the ...
intersecting family, in which no element is contained in more than a -proportion of the ..... For shorthand, we say that â³ is minimal w.r.t. common intersection.
krystalitów, a ich średnia wielkość zawiera się w przedziale 15÷30 nm w za- leżności od rodzaju powłoki. Badane powłoki wykazują strukturę kolumnową.
Structure and insertion properties of disordered and ordered LiNi0 ...
... properties of disordered and ordered LiNi0.5Mn1.5O4 spinels prepared by wet chemistry. Authors; Authors and affiliations. N. Amdouni; K. Zaghib; F. Gendron ...
Ionics (2006) 12: 117–126 DOI 10.1007/s11581-006-0021-7
ORIGINA L PA PER
N. Amdouni . K. Zaghib . F. Gendron . A. Mauger . C. M. Julien
Structure and insertion properties of disordered and ordered LiNi0.5Mn1.5O4 spinels prepared by wet chemistry Received: 5 April 2006 / Accepted: 28 May 2006 / Published online: 10 June 2006 # Springer-Verlag 2006
Abstract We present the synthesis, characterization, and electrode behavior of LiNi0.5Mn1.5O4 spinels prepared by the wet-chemical method via citrate precursors. The phase evolution was studied as a function of nickel substitution and upon intercalation and deintercalation of Li ions. Characterization methods include X-ray diffraction, SEM, Raman, Fourier transform infrared, superconducting quantum interference device, and electron spin resonance. The crystal chemistry of LiNi0.5Mn1.5O4 appears to be strongly dependent on the growth conditions. Both normal-like cubic spinel [Fd3m space group (SG)] and ordered spinel (P4132 SG) structures have been formed using different synthesis routes. Raman scattering and infrared features indicate that the vibrational mode frequencies and relative intensities of the bands are sensitive to the covalency of the (Ni, Mn)-O bonds. Scanning electron microscopy (SEM) micrographs show that the particle size of the LiNi0.5Mn1.5O4 powders ranges in the submicronic domain with a narrow grain-size distribution. The substitution of N. Amdouni . F. Gendron . C. M. Julien (*) Institut des Nano-Sciences de Paris, CNRS-UMR7588, campus Boucicaut, Université Pierre et Marie Curie, 140 rue de Lourmel, 75015 Paris, France e-mail: [email protected] K. Zaghib Institut de Recherches d’Hydro-Québec, 1800 Boul. Lionel-Boulet, Varennes, Québec, J3X 1S1, Canada A. Mauger Département MIPPU, CNRS, campus Boucicaut, 140 rue de Lourmel, 75015 Paris, France Present address: N. Amdouni Laboratoire de Chimie des Matériaux, Faculté des Sciences de Tunis, Université de Tunis El Manar, Campus Universitaire, 2092 El Manar II, Tunisia
the 3d8 metal for Mn in LiNi0.5Mn1.5O4 oxides is beneficial for its charge–discharge cycling performance. For a cut-off voltage of 3.5–4.9 V, the electrochemical capacity of the Li//LiNi0.5Mn1.5O4 cell is ca. 133 mAh/g during the first discharge. Differences and similarities between LiMn2O4 and LiNi0.5Mn1.5O4 oxides are discussed. Keywords Spinel . Lithium batteries . Nickel doping . Wet synthesis . Local structure
Introduction The cyclability of Li+ ion transfer in Li-ion rechargeable batteries depends mainly on the dimensional stability of the host material during insertion and deinsertion of Li+ [1]. Recently, it was found that redox reactions of nonstoichiometric or doped LiMyMn2−yO4 (M=Li, Co, Cr, Ni, Al, etc.) spinels are much better than that of the pure LiMn2O4 ceramics, which exhibit a slight capacity fading [2]. These materials have been investigated to improve the cycling performance of LiMn2O4, showing a tetragonal distortion induced by the excess of Mn3+ Jahn–Teller ions in deeply discharged electrode. However, all the reported doping methods have led to a decreased specific charge compared to the undoped LiMn2O4 materials so far. The search of high-voltage material electrodes has been focused on two categories: the inverse spinels, e.g., LiMVO4, and the normal spinels, LiMyMn2−yO4. Recent investigations have shown that, among the Ni-substituted LiMn2O4 spinels, the composition LiNi0.5Mn1.5O4 possesses specific electrochemical characteristics such as a high capacity of 130–140 mAh/g associated with a high-voltage plateau in the 5-V range [3– 25]. Gao et al. [3] investigated the origin of the voltage profile for LiNiyMn2−yO4. For the same system, Zhong et al. [4] showed the effects of the synthesis route (sol-gel vs solid state) on some structural and electrochemical properties. The almost flat voltage profile was confirmed by Ohzuku et al. [13]. All these works only reported on structural and electrochemical information, and few of them
118
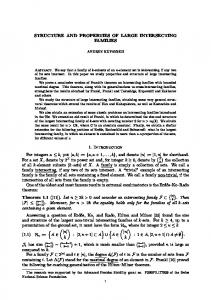
concerned the physical properties of the LiNi0.5Mn1.5O4 material. Blasse [26] showed in 1966 that LiNi0.5Mn1.5O4 is a ferrimagnetic spinel material with Ni2+ and Mn4+ on octahedral sites and Li on tetrahedral sites. In their studies of LiNi0.5Mn1.5O4 by neutron diffraction and IR spectroscopy, Gryffroy and Vandenberghe [27] showed the structure in terms of the 1:3 cation-ordering at B sites of the A[B2]O4 spinel structure, i.e., 16d sites in Fd3m, with a cubic symmetry P4332 space group (SG). A schematic representation of the structure of the normal spinel and the 1:3 ordered spinel is shown in Fig. 1. Recently, the formation of the ordered spinel has been confirmed by combining X-ray diffraction (XRD) and Fourier transform infrared (FTIR) measurements [6, 15]. Several methods have been used to synthesize LiNi0.5Mn1.5O4. These methods are solid-state reaction [7], sol-gel method [8, 9], molten salt technique [10], emulsion drying method [11], composite carbonate process [12], coprecipitation method [13], and melt-impregnation synthesis [14]. Thin-films of LiNi0.5Mn1.5O4 have been prepared by electrostatic spray deposition [15]. Results have shown that LiNi0.5Mn1.5O4 materials were obtained with different properties. In fact, the key parameter in electrochemical capacity fading could be rather the oxide morphology (grain size and/or specific surface area), as shown by the remarkable improvement reported on sol-gel LiNi0.5Mn1.5O4 [25]. The aim of this communication is the growth and characterization of the LiNi0.5Mn1.5O4 materials prepared by wet chemistry. We use two different techniques, i.e., the sol-gel method assisted by citric acid and the combustion technique assisted by glycine. The LiNi0.5Mn1.5O4 system crystallizes, in peculiar synthesis conditions, as either an ordered- or a normal-spinel phase. The synthesis process has been studied by thermogravimetry (TG) and differential thermal analysis (DTA). The long-range structure and local atomic environment are investigated by XRD, Raman scattering (RS), and FTIR spectroscopy. Electronic properties are investigated by electron spin resonance (ESR) and superconducting quantum interference device (SQUID) magnetometry, which also probe the local structure. Finally, we also report the difference in electrochemical
Fig. 1 Schematic representation of the structure of AB2O4 spinel lattices. a The smallest (primitive) cubic unit cell of normal spinel (Fd3m) and b the unit cell of the 1:3 ordered spinel (P4132). The structure is composed of alternating octants of AO4 tetrahedra and B4O4 cubes to build the face-centered cubic unit cell
properties of the two structural types of LiNi0.5Mn1.5O4 materials.
Experimental description Synthesis To compare the effect of the synthesis method, two LiNi0.5Mn1.5O4 samples were prepared by sol-gel synthesis and combustion process, both using carboxylic acid as chelating agent. The choice of these wet-chemical techniques has been guided by the remarks of Zhong et al. [4]. The sol-gel and combustion synthesis occurred from metal acetates via inorganic polymerization reactions in solution according to methods reported in our previous works [28, 29]. Compared with the conventional solid-state reaction, it is believed that these techniques offer many advantages such as lower temperature processing and better control of material morphology. The procedure for the sol-gel synthesis has been detailed elsewhere [28]. Reagent grade Li(CH3COO)·2H2O, Ni(CH3COO)2·4H2O, and Mn(CH3COO)2·4H2O were selected as raw materials. The powder samples of LiNi0.5Mn1.5O4 were prepared using stoichiometric amounts of Li(CH3COO)·2H2O, Ni(CH3COO)2·4H2O, and Mn(CH3COO)2·4H2O acetate dissolved in distilled water and added to a continuously stirred aqueous solution, and then evaporated at 80 °C until a transparent gel was obtained. The resulting slurries were heated at 400 °C for a few hours to get the product of the composition LiNi0.5Mn1.5O4. Accordingly, the powder mass was slightly ground and then fired at 680 °C in air for 5 h to improve the crystallinity of the LiNi0.5Mn1.5O4 final product. The combustion method (glycine-nitrate pyrolysis) has been reported by Chitra et al. and Julien et al. [29, 30]. In this technique, stoichiometric amounts of Li-, Ni-, and Mnnitrate salts were dissolved in triple-distilled water with a small proportion of ethanol and aqueous solution of glycine (amino-acetic acid, NH2CH2COOH). In this case, care was exercised in adjusting the concentration of the complexing agent; the pH of the solution ranged between 5 and 6.
119 Table 1 Elemental analyses of the reaction products and structural data of LiNi0.5Mn1.5O4 samples Sample
Li (wt.%)
Ni (wt.%)
Mn (wt.%)
Composition
SG
a (Å)
Sol-gel Pyrolysis Theoretical
3.81 3.83 3.80
15.80 15.70 16.07
45.35 45.15 45.11
LiNi0.49Mn1.49O4 LiNi0.49Mn1.5O4 LiNi0.5Mn1.5O4
Fd3m P4132 –
8.182 (7) 8.168 (5) –
Results and discussion Synthesis, structure, and morphology ICP measurements were carried out on LiNi0.5Mn1.5O4 oxides for determination of their elemental analysis. As shown in Table 1, both samples have a composition near the ideal one. These results prove that (1) the wet-chemical 0.4 295
0
0.3
LiNi 0.5Mn1.5O4
-20
(citrate)
-40
0.2
460
Weight loss (%)
a
0.1
-60 0
200
DTA (mV)
400
0.0 800
600
Temperature (˚C)
0.4
10 245
b
0
0.3 LiNi 0.5Mn1.5O4
-10
0.2
385
(glycine)
-20
DTA (mV)
TG–DTA analysis of the precursors was obtained using a thermogravimetric analyzer (model Netzsch STA 409) at a heating rate 0.1 °C/s under oxygen flow. Elemental analysis of the final products was determined using an induced coupled plasma (ICP) mass spectrometer (model VG Plasma Quad II-S) by dissolving the given powder samples in HCl. The phase identification was carried out by XRD using a Philips X’Pert PRO Materials Research Diffractometer (PW3050) diffractometer equipped with a Cu anticathode (CuKα radiation λ=1.54056 Å) at room temperature. The measurements were recorded under Bragg–Brentano geometry at 2θ with step 0.05° in the range 10–80°. The XRD data were analyzed by the Rietveld profile refinements using the Fullprof program. The particle morphology of the LiNi0.5Mn1.5O4 powders was examined with a scanning electron microscope (SEM, Philips XL30). Magnetic measurements were performed in a SQUID magnetometer (Quantum Design MPMS-5S). Zero-field-cooled and field-cooled magnetic susceptibility data were obtained in a field at 1 T in the temperature range 4≤T≤300 K. The FTIR absorption spectra were recorded with a Fourier transform interferometer (model Bruker IFS113v) in the wavenumber range 120–1,200 cm−1 at a spectral resolution 2 cm−1. Samples were ground to fine powders and dispersed into CsI pellet. RS spectra were collected with a Raman-laser spectrometer (Jobin–Yvon model U1000) equipped with holographic grating double-monochromator coupled with a spatial filter. Powders were press-compacted into pellet to form a mirror-like surface illuminated with the 514.5-nm emission from an Ar-ion laser (model Spectra-Physics 2020). Each RS spectrum was the average of 10 scans collected at a spectral resolution of 1 cm−1. The curve fitting is based on the original algorithm of nonlinear peak fitting described by Marquardt, and known as the Levenberg–Marquardt method [31], by using the GRAM/386 software from Galactic Industries. The fitting calculations were done assuming a linear baseline for the spectra and that all the Raman lines introduced in the fit had a mixed Gauss– Lorentz line shape [32]. The electrochemical properties of the product were tested at room temperature in cells with metallic lithium as anode electrode. Measurements were carried out following the experimental procedure previously described [33] using Teflon laboratory-cell hardware and the Mac-Pile
system. Quasi open-circuit voltage curves were recorded using a current pulse of 0.1 mA/cm2 applied for 1 h followed by a relaxation period of 0.5–1.0 h, which allows the recording of the transient voltage for the determination of chemical diffusion coefficients of Li+ ions in the LiNi0.5Mn1.5O4 lattice.
Weight loss (%)
Apparatus
0.1 -30 -40 0
200
400 600 Temperature (˚C)
0 800
Fig. 2 TG and DTA of LiNi0.5Mn1.5O4 grown by a sol-gel method via citric acid and b combustion method via glycine
120
synthesis assisted by glycine provides better stoichiometric samples than succinic acid and (2) no significant loss of lithium oxide has occurred during the thermal treatment. Figure 2a,b shows the TG–DTA curves of LiNi0.5Mn1.5O4 powders grown by the sol-gel method via citric acid and the pyrolysis synthesis via glycine, respectively. The thermal analyses of materials grown by wet-chemical methods are characterized by three steps: (1) the removal of water up to 200 °C, (2) a strong exothermic reaction in the range 240–300 °C, and (3) the region of crystallization of the final product LiNi0.5Mn1.5O4 above 400 °C. In both methods, the strong exothermic peak appears at 295 (sol-gel) and at 245 °C (pyrolysis) after the departure of the remaining water from the xerogel. The exothermic heat generated from the decomposition of acetate-ions xerogel and the combustion of the carboxylic acid, i.e., citric acid or glycine, is predicted to be utilized as the lattice energy required for the formation of LiNi0.5Mn1.5O4 phase. More than half of the weight loss occurs during this stage because of a violent oxidation–decomposition reaction. It appeared that citric acid and glycine acted as a fuel in the calcination of the gel precursor, accelerating the decomposition of acetate ions. The gel precursor was self-burning once ignited because the decomposed acetate ions acted as an oxidizer. The crystallization starts below 400 °C; thus, a well-crystallized and pure LiNi0.5Mn1.5O4 phase was obtained at 680 °C. While the calcination process at this stage was very complicated, it could be presumed that the last weak exothermic at ca. 460 °C in the DTA curve corresponds to the crystallization of the LiNi0.5Mn1.5O4 phase. During this process the mass precursor darkened progressively as a result of oxidation. Figure 3 presents the XRD patterns of LiNi0.5Mn1.5O4 phases grown by the citrate and the glycine route. The diagram of the normal spinel LiMn2O4 (Fd3m SG) is shown for comparison. The LiNi0.5Mn1.5O4 powders exhibit phase-pure cubic spinel without impurities as far as XRD is concerned. When products are calcined above 800 °C, the materials decompose with the occurrence of impurities such as NiO and LizNi1−zO, which could give rise to XRD lines at 2θ=37.5, 43.8, and 63.8°. Here, we confirm that NiO impurities can be removed by a recalcination process. The diffraction patterns of LiNi0.5Mn1.5O4 grown by the sol-gel method can be indexed by comparing those of LiMn2O4 in the cubic system with Fd3m symmetry. The results of structure refinements show a decrease of the lattice parameter which falls from a=8.243 Å for LiMn2O4 to a=8.182 Å for LiNi0.5Mn1.5O4 sol-gel phase. The diffraction patterns of LiNi0.5Mn1.5O4 grown by the pyrolysis method have been indexed in the cubic P4132 symmetry rather than the cubic Fd3m SG due to additional weak lines located at 2θ =15.3, 39.7, 45.7, and 57.5°, which are absent from that of the Fd3m structure, and the lowering symmetry observed in the resonance spectroscopy (Raman and FTIR), which could not be detected by XRD due to the small contrast of XRD patterns. Similar results
Fig. 3 XRD patterns of LiNi0.5Mn1.5O4 phases grown by wetchemistry. The normal-spinel structure (Fd3m SG) was synthesized by sol-gel method, while the ordered-spinel phase (P4132 SG) was grown by pyrolysis route. The patterns of the normal spinel LiMn2O4 (Fd3m SG) are shown by comparison
have been reported for LiNi0.5Mn1.5O4 and LiMg0.5Mn1.5O4 [16, 34]. Therefore, the primitive unit cell in the cubic system with the P4132 (or P4232) SG results in the superstructure from the 1:3 cation ordering. The cubic cell parameter a=8.1685 Å is in agreement with previously reported values which describe an octahedrally ordered spinel structure [16–19]. We assume similar distribution of the atoms, namely, Li on 8c, Ni on 4b, Mn on 12d, O(1) on 24e, and O(2) on 8c Wyckoff positions. The SG P4132 allows placing the larger Ni2+ ions (ionic radius 0.69 Å) in the bigger 4b site instead of the 16d site of normal spinel structure. The smaller unit cell dimension is primarily due to the change in the Mn oxidation state. Despite the replacement of a fraction of Mn ions by bigger Ni2+ ions, the Mn valence change effect prevails [5]. Recently, Strobel et al. [6] suggested that the occurrence of cation ordering corresponds to the largest valence difference ΔZ (Mn−M)≥2. The net result is thus a significant optimization of space occupation, leading to a reduced unit cell volume. In general, several factors can contribute to the broadening of peaks in X-ray diffraction [35]. For example, instrumental factors related to the resolution and the incident X-ray wavelength, as well as sample factors such as crystallite size and nonuniform microstrain, can cause line broadening. In the case of instrumental broadening, line width will vary smoothly with 2θ or d spacing. On the other hand, line broadening that originates from sample characteristics will have a different relationship. By combining the Scherrer’s equation for crystallite size and
121 Table 2 Structural parameters of LiMn2O4 and LiNi0.5Mn1.5O4 spinels prepared by wet-chemical method from the citrate precursor route Sample
a (Å)
L (nm)
×106
LiMn2O4 LiNi0.5Mn1.5O4
8.224 (0) 8.182 (7)
320 255
1.53 1.67
0.120
B2 cos 2 θ
LiMn2O4 LiNi 0.5Mn1.5O4
0.080
the integral breadth of Bragg lines of the doped spinel is slightly greater than those of pure samples, which suggests a smaller grain size and a higher microstrain content in LiNi0.5Mn1.5O4 (Table 2). The shape and morphology of the particles in spinel samples obtained by different methods were followed by SEM. Figure 5 shows the SEM images of the products calcined at 680 °C. It is shown that the LiNi0.5Mn1.5O4 powders consist of well-developed particles. The average particle size is estimated to be 200–280 nm for materials prepared by the sol-gel technique and 300–400 nm for materials prepared by the pyrolysis method. Moreover, the LiNi0.5Mn1.5O4 powders exhibit a uniform particle size distribution. Raman and FTIR studies
0.040 0.0
0.1
0.2
0.3
sin θ 2
Fig. 4 Plots of B cos θ vs sin θ for XRD patterns of LiMn2O4 and LiNi0.5Mn1.5O4 normal spinel phases grown by wet-chemical method. The Bragg lines were indexed using the cubic Fd3m SG 2
2
2
the Bragg’s law for diffraction, crystallite size and microstrain components are estimated by using the following equation:
K 2 λ2 B2 cos2 θ ¼ 16 e2 sin2 θ þ 2 ; L
(1)
where B is the full-width at half-maximum after correction of instrumental broadening for finely powdered silicon powder, θ is the diffraction angle, denotes local strains (defined as Δd/d being the interplanar spacing), L is the crystallite size, and K is a near-unity constant related to crystallite shape. Plots of eight reflections for the LiNi0.5Mn1.5O4 and LiMn2O4 are presented in Fig. 4. The slope, 16, and intercept, K2λ2/L2, were used to estimate the distortion and size parameters. Apparently, Fig. 5 SEM images of LiNi0.5Mn1.5O4 phases grown by wet-chemical route via citrate precursors. a Normal spinel (Fd3m) and b ordered spinel (P4132). We note the difference in magnification between the images
Structural properties of LiNi0.5Mn1.5O4 phases grown by wet-chemical route with replacement of exactly 1=4 B site (octahedral cations) were also investigated by vibrational spectroscopy. Because Raman and FTIR are local probes sensitive to the crystal symmetry, they are useful tools when poor chemical contrast of XRD prevents the determination of the structure (amorphous structure, cation ordering, etc.). Figure 6 shows the RS spectra of LiNi0.5Mn1.5O4 powders displaying obvious differences to their LiMn2O4 counterparts. The RS spectrum of LiMn2O4 consists of a series of broad bands between 300 and 700 cm−1. The peaks at 625 (symmetric Mn-O stretching vibration of MnO6 groups), 580, 483, 426, and 362 cm−1 are assigned to A1g, F2g(3), F2g(2), Eg, and F2g(1) modes, respectively, as predicted by group theory for a cubic compound [36]. The introduction of Ni2+ ions in the spinel lattice (Fd3m SG) has modified the Raman spectra in a complicated manner. The following observations can be made: (1) The 625-cm−1 band that is associated with the symmetric Mn-O stretching vibration of MnO6 octahedra shifts slightly to 636 cm−1. (2) New features at 395 and 496 cm−1 became strong, and thus, can be unequivocally assigned to the Ni2+-O stretching mode in the structure [37]. (3) The F2g(3) splits in two components at 582 and 605 cm−1. The frequency shift of stretching vibration is attributed to (1) the increase of the average valence state of Mn ions and (2)
122
For well-controlled synthesis of LiNi0.5Mn1.5O4 grown by glycine-assisted pyrolysis method, RS spectrum indicates characteristic peaks originating from the formation of a superlattice. Analytical results are in accordance with the P4132 SG in which Ni2+ ions are located at the 4a sites in the cubic-close packed oxygen array. Comparison with the disordered LiNi0.5Mn1.5O4 (Fd3m SG) compound is made in Fig. 6. The main driving force for octahedral cation ordering is believed to be the charge difference between Mn and Ni atoms. For Ni substitution, the RS patterns show a dramatic increase in the number of active modes. Considering the symmetry correlation O7h ! O7, the irreducible representations for normal spinel (ΓNS) and for ordered spinel (ΓOS) are given by (Table 3).
Fig. 6 RS spectra of LiNi0.5Mn1.5O4 powders compared with that of undoped normal-spinel (Fd3m). The 1:3 ordered phase (P4132) gives a very different spectrum with much sharper lines resulting from the symmetry lowering. Spectra were fitted using the curve analysis based on a nonlinear peak fitting known as the Levenberg– Marquardt method with Lorentzian line shape
the decrease in the unit cell volume. The small shift of the symmetric stretching vibration of MnO6 groups can be viewed as the shortness of Mn-O bond lengths and polyhedral distortion occurring in LiNi0.5Mn1.5O4. The intensity of the shoulder located at 580 cm−1 is enhanced upon nickel substitution. This may be due to the change of the Mn3+/Mn4+ ratio vs Ni2+ in the material. The peak splitting between bands at 426 and 382 cm−1 is reduced between the bands at 407 and 378 cm−1 for LiNi0.5Mn1.5O4 due to the polyhedral distortion. Table 3 The irreducible representation of the vibrational active modes of the 1:3-ordered spinel phase in O7 spectroscopic group
Γ NS ¼ Ag ðRÞ þ Eg ðRÞ þ 3F2g ðRÞ þ 4F1u ðirÞ;
(2)
Γ OS ¼ 6A1 ðRÞ þ 14E ðRÞ þ 20F1 ðirÞ þ 22F2 ðRÞ:
(3)
It is obvious that the number of expected Raman-active modes (6A1+14E+22F2) is larger than for LiMn2O4 (Ag+Eg+3F2g). This prediction is well verified experimentally. The LiNi0.5Mn1.5O4 phase clearly shows an ordering of octahedral cations into 4b and 12d sites in SG P4132 (O7 spectroscopic symmetry). Both contain small fractions of lithium on the 4b site [6]. The sharpness of the Raman bands of the LiMn3/2Ni1/2O4 sample is the fingerprint of well separated Ni and Mn sites resulting from the symmetry lowering. As the integer valence distribution is (Li+)(Ni2+)0.5(Mn4+)1.5O4, the rather large broadness of the high-wavenumber band in normal spinel LiMn2O4 becomes a well-resolved triplet in ordered spinel lattice. This vibration is recorded at 500 cm−1 in the case of NiO [37]. Figure 7 shows the FTIR absorbance spectra of LiNi0.5Mn1.5O4 powders compared with that of undoped LiMn2O4 normal-spinel. Frequencies have been determined by fitting using a mixed Gauss–Lorentz line shape. The FTIR spectrum of LiMn2O4 consists of two broad bands ν1 and ν2 at ca. 615 and 513 cm−1. Weak shoulders are observed on the low-wavenumber side with the
Atom
Wyckoff position
Point group
Li Mn Ni O1 O2 Total Acoustic Inactive Raman (42 modes) Infrared (20 modes)
Fig. 7 FTIR absorbance spectra of LiNi0.5Mn1.5O4 powders compared with those of undoped LiMn2O4 normal spinel. Frequencies have been determined by fitting using a mixed Gauss–Lorentz line shape
component ν3 at 420 cm−1. Four infrared active modes (F1u) are allowed in the O7h spectroscopic symmetry [36]. These results displayed in Fig. 7 show that the local structure of LiNi0.5Mn1.5O4 is strongly affected by the presence of Ni2+ ions. The FTIR spectrum of the sample grown by glycine-assisted method presents nine wellresolved modes as predicted by the symmetry lowering O7h ! O7. An increase in the number of infrared-active modes confirms the previous RS data.
Figure 8 shows the temperature dependence of the reciprocal molar magnetization normalized by magnetic fields (H/M) under an applied field H=10 kOe for the LiNi0.5Mn1.5O4 spinel grown by wet-chemical route. A ferromagnetic ordering is clearly shown at the Curie temperature θ=129 K for Ni-doped spinel. The magnetization was measured at 10 kOe gradually at lower temperatures on field cooling and measurements on heating after zero-field cooling. Figure 9 displays the field dependence of the magnetization for the LiNi0.5Mn1.5O4 sample at different fixed temperatures. Below 150 K, nonlinearity is clearly observed, suggesting the presence of a strong ferromagnetic contribution. At low temperatures, a typical magnetization curve shows the rapid increase with the magnetic field; the magnetic saturation is obtained at a relatively small field. Several authors have reported such a magnetic behavior. Blasse [38] has shown the ferromagnetic spin alignment below 130 K in LiNi0.5Mn1.5O4. Strobel et al. [5] found a large increase in the magnetic susceptibility at low temperature, starting at ca. 120 K on cooling. These features were attributed to the formation of clusters resulting from a strong magnetic frustration in the structure. Recent results by Nakamura et al. [39] have shown that the asymptotic Curie temperature moved in the positive direction and changed its sign from negative to positive around y=0.2 in LiNiyMn2−yO4 spinels. For LiNi0.5Mn1.5O4, the ferromagnetism is reported with a saturation magnetization of 105 emu/g at 5 K. Due to a large ferromagnetic component, the magnetization curves, M(H), are not linear functions of the applied
20000
100
H/M (mol/emu)
80
Magnetic moment (emu/mol)
15000
LiNi 0.5Mn1.5O4 H=10 kOe
60
40
10000
4K 30 K 50 K 100 K 150 K 200 K 300 K
5000
θ =129 K
20
0
0
0
0
50
100
150 200 Temperature (K)
250
300
Fig. 8 Temperature dependence of the reciprocal molar magnetization normalized by magnetic fields (H/M) under an applied field H=10 kOe for LiNi0.5Mn1.5O4 spinel grown by wet-chemical route. A ferromagnetic ordering is clearly shown at the Curie temperature θ=129 K for Ni-doped spinel
10000
20000
30000
Magnetic field (Gauss)
Fig. 9 Magnetization curves of the LiNi0.5Mn1.5O4 spinel as a function of the magnetic field H for different fixed temperatures. The sample was zero-field cooled from room temperature to a desired temperature and field was applied stepwise up to 30 kOe. The symbols are experimental data. The solid lines are guides for the eyes
124
ones, contribute to the broadening of the signal. The ESR spectrum of LiNi0.5Mn1.5O4 shows a much narrower signal (ΔHpp≈170 mT) centered at g=2.0. The band has a complex shape with two components. The signal is attributed to Mn4+ ions, which are the only paramagnetic entities in this compound.
6 10-4
2 10-4
317 mT
LiMn1.5Ni0.5O4
0 100 -2 10-4
-6
Electrochemical studies
LiMn2O4
10-4
-8 10-4
0
500
1000
1500
Magnetic field (mT)
Fig. 10 ESR spectra of LiMn2O4 and LiNi0.5Mn1.5O4 spinels at room temperature. The position of the center of the signal (H0=317 mT) is close to the value expected for uncorrelated spins with the gyromagnetic factor g=2.0
magnetic field, as shown in Fig. 9. The first consequence is an ambiguity in what is called magnetic susceptibility, χm, because M/H is distinct from dM/dH. Let us consider two options for the ferromagnetic behavior of LiNi0.5Mn1.5O4. First, the material should be considered as a ferromagnet itself, i.e., intrinsic ferromagnetism, due to the couplings Mn4+-O2−-Mn4+ and Ni2+-O2−-Ni2+. Secondly, ferromagnetic particles could be included in the spinel framework; such impurities (Mn3O4) in small concentrations that cannot be detected by XRD. In this case, one has an extrinsic ferromagnetism. If such particles are present in LiNi0.5Mn1.5O4, the ferromagnetism originates from these “clusters.” Ferrimagnetic impurities such as NiO or LizNi1−zO are excluded because they possess very high Curie temperatures, e.g., Tc=2,000 K for NiO [38]. In this case, the Curie–Weiss law is valid only at T≫∣θ∣. This condition can only be fulfilled above room temperature for LiNi0.5Mn1.5O4, which precludes a quantitative analysis of the H/M curve. The Curie temperature is determined by experiments (see Fig. 8). At the lowest temperature T=4 K, the magnetization saturates, so that MðT¼4K Þ ¼ Nnμeff ð0Þ;
(4)
where n is the number of magnetic ions of effective moment peffμB. The magnetic moment is equal to 3.02 μB, corresponding to a specific magnetization 88 emu/g for LiNi0.5Mn1.5O4. This value is consistent with the data reported by Nakamura et al. [39]. Figure 10 shows the ESR spectra of LiMn2O4 and LiNi0.5Mn1.5O4 spinels measured at room temperature. The ESR spectrum of LiMn2O4 consists of a very broad signal (peak to peak width ΔHpp≈350 mT) centered at about H0=317 mT. The position of the center of the signal is close to the value expected for uncorrelated spins with the gyromagnetic factor g=2.0. The ESR signal is currently attributed to the contribution of Mn4+ entities [40]. The Mn4+–Mn4+ dipolar interactions, as well as the Mn4+–Mn3+
The electrochemical properties of LiNi0.5Mn1.5O4 spinels have been widely reported [13–25]. Also, in this section, we briefly present the electrochemical data of our samples prepared by wet-chemical methods. The first charge– discharge profiles of the spinel Li//LiNi0.5Mn1.5O4 cells in the voltage range 3.5–4.9 V vs Li0/Li+ have been recorded for normal A[B2]O4 spinel lattice (Fig. 11a) and for ordered 1:3 spinel framework (Fig. 11b). Our data are consistent with those of prior results in terms of their high-voltage characteristics [41]. As can be seen in Fig. 11, the LiNi0.5Mn1.5O4 samples reveal an operating voltage higher
5.0
Cell voltage (V vs. Li/Li+)
-4 10-4
4.5
LiNi 0.5 Mn1.5O4 (normal spinel)
4.0
charge
a
discharge
3.5 0
20
40
60
80
100
120
140
Capacity (mAh/g)
5.0
Cell voltage (V vs. Li/Li +)
ESR signal (a.u.)
4 10-4
4.5
LiNi 0.5 Mn1.5O4 (ordered spinel) 4.0 discharge
b
charge
3.5
0
50
100
150
Capacity (mAh/g) Fig. 11 The first charge–discharge profile of the spinel Li// LiNi0.5Mn1.5O4 cells in the voltage range 3.5 to 4.9 V vs Li0/Li+. a normal A[B2]O4 spinel lattice and b ordered 1:3 spinel framework
125 2000
well the reversibility of this material upon deintercalation and intercalation of lithium ions. The high-voltage operation of LiNi0.5Mn1.5O4 spinels allows the use of an oxide-based material as negative electrode in Li-ion batteries. Among the spinel frameworks, LiCrTiO4 [42] and Li1.33Ti1.66O4 [43] are interesting candidates. A Li-ion cell containing LiNi0.5Mn1.5O4 spinel as positive electrode and Li1.33Ti1.66O4 spinel as negative electrode has been tested. Figure 13 shows the voltage profile of the first charge–discharge of such a cell. Long life tests are in progress. This battery operates at an average potential 3.15 V and exhibits a capacity retention 145 mAh/g at the first charge–discharge cycle.
dQ/dV (mAh/g V)
LiNi 0.5Mn1.5O4 1000
0
-1000
charge discharge
-2000 3.5
4.0
4.5
5.0
Cell voltage (V vs. Li0/Li+) Fig. 12 Plot of the incremental derivative capacity (−∂Q/∂V) for the Li//LiNi0.5Mn1.5O4 cell as a function of the cell voltage vs Li0/Li+ for the first charge–discharge process
than 4.5 V. They reveal an obvious two-step lithium intercalation/deintercalation behavior. A small plateau appears at ca. 4.0 V, related to the redox couple Mn3+/ Mn4+. The appearance of the voltage plateau at 4.7 V has been attributed to the oxidation of Ni2+ to Ni4+ [4]. The normal-spinel phase shows predominantly one-step reaction at 4.65 V, while the voltage profile of the orderedspinel structure transforms from a sloping curve to a flat curve at 4.72 V. In the voltage range 3.5–4.9 V, the Li// LiNi0.5Mn1.5O4 delivers a capacity 133 mAh/g during the first discharge. Figure 12 displays the plot of the incremental derivative capacity (−∂Q/∂V) for the Li//LiNi0.5Mn1.5O4 cell as a function of the cell voltage vs Li0/Li+ for the first charge– discharge process. The two main regions of electrochemical activity appear at 4.0 and 4.7 V. These results illustrate
Cell potential (V)
6.0 LiNi1/2Mn3/2O4
5.0
In this work, we have developed wet syntheses such as solgel and pyrolysis assisted by carboxylic acid to grow LiNi0.5Mn1.5O4 spinel materials. Structural and electrochemical characterizations were made and properties were compared with LiMn2O4 spinel. The overall picture that emerges from these investigations is as follows. Depending of the preparation procedure, two varieties of samples were obtained: the normal-spinel structure (via citric acid) and the ordered-spinel structure (via glycine). These structures refined with the Fd3m and P4132 SGs, respectively, show a smaller cubic unit cell than the undoped LiMn2O4 spinel. The shortening of M-O bonds is observed in Raman spectra by a shift of the stretching mode of MnO6 entities. The superstructure of LiNi0.5Mn1.5O4 material grown by pyrolysis method is confirmed by local probes, such as Raman and FTIR. Raman measurements reveal that the oxidation state of Ni was +2 in LiNi0.5 Mn1.5O4 spinels. Magnetic measurements have evidenced the ferromagnetic ordering below Tc=129 K in LiNi0.5 Mn1.5O4. The replacement of the 3d8-Ni for Mn in LiNi0.5Mn1.5O4 oxides is beneficial for its charge–discharge cycling performance. For a cut-off voltage 3.5–4.9 V, the electrochemical capacity of the Li//LiNi0.5Mn1.5O4 cell is ca. 133 mAh/g during the first discharge. Acknowledgements The authors wish to thank Mrs. F. Soulette for her assistance in the experimental work. Mr. M. Selmane is gratefully acknowledged for support on XRD measurements and Rietveld refinement. The work has partly supported by a grant-in-aid from the Centre National de la Recherche Scientifique–Délégation Générale à la Recherche Scientifique et Technologique collaboration program (project No. SPM13939).
4.0 Li-ion cell 3.0 2.0
Conclusion
Li4/3Ti5/3O4
1.0 0.0
0
50
100
150
200
Capacity (mAh/g) Fig. 13 Voltage profile of the first charge–discharge of a Li-ion cell containing LiNi0.5Mn1.5O4 spinel as positive electrode and Li1.33Ti1.66O4 spinel as negative electrode
References 1. Winter M, Besenhard JO, Spahr ME, Novak P (1998) Adv Mater 10:725 2. Wakihara M (2001) Mater Sci Eng R Rep 38:1 3. Gao Y, Myrtle K, Zhang MJ, Reimers JN, Dahn JR (1996) Phys Rev B 54:16670
126 4. Zhong Q, Bonakdarpour A, Zhang M, Gao Y, Dahn JR (1997) J Electrochem Soc 144:205 5. Strobel P, Ibarra-Palos A, Anne M, Le Cras F (2000) J Mater Chem 10:429 6. Strobel P, Ibarra-Palos A, Anne M, Poinsignon C, Crisci A (2003) Solid State Sci 5:1009 7. Kanamura K, Hoshikawa W, Umegaki T (2002) J Electrochem Soc 149:A339 8. Alcantara R, Jaraba M, Lavela P, Tirado JL (2002) Electrochim Acta 47:1829 9. Wu X, Kim SB (2002) J Power Sources 109:53 10. Kim J-H, Myung S-T, Sun Y-K (2004) Electrochim Acta 49:220 11. Myung S-T, Komaba S, Kumagai N, Yashiro H, Chung H-T, Cho T-H (2002) Electrochim Acta 47:2543 12. Lee YS, Sun YK, Ota S, Miyashita T, Yoshio M (2002) Electrochem Commun 4:989 13. Ohzuku T, Takeda S, Iwanaga M (1999) J Power Sources 81–82:90 14. Okada M, Lee Y-S, Yoshio M (2000) J Power Sources 90:196 15. Dokko K, Mohamedi M, Anzue N, Itoh T, Uchida I (2002) J Mater Chem 12:3688 16. Ariyoshi K, Iwakoshi Y, Nakayama N, Ohzuku T (2004) J Electrochem Soc 151:A296 17. Hong K-J, Sun Y-K (2002) J Power Sources 109:427 18. Wu HM, Tu JP, Yuan YF, Li Y, Zhao XB, Cao GS (2005) Electrochim Acta 50:4104 19. Park S-H, Sun Y-K (2004) Electrochim Acta 50:429 20. Liu GQ, Wang YJ, Qilu, Li W, Chenhui (2005) Electrochim Acta 50:1965 21. Sun Y-K, Hong K-J, Prakash J, Amine K (2002) Electrochem Commun 4:344 22. Sun Y-K, Yoon CS, Oh I-H (2003) Electrochim Acta 48:503 23. Ooms FGB, Kelder EM, Schoonman J, Wagemaker M, Mulder FM (2002) Solid State Ionics 152–153:143 24. Takahashi K, Saitoh M, Sano M, Fujita M, Kifune K (2004) J Electrochem Soc 151:A173
25. Amine K, Tukamoto H, Yasuda H, Fujita Y (1996) J Electrochem Soc 143:1613 26. Blasse G (1966) J Phys Chem Solids 27:383 27. Gryffroy D, Vaudenberghe RE (1992) J Phys Chem Solids 53:777 28. Julien C, El-Farh L, Rangan S, Massot M (1999) J Sol-Gel Sci Technol 15:63 29. Chitra S, Kalyani P, Mohan T, Gangadharan R, Yebka B, Castro-Garcia S, Massot M, Julien C, Eddrief M (1999) J Electroceram 3:433 30. Julien C, Letranchant C, Lemal M, Ziolkiewicz S, CastroGarcia S (2002) J Mater Sci 37:2367 31. Marquardt DW (1963) J Soc Ind Appl Math 11:431 32. Soppe W, Kleerebezem J, den Hartog HW (1987) J Non-Cryst Solids 93:142 33. Julien C, Ziolkiewicz S, Lemal M, Massot M (2001) J Mater Chem 11:1837 34. Kawai H, Tabuchi M, Nagata M, West (1998) J Mater Chem 8:1273 35. Klug HP, Alexander LE (1974) X-Ray diffraction procedures for polycrystalline and amorphous materials. Wiley, New York 36. Allen GC, Paul M (1995) Appl Spectrosc 49:451 37. Cordoba-Torresi SI, Hugot-Le Goff A, Joiret S (1991) J Electrochem Soc 138:1554 38. Blasse G (1966) J Phys Chem Solids 27:383 39. Nakamura T, Yamada Y, Tabuchi M (2005) J Appl Phys 98:93905 40. Capsoni D, Bini M, Chiodelli G, Massarotti V, Mozzatti MC, Anzoni C (2003) Solid State Commun 125:179 41. Julien CM, Massot M (2004) In: Extended abstracts of the 5th France–Japan joint seminar on lithium batteries. Batz-sur-Mer, p 11 (September 26–28) 42. Ooms FGB, Kelder EM, Schoonman J (2001) IEE Batter Lett 2:B59 43. Julien CM, Zaghib K (2004) Electrochim Acta 50:411