Structure and size distribution of TiO2 nanoparticles deposited on stainless steel mesh W. Li Department of Materials Science and Engineering, University of Delaware, Newark, Delaware 19716
S. Ismat Shaha) Department of Materials Science and Engineering and Department of Physics and Astronomy, University of Delaware, Newark, Delaware 19716
M. Sung and C.-P. Huang Department of Civil and Environmental Engineering, University of Delaware, Newark, Delaware 19716
共Received 25 January 2002; accepted 16 September 2002兲 Doped and undoped TiO2 nanoparticles with narrow size distribution were deposited on stainless steel mesh substrates by metalorganic chemical vapor deposition. The chemical composition of TiO2 nanoparticles was measured by energy dispersive x-ray spectroscopy and x-ray photoelectron spectroscopy. X-ray diffraction and transmission electron microscopy were performed to investigate the size and the size distribution of particles as well as the structural phase transitions. For pure TiO2 , the results showed that anatase polycrystalline nanoparticles with average size from 23 to 31 nm were obtained for substrate temperatures between 350 and 600 °C. Particles deposited below 350 °C were x-ray amorphous and rutile began to precipitate at temperatures above 700 °C. The particles synthesized at 600 °C had the smallest size and narrowest size distribution. In order to study the dopant effects on the photocatalytic properties, growth temperature of 600 °C was selected to prepare 1 at. % Nd3⫹ doped TiO2 nanoparticles. The results of photodegradation of the pollutant 2-chlorophenol solution irradiated under ultraviolet light showed that 1 at. % of Nd3⫹ doped TiO2 had an enhanced degradation of the pollutant. The enhancement of photocatalytic efficiency by doped nanoparticles was ascribed to the large surface area and trapping induced prolonged lifetime of holes. © 2002 American Vacuum Society. 关DOI: 10.1116/1.1520557兴 I. INTRODUCTION TiO2 has been widely investigated for its promising applications in the field of catalysis.1– 4 Numerous efforts have been focused on the improvement of its catalytic capability for the destruction of organic and inorganic pollutants that exist in air and aqueous systems. Within the fast growing area of photochemistry of nanosemiconductor materials, particularly in the last decade, TiO2 nanoparticles became the focus of interest due to their unique photophysical and photocatalytic properties compared with that of the bulk. It is known that the number and the lifetime of charge carriers on the surface of the nanoparticles are crucial for initiating and maintaining the photocatalytic process. The number and lifetime of free electrons and holes are determined by the competition between recombination and trapping of carriers as well as that between trapped carriers and the interfacial charge transfer.4 In addition to the large surface area for maximum contact between charge carriers and pollutant, TiO2 nanoparticles with the appropriate size range can also make the interfacial transfer of charge carriers easier and further reduce the recombination rate and increase the lifetime. Outside of that size window, volume recombination and surface recombination occurs for larger particles and very fine particles, respectively. Based on the essential characteristics of nanostructured TiO2 particles and theories of enhancement of photocatalytic performance, approaches ina兲
Electronic mail:
[email protected]
2303
J. Vac. Sci. Technol. B 20„6…, NovÕDec 2002
cluding various selective surface treatments4 –11 and doping methods12,13 have already been used to improve the trapping efficiency of charge carriers and, consequently, the efficiency of photodegradation. One of the keys to further exploring the potential of TiO2 nanoparticles is the development of a synthesis process that can easily produce doped and undoped nanoparticles with the desired particle size and a relatively narrow particle size distribution. This article describes the use of metalorganic chemical vapor deposition 共MOCVD兲 with titanium tetraisopropoxide 共TTIP兲 precursor to deposit pure TiO2 and Nd3⫹ doped nanoparticles on stainless steel mesh substrates at various growth temperatures. There are only few reports that describe the synthesis of TiO2 nanoparticles by MOCVD with TTIP precursor.14 –17 TTIP is not commonly utilized for the synthesis of doped TiO2 . It is known that particle size and its distribution are mainly determined by growth temperature and TiO2 deposition rate which, in turn, relies on the flow rate of the carrier gas and TTIP concentration in the carrier gas. The total TTIP concentration in the gas phase can be varied by varying the flow rate of the carrier gas, the liquid precursor temperature, and the system pressure. Therefore, the control of size distribution can be achieved by simply controlling the temperature of the substrates and the flow rate of the precursors. Different concentrations of Nd3⫹ dopant are successfully incorporated into the particles by introducing a dopant precursor into the reactor through a solid source, separated from the liquid Ti precursor. The concentration of dopants in TiO2 is determined by the evaporation
1071-1023Õ2002Õ20„6…Õ2303Õ6Õ$19.00
©2002 American Vacuum Society
2303
2304
Li et al.: Structure and size distribution of TiO2
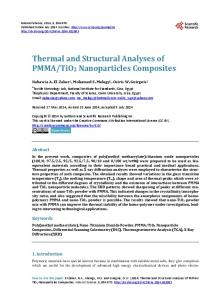
FIG. 1. Temperature profiles of the hot wall reactor for 250, 350, 500, 600, and 700 °C setup central temperatures.
rate of dopant precursor. The temperature profile of the reactor chamber is used and the Nd precursor is placed at a certain predetermined position of the reaction chamber to obtain desired Nd3⫹ concentrations. In this experiment Nd3⫹ doped and undoped TiO2 polycrystalline anatase particles with narrow size distribution are synthesized on stainless steel mesh substrates. The reaction of TTIP with the available oxygen to form intermediates and condensation of these intermediates are two crucial stages during the nucleation and growth of TiO2 nanoparticles. Their effect at various deposition temperatures on the ultimate size of the particles is discussed. The comparison of photodegradation rates of 2-chlorophenol aqueous solution with Nd3⫹ doped and undoped particles is also presented. II. EXPERIMENT TiO2 nanoparticles are synthesized in a MOCVD system.18 It is a hot wall chemical vapor deposition system equipped with a bubbling chamber for liquid precursors. A 5 cm diam and 75 cm long horizontal stainless steel chamber is used as a reactor. A range of deposition temperatures, from 250 to 750 °C, is selected to prepare pure TiO2 particles and a temperature of 600 °C is chosen for the preparation of Nd3⫹ doped TiO2 nanoparticles. The temperature profile of the reactor chamber for these deposition temperatures is shown in Fig. 1. The reactor has a 20 cm uniform central section for each temperature setup. Outside of that uniform region, the temperature gradually decreases towards the ends of the reactor. The system is pumped down to a few Pascal by a mechanical pump to increase the volatility of the liquid precursor and to reduce the contaminations from the air. Multiple layers of 475 stainless steel mesh are used to form disks. The multiple layers are necessary to increase particle collection efficiency. The substrates are cleaned by acetone, methanol, and de-ionized water and placed in the uniform temperature region of the reactor to avoid any effects of temperature fluctuation. The substrates are placed perpendicular to the gas flow direction in the chamber. Prior to the deposiJ. Vac. Sci. Technol. B, Vol. 20, No. 6, NovÕDec 2002
2304
tion, the substrates are baked at 500 °C for 15 min to remove any residual moisture. The temperature is then adjusted to the deposition temperature. After deposition, some TiO2 particles are removed from the substrate into a methanol solution and dip coated on cleaned silicon wafer or quartz substrates for various physical characterizations. Ti关 OCH(CH3 ) 2 兴 4 共titanium tetraisopropoxide, TTIP, Aldrich 97%兲 is selected as the precursor for Ti. Its flash, melting and boiling points are 22.2, 18 –20, and 232 °C, respectively. The liquid TTIP is placed in the Pyrex bubbling chamber and 99.999% Ar is used as the carrier gas. The precursor flow rate is adjusted by adjusting the bath temperature of TTIP and/or the flow rate of the Ar through the bubbling chamber. In addition to about 1.5–2 sccm Ar flow to help carry the precursor into the reactor, TTIP is heated to just below its boiling point, 220 °C, to increase its volatility for higher deposition rates. The total pressure of the reactor chamber is raised to 2⫻103 Pa s 共15 Torr兲 by adding 20 sccm O2 to the Ar and TTIP mixture in a baffle. The mixture is directly introduced into the reactor chamber for the TiO2 formation. For doping, 关 CH3 COCHCOCH3 兴 3 Nd•xH2 O 共neodymium 共III兲 acetylacetonate hydrate, Aldrich兲 in powder form is selected as the Nd3⫹ ion dopant precursor. Its melting point is 143 °C. The dopant precursor is placed in a clean Cu container, which is then directly placed at a predetermined position in the chamber for a desired doping level. Since the incorporation rate of the dopant is determined by the vapor pressure of the dopant precursor, dopant concentration as a function of precursor temperature or position in the reactor is measured for doping level control. Compositions of all samples are determined by energy dispersive x-ray spectroscopy 共EDS兲 and x-ray photoelectron spectroscopy 共XPS兲. For EDS, a JEOL electron beam microprobe system is used, which is equipped with a windowless detector that allows the measurement of small amounts of dopant in samples. A SSI-M probe XPS employing Al K ␣ exciting radiation is used for the survey and high resolution scans. Ti 2p, Nd 4d, O 1s, and C 1s photoelectron peaks are recorded in the high-resolution mode. The area of Ti(2p 3/2), O(1s), and Nd(4d) peaks are used to measure the relative composition of the nanoparticles and to determine the valence states of Ti and the dopant. Structural characterizations of the doped and undoped TiO2 samples are carried out by x-ray diffraction 共XRD兲 and transmission electron microscopy 共TEM兲. XRD –2 scans are recorded using Cu K ␣ radiation in a Rigaku D-Max B diffractometer equipped with a graphite crystal monochromator. High resolution scans are also performed for particle size calculations. The particle size and size distribution are verified using a JEOL 2000FX TEM. Photodegradation experiments are performed in a photocatalytic reactor system. This bench-scale system consists of a cylindrical Pyrex-glass cell with 12 cm inside diameter and 30 cm height and a reflective interior surface. For each photodegradation experiment 10 mg of deposited TiO2 nanoparticles are readied by detaching them from the stainless steel substrates. A 100 W mercury lamp is placed in a clean quartz
2305
Li et al.: Structure and size distribution of TiO2
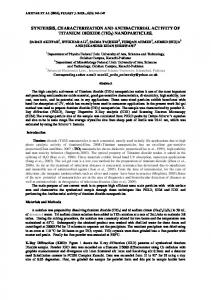
FIG. 2. XRD patterns of pure TiO2 particles deposited at 250, 350, 500, 600, and 700 °C.
tube with one of its ends tightly sealed by a Teflon stopper. The lamp with the quartz tube is immersed in the photoreactor cell, which is filled with 1 L of 50 mg/L aqueous 2-chlorophenol solution and 10 mg of TiO2 nanoparticles. The maximum energy emission at the wavelength of 365 nm is achieved 4 min after the lamp is turned on. During irradiation, the pH value of the solution is kept constant at 9.5 and O2 is supplied by bubbling compressed air from the bottom. A magnetic stirrer is used to keep the solution chemically uniform. The solution samples are collected at regular intervals in a test tube and each sample is analyzed by high performance liquid chromatography. The activity of the photocatalytic decomposition of 2-CP is estimated from the yield of carbon dioxide, determined gravimetrically as BaCO3 , by decreasing electric conductivity of Ba(OH) 2 solution. HCO⫺ 3 in the sample solution is measured by ion and liquid chromatography. A dc-190 high temperature total organic carbon 共TOC兲 analyzer is used to measure the TOC of a sample solution at constant irradiation time. An ion chromatography 共Dionex Bio LC Chromatography兲 equipped with an electrochemical detector and a Dionex PAX-100 metal-free anion column 共25 cm long, 4.6 mm I.D.兲 is used to analyze the Cl⫺ ion concentration in the sample. The eluent solution is a mixture of 80% H2 O, 10% of acetonitrile, and 10% 191 mM NaOH. The flow rate and the injection loop volume are 1 mL/min and 50 L, respectively. III. RESULTS AND DISCUSSION Figure 2 is a plot of XRD patterns from samples deposited at various temperatures showing the effect of substrate temperature on the crystalline nature of the undoped TiO2 . These TiO2 particles are prepared with a TTIP bubbler heated to 220 °C, Ar carrier gas flow rate of 2 sccm, and O2 reactant gas flow rate of 20 sccm. For the deposition temperatures of up to 250 °C, x-ray data show no detectable peaks indicating that the particles are x-ray amorphous. As the deposition temperature increases above 250 °C, the TiO2 anatase phase starts to form and shows the characteristic JVST B - Microelectronics and Nanometer Structures
2305
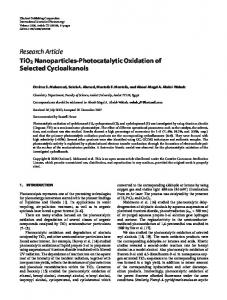
共101兲, 共004兲, 共200兲, 共105兲, and 共211兲 peaks. Figure 2 shows that with the increase in temperature from 350 to 600 °C, and the diffraction peaks broaden, indicating that the particle size is decreasing. At temperatures 700 °C and above, rutile starts to precipitate and the diffraction peaks related to the anatase phase become narrower. By using Scherrer’s formula,19 the mean crystallite sizes for undoped particles are calculated as 34⫾3, 29⫾3, 27⫾3, and 30⫾3 nm for particles prepared at 350, 500, 600, and 700 °C, respectively. We have also deposited Nd3⫹ doped TiO2 only at 600 °C and in these samples no separate Nd related peaks are detectable by XRD. This suggests that most of the dopant ions are incorporated into the TiO2 lattice either at substitutional or interstitial sites. Figure 3 shows TEM bright field images 共left column兲, diffraction patterns 共inset兲, and their respective size distributions 共right column兲 for the undoped TiO2 nanoparticles. All samples have anatase diffraction patterns except for the one deposited at 700 °C. The particle size and distribution are statistically measured by using dark field images and a commercial data analysis package, Scion Image.20 The particle size distribution histograms show that TiO2 particles are relatively homogenous with a small distribution tail. The particle sizes of 31⫾3, 25⫾4, 23⫾3, and 26⫾3 nm are measured for particles synthesized at 350, 500, 600, and 700 °C, respectively. These numbers are in agreement with the particle size measured by XRD. The size of Nd3⫹ doped TiO2 at 600 °C is measured to be approximately 22 nm, which is similar to that of pure TiO2 nanoparticles deposited at this temperature. Based on the results of TEM, the particle size as a function of the substrate temperature for pure TiO2 is plotted in Fig. 4. For all samples, the size variation with temperature is not large and the maximum size difference is limited to about 15 nm. The anatase to rutile phase transformation for pure TiO2 occurs at a temperature of about 700 °C. The anatase nanoparticle size decreases slightly with the increase of substrate temperature. Above the transition temperature, particle size increases with the appearance of the rutile phase. Because of the kinetic complexities during the formation of TiO2 and different deposition conditions, the relation between the anatase growth rate and substrate temperature is different in this MOCVD process than the processes that involve a separate calcination step.21–23 The MOCVD method used in this study is a one-step process involving simultaneous deposition and calcination. The size change of anatase particles in MOCVD can be due to a competition between the effects of substrate temperature related calcination and that of TTIP concentration and decomposition related deposition rate. If the substrate temperature related calcination is dominant during the growth of particles, particle size should thermodynamically become larger with the increase of temperature. This is applicable to the previous studies.14,21–23 If the effect of deposition rate dominates the process of particle nucleation and growth or condensation, smaller particles will be expected with increasing temperature due to increased nucleation density. This is the case for our deposition process.
2306
Li et al.: Structure and size distribution of TiO2
2306
FIG. 3. TEM bright field images 共left column兲, diffraction patterns 共inset兲, and particle size distribution histograms 共right column兲 of pure TiO2 deposited at: 共A兲 350 °C, 共B兲 500 °C, 共C兲 600 °C, and 共D兲 700 °C.
Based on previous experiments,24 the mechanism of the formation of TiO2 particles in the MOCVD system can be understood from the modified procedures below: TTIP共g兲⫹M共g兲→Ia共g兲,
共I兲
Ia共g兲⫹O2→Ib共g兲⫹R共g兲,
共II兲
Ib共g兲→Ic共s兲,
共III兲
Ic共s兲→TiO2 particles共 s兲 .
共IV兲
J. Vac. Sci. Technol. B, Vol. 20, No. 6, NovÕDec 2002
It is seen that, kinetically, there are four stages. 共I兲 Introduction of mechanically mixed TTIP vapor and O2 from a low temperature region. The TTIP vapor is activated by collisions with carrier gas M 共Ar兲 and/or second TTIP molecule to form an intermediate Ia with higher activities. 共II兲 Production of TiO2 monomers Ib from the reaction of TTIP and O2 in the higher temperature region. The other byproducts R including CO2 and H2 O are also produced. 共III兲 Condensation of TiO2 monomers Ib to form large clusters Ic by homogeneous nucleation in the gas phase based on the collision
2307
Li et al.: Structure and size distribution of TiO2
2307
FIG. 4. Sizes with appropriate error bars of pure TiO2 nanoparticles vs growth temperatures.
FIG. 5. EDS spectra of TiO2 nanoparticles doped with 0 and 1 at. % of Nd3⫹ .
mechanism between Ib and/or Ic. 共IV兲 Formation of TiO2 particles in the gas phase and on the substrates. An additional factor that affects the particle size as the temperature is increased is gas phase thermal expansion. The concentration of TTIP in the high temperature region of the reactor is reduced with the increase of growth temperature. This, in turn, causes the reduction of residence time of TTIP in the condensation region because the total gas flow is kept constant during the deposition process. TTIP with lower concentration and residence time can largely increase the mean free path of TiO2 monomers and reduce the collision frequency, although with the increase of growth temperature, the decomposition rate of TTIP can also increase,25 which increases TiO2 monomer numbers. However, the growth of these nuclei is restricted due to the decreased amount of available TTIP. Similar results were also observed for the formation of TiO2 from TiCl4 . 26,27 The anatase particle size increases when the temperature is above the phase transition point. This could be attributed to the calcination effect. The grain size of the deposited multiphase particles continue to increase as the particles remain in the reactor for the entire deposition time. Moreover, according to the model proposed by Edelson and Glaeser,28 the intra-agglomerate densification and grain growth rate occurs more rapidly than the interagglomerate densification. At relatively lower temperatures, the growth of the anatase phase is driven by interagglomerate densification due to the fact that no other phase is mixed with it. At higher temperatures, interagglomerate and intra-agglomerate densification growth models coexisted because of the formation of a rutile phase from the anatase matrix. A similar result was also reported by Porter et al. for the calcination of Degussa P25 at above 700 °C.21 More experiments are necessary to investigate the detailed mechanism of this process. From the size distribution of particles as a function of growth temperatures, it is seen that pure TiO2 nanoparticles deposited at 600 °C have the smallest average particle size, 23 nm, and narrowest size distribution. These optimal experimental conditions are selected for the preparation of Nd3⫹
doped samples. Figure 5 is the EDS result for 1 at. % Nd doped and undoped TiO2 nanoparticles. In addition to peaks from Ti, Nd, and O, peaks from the silicon substrate and C contamination are also present. The concentration measurements of Ti, O, and Nd by EDS are consistent with those obtained by the XPS survey, within the experimental error. As mentioned above, there are no obvious size and structure differences from XRD and TEM for 1 at. % Nd doped and undoped samples. Figure 6 is the comparison of photodegradation rates for the doped and undoped samples. The destruction rate of 2-CP for Nd3⫹ doped particles is much quicker than that for pure TiO2 . For 90% of 2-CP destruction, the time is reduced from 65 min for pure TiO2 nanoparticles to 25 min for 1 at. % Nd3⫹ doped samples. According to the mechanism of photocatalysis, although 23 nm pure TiO2 can provide a large surface area and a certain amount of selfelectron trappings at the Ti4⫹ host sites, the Nd3⫹ doped TiO2 has better electron trapping efficiency which increases the number and lifetime of holes. Consequently, the photo-
JVST B - Microelectronics and Nanometer Structures
FIG. 6. Photodegradation of 2-CP with undoped TiO2 and 1 at. % of Nd3⫹ doped TiO2 nanoparticles under an ultraviolet light source. Initial concentration of 2-CP, C 0 ⫽50 mg and volume⫽1000 mL with pH 9.5.
2308
Li et al.: Structure and size distribution of TiO2
catalytic efficiency is enhanced for the 2-CP oxidation, which utilizes holes. The trapping efficiency is related to the positions of Nd3⫹ ion in the TiO2 lattice. It is crucial to find the actual positions of Nd to investigate the dopant effect. However, the positions of dopant ion are determined not only by the nature of ions but also by the synthesis method. For example, dopant ions may only be absorbed on the surface of particles during the initial hydrolysis step in the sol–gel method and then some of these ions can be incorporated into the substitutional or interstitial sites of TiO2 or form a separate metal oxide phase during calcination.3 The method related dopant position difference is one of the reasons why contradicting results for the same type of dopant ion even with the same concentration level were reported, such as the disagreement whether Cr3⫹ dopant enhances or inhibits the photoreactivity of TiO2 . 29–32 Therefore, for the MOCVD method, further investigation of the positions or incorporation mechanism of Nd3⫹ and other dopants is still an important issue for future studies. IV. CONCLUSION TiO2 nanoparticles with small size distribution and low temperature dependence were successfully deposited on stainless steel mesh by MOCVD. The structure characterization was performed by XRD and TEM. For pure TiO2 , below 250 °C, only amorphous TiO2 was obtained. Anatase to rutile phase transformation occurred at about 700 °C. Pure anatase polycrystals with narrow size distribution and average size ranging from 23 to 31 nm were obtained in the temperature range 350– 600 °C. The particles deposited at 600 °C were found to have the smallest size and narrowest size distribution. The growth of anatase particles was attributed to the competition between the effect of calcination and deposition rate. At low temperature, the effect of deposition rate dominated the anatase nucleation and growth process. The change of TTIP concentration and residence time in the chamber and the increased nucleation density decreased the size of anatase nanoparticles with the increase in substrate temperature between 350 and 600 °C. At substrate temperatures above 600 °C rutile started to form. Above the phase transition point, the growth process of anatase was dominated by the calcination effect from the substrate. The optimal substrate temperature, 600 °C, was used for all the synthesis of Nd3⫹ doped TiO2 samples. The photodegradation experiment showed the enhanced catalytic efficiency for Nd3⫹ doped nanoparticles. The correlation between charge carrier trapping efficiency and Nd3⫹ position in the TiO2 lattice needs to be further analyzed.
J. Vac. Sci. Technol. B, Vol. 20, No. 6, NovÕDec 2002
2308 Presented at the IUVSTA 15th International Vacuum Congress, the AVS 48th International Symposium, and the 11th International Conference on Solid Surfaces, 28 October–2 November 2001, San Francisco, CA.
1
Photocatalytic Purification and Treatment of Water and Air, edited by D. F. Ollis and H. Al-Ekabi 共Elsevier, Amsterdam, 1993兲. 2 A. L. Linsebigler, G. Lu, and J. T. Yates, Chem. Rev. 95, 735 共1995兲. 3 R. F. Howe, Dev. Chem. Eng. Miner, Process. 6, 55 共1998兲. 4 M. R. Hoffmann, S. T. Martin, W. Choi, and D. W. Bahnemann, Chem. Rev. 95, 69 共1995兲. 5 S. T. Aruna and K. C. Patil, J. Mater. Synth. Process. 4, 175 共1996兲. 6 D. Bahnemann, A. Henglein, J. Lilie, and L. Spanhel, J. Phys. Chem. 88, 709 共1984兲. 7 O. V. Makarova, T. Rajh, M. C. Thurnauer, A. Martin, P. A. Kemme, and D. Cropek, Environ. Sci. Technol. 34, 4797 共2000兲. 8 T. Rajh, D. M. Tiede, and M. C. Thurnauer, J. Non-Cryst. Solids 205– 207, 815 共1996兲. 9 A. Dawson and P. V. Kamat, J. Phys. Chem. 105, 960 共2001兲. 10 A. Molinari, R. Amadelli, L. Antolini, A. Maldatti, P. Battioni, and D. Mansuy, J. Mol. Catal. A: Chem. 158, 521 共2000兲. 11 D. W. Bahnemann, J. Moenig, and R. Chapman, J. Phys. Chem. 91, 3782 共1987兲. 12 W. Choi, A. Termin, and M. R. Hoffermann, J. Phys. Chem. 98, 13669 共1994兲. 13 R. Asahi, T. Morikawa, T. Ohwaki, K. Aoki, and Y. Taga, Science 293, 269 共2001兲. 14 K. Okuyama, Y. Kousaka, N. Tohge, S. Yamamoto, J. J. Wu, R. C. Flagan, and J. H. Seinfeld, AIChE J. 32, 2010 共1986兲. 15 K. Okuyama, J. T. Jeung, Y. Kousaka, H. V. Nguyen, J. J. Wu, and R. C. Flagan, Chem. Eng. Sci. 44, 1369 共1989兲. 16 K. Okuyama, R. Ushio, Y. Kousaka, R. C. Flagan, and J. H. Seinfeld, AIChE J. 36, 409 共1990兲. 17 L. Lei, H. P. Chu, X. Hu, and P.-L. Yue, Ind. Eng. Chem. Res. 38, 3381 共1999兲. 18 W. Li, S. I. Shah, C.-P. Huang, O. Jung, and C. Ni, Mater. Sci. Eng. B 共accepted for publication兲. 19 B. D. Cullity, Elements of X-ray Diffraction, 2nd ed. 共Addison-Wesley, Reading, MA, 1978兲. 20 Free software from http://www.scioncorp.com 21 J. F. Porter, Y.-G. Li, and C. K. Chan, J. Mater. Sci. 34, 1523 共1999兲. 22 E. J. Kim, S. H. Oh, and S.-H. Hahn, Chem. Eng. Commun. 187, 171 共2001兲. 23 C. K. Chan, J. F. Porter, Y.-G. Li, W. Guo, and C.-M. Chan, J. Am. Ceram. Soc. 82, 566 共1999兲. 24 Q. Zhang and G. L. Griffin, Thin Solid Films 263, 65 共1995兲. 25 T. Kanai, H. Komiyama, and H. Inoue, Kagaku Kogaku Ronbunshu 11, 317 共1985兲. 26 Y. Suyama and A. Kato, J. Am. Ceram. Soc. 59, 146 共1976兲. 27 H. D. Jang and J. Jeong, Aerosol. Sci. Technol. 23, 553 共1995兲. 28 L. H. Edelson and A. M. Glaeser, J. Am. Ceram. Soc. 71, C198 共1988兲. 29 W. Mu, J. M. Herrmann, and P. Pichat, Catal. Lett. 3, 73 共1989兲. 30 E. Borgarello, J. Kiwi, M. Graetzel, E. Pelizzetti, and M. Visca, J. Am. Ceram. Soc. 104, 2996 共1982兲. 31 M. Takeuchi, H. Yamashita, M. Matsuoka, M. Anpo, T. Hirao, N. Itoh, and N. Iwamoto, Catal. Lett. 67, 135 共2000兲. 32 J.-M. Herrmann, J. Disdier, and P. Pichat, Chem. Phys. Lett. 108, 618 共1984兲.