Jul 4, 2018 - Bird Electronic SBE 25). Additionally, at .... (Fuhrman & Azam 1982, Kirchman et al. 1985, .... www. int-res. com/ articles/ suppl/ a069 p193_ supp. pdf). ..... and differential community structure in the ocean. ISME. J 4: 975â988.
AQUATIC MICROBIAL ECOLOGY Aquat Microb Ecol
Vol. 69: 193–203, 2013 doi: 10.3354/ame01631
Published online July 4
Structure and variability of a microbial community at a transect crossing a double gyre structure in the northeastern Adriatic Sea Sandi Orlic´ , Mirjana Najdek*, Nastjenjka Supic´ , Ingrid Ivan 23. Stations SJ013 and SJ107 were located in the cyclonic gyre (CG) and anticyclonic gyre (AG), respectively, and were thus affected by the presence of these gyres (A), while SJ209 was not (N) Stn SJ013
SJ107
SJ209
SD (m) T (°C) 0 3 4.5 9 0 5 10 20 0 10 18 35
23.23 23.27 22.54 20.89 23.65 23.48 22.97 16.48 22.16 21.57 20.34 15.16
S
σt
33.28 33.26 35.45 37.18 33.17 33.21 33.69 37.85 37.44 37.41 37.66 37.85
22.59 22.57 24.44 26.21 22.39 22.47 22.97 27.86 26.06 26.20 26.73 28.16
WT GP P P D D P P P D D D D D
A A A A A A A A N N N N
195
as well as by the cells’ forward-angle light scatter (FSC), used as a proxy of their size. These fluorescence signals allowed differentiation of pico- and nanoeukaryotes and cyanobacteria Synechococcus, while Prochlorococcus was not detected. Data were collected in list mode files using FL3 as a trigger parameter and processed using the software FloMax (Partec).
L PCG1 PCG2 DCG1 DCG2 PAG1 PAG2 PAG3 DAG1 DN1 DN2 DN3 DN4
stations of the transect and the resulting geostrophic currents between each 2 neighbouring stations (e.g. Supic´ et al. 2000). Density of the 0 to 1 m layer was taken to be equal to density at 1 m depth.
Autotrophic plankton abundance Samples for microphytoplankton count were preserved in 2% (final conc.) neutralized formaldehyde (Throndsen 1978). Sub-samples of 50 ml were gently homogenized, sedimented for 48 h and analyzed using an inverted microscope (Zeiss Axiovert 200) following the Utermöhl method (Utermöhl 1958). Cells were counted on 2 transects under magnifications of 400× and 200× and the entire chamber was inspected at 100× for larger species. Cells longer than 20 µm were designated as microphytoplankton (Sieburth et al. 1978). Samples for pico- and nanophytoplankton counts were preserved in 0.5% glutaraldehyde for 10 min, frozen in liquid nitrogen, and stored at −80°C until analysis. Samples were analyzed using a Partec PAS III flow cytometer, equipped with an Argon laser (488 nm). Instrumental settings were standardized for all parameters using fluorescence polystyrene calibration beads of 1, 3 and 10 µm diameter. Subpopulations of phytoplankton were distinguished by the autofluorescence of the chlorophyll content of the cells (FL3) and the phycoerythrin content of the phycoerythrin-rich cells (FL2),
Heterotrophic bacteria and heterotrophic flagellate abundance For heterotrophic bacteria abundance (HB), 2 ml of samples were stained with 4, 6-diamidino-2phenylindol (1 µg ml−1 final conc.) for 10 min, and then passed through 0.2 µm black polycarbonate fillters (Nuclepore). UV excitation with epifluorescence microscopy (Leitz Laborlux D) was used for counting (Porter & Feig 1980). At least 500 single cells were counted for each sample at a final magnification of 1000×. For heterotrophic nano- and picoflagellate abundance (HF) 15 ml of samples were filtered through black polycarbonate membrane filters (0.4 µm pore size) and counted after staining with primulin (250 µg ml−1 in 0.1 M Trizma HCl, pH = 4.0) for 15 min. The chlorophyll containing cells (i.e. autotrophic flagellates) were not counted as HF (Caron 1983).
Prokaryotic production The rate of 3H-leucine and 3H-thymidine incorporation into macromolecules was measured for estimation of prokaryotic heterotrophic production (Fuhrman & Azam 1982, Kirchman et al. 1985, Smith & Azam 1992). Triplicate (1.7 ml aliquots) samples were incubated with L-[4, 5-3H] leucine (spec. activity >100 Ci mmol−1, 20 nM final conc.) or methyl-3H-thymidine (spec. activity > 70 Ci mmol−1, 20 nM final conc.) in sterile 2.0 ml microcentrifuge tubes for 1 h in the dark at in situ temperature. Samples with 100% TCA added prior to the addition of isotopes served as blanks. Incubation of samples was stopped with addition of 100% TCA, samples were centrifuged, supernatant was discarded and labelled material was extracted with cold 5% TCA, then with 80% ethanol and finally collected by centrifugation. Specific leucine and thymidine incorporation rates were obtained by dividing the average rates per litre by bacterial abundance per litre.
Aquat Microb Ecol 69: 193–203, 2013
196
Enzymatic activities Ectoenzymatic activities were measured, in duplicate, aboard the research vessel immediately after sample collection using artificial fluorogenic substrates at saturation concentrations. Activities were determined using the following substrates: 4-methylumbelliferyl phosphate (50 µmol l−1 final conc.; Ivan 37.8, σt > 28) around –10 SJ107. In layers below 10 m, generally, currents were positive between –15 SJ013 and SJ1X7 and negative be–20 S tween SJ1X7 and SJ209. –25 Each sampling point was charac0 terized and labelled according to its –5 water type, i.e. pool (P) or surround–10 ing dense (D) water, and distinguishing between areas affected by the –15 presence of the CG and AG, or unaf–20 σt fected (N) by the 2 gyres (Table 2). –25 Thus, for example, the labels PCG1 0 and PCG2 were given to 2 samples -6 12 –5 of pool water affected by the CG. Differences between waters were –10 -8 10 tested for significance (p < 0.05) by –15 2-sample t-test (Table S1 in the Sup–20 v (cm/s) plement). Water in the pool area (P) –25 was characterized by significantly SJ013 SJX13 SJ107 SJ1X7 SJ2X9 SJ209 higher temperature and lower salinity and density compared to surFig. 2. Vertical distribution of temperature (T), salinity (S), density anomaly (σt) values and geostrophic currents relative to the 25-dbar surface (v) at sampling rounding waters (D). Locations afstations along the transect. The horizontal scale indicates the distance befected by gyre presence (A), i.e. tween sampling points. In the bottom panel, positive values indicate currents SJ013 and SJ107, were significantly flowing eastward towards the Istrian coast and negative values show westless saline and less dense than at the ward flow towards the open sea. CTD casting points are indicated by vertical dotted lines and sampling points by dots non-affected (N) station SJ209.
Depth (m)
the same period, we hypothesize that the 2 gyre structure, typical for northern Adriatic and including the CG in the north and the AG in the south, was already present in May (Fig. S1 in the Supplement at www.int-res.com/articles/suppl/a069p193_supp.pdf). Freshened waters originating from the Po delta entered the northeastern Adriatic between 2 and 10 May. At first (10 May) both main stations SJ013 and SJ107 belonged to the AG but later (between 10 and 30 May) SJ013 became part of the CG while SJ107 remained within the AG. On days before and on the sampling date the main station SJ209 was out of the gyre region. The 2 gyre structure, with some changes in spatial extent and size, persisted in the
Aquat Microb Ecol 69: 193–203, 2013
198
non-affected waters (up to 40 × 106 cells l−1). TEP concentrations were generally low (50.5 to 118.9 µg l−1) and randomly distributed. HB abundances were the highest in CG waters (up to 15 × 108 cells l−1), and their vertical distribution correspond to that of HF (r = 0.983, p < 0.05). In AG waters, HB (up to 8.5 × 10⁸ cells l−1) decreased slightly with depth, while HF (up to 16 ×105 cells l−1) correlated with nPhy (r = 0.979, p < 0.05) and pEu (r = 0.998, p < 0.05). Between affected and non-affected waters no significant differences were observed in abundances of microorganisms, TEP and chl a concentrations.
Nutrient status, autotrophic and heterotrophic abundances Fig. 3 shows the vertical distribution of concentrations of nutrients, particles and microorganisms at Stns SJ013, SJ107 and SJ209. DIN concentrations varied widely (1.8 to 6.2 µmol l−1), being significantly higher in waters of lower salinity (D < P, N < A). Orthophosphates were nearly exhausted in the entire area (0.01 to 0.07 µmol l−1, data not shown). Chl a concentration (0.05 to 0.35 µg l−1) as well as abundances of micro- (mPhy: 0.4 to 2.3 × 10⁵ cells l−1) and nanophytoplankton (nPhy: 0.3 to 1.9 × 10⁶ cells l−1) closely followed DIN concentrations (i.e. D < P), while picoeukaryotes (pEu: 0.4 to 1.7 × 10⁶ cells l−1) did so to a lesser extent. Synechococcus was abundant in pycnoclines, i.e. in samples DCG1 (13.5 × 10⁶ cells l–1) and PAG3 (27 × 106 cells l−1), and in deeper
Bacterial community structure The cluster analysis performed on the presence/ absence matrices and the related dendrogram sepa-
0
10
20
30
Depth (m)
0 1 2 3 4 5 6 7
0
DIN (µmol l–1)
0.1
0.2
0.3
0
Chl a (µg l–1)
50
100
150
TEP (µg l–1)
0 0.5 1 1.5 2 2.5
0
mPhy (105 cells l–1)
nPhy (105 cells l–1)
5
10
15
20
0 SJ013 SJ107 SJ209
10
20
30
0
5
10
15
20
pEu (105 cells l–1)
0
15
30
45
SYN (106 cells l–1)
0
4
8
12
16
HB (108 cells l–1)
0
4
8
12
16
HF (105 cells l–1)
Fig. 3. Vertical distribution of concentrations of nutrients, particulates and microorganisms at Stns SJ013, SJ107 and SJ209: dissolved inorganic nitrogen (DIN), chl a, transparent exopolymer particles (TEP), micro-(mPhy) and nano-(nPhy) phytoplankton, picoeukaryotes (pEu), Synechococcus (SYN), heterotrophic bacteria (HB) and heterotrophic flagellates (HF)
Orlic´ et al.: Structure and variability of a microbial community
rated subclusters of bacterial communities according to Dice’s similarity coefficients (Fig. 4). The overall similarity of adjacent layers, i.e. among sample groups PAG, PCG, and DCG, and within surface non-affected waters (samples DN1 and DN2) exceeded 90%. Similarity between deeper nonaffected waters (DN3 and DN4) was lower (~60%). Dense water affected by the presence of AG (i.e. DAG1) remained unclustered, but was more similar to DN1 and DN2 (~53%) than to other waters. The similarity between bacterial communities of gyres (i.e. between PCG and PAG) was low (~35%). In contrast, the communities of the pycnoclines delimiting gyres (PAG3 and DCG1) were more similar (> 60%).
Prokaryotic production and enzymatic activities Fig. 5 shows the vertical distribution of prokaryotic production and enzymatic activities at Stns SJ013, SJ107 and SJ209. Bulk thymidine (TdR) and cell specific leucine (Leu) incorporation rates were significantly higher in AG (15.1 to 16.4 pmol l−1 h−1, 0.04 to 0.05 amol l−1 h−1) than in CG (9.7 to 11.9 pmol l−1 h−1, 0.03 amol l−1 h−1; CG < AG). Leu:TdR ratios (1.54 to 4.61) were significantly lower in AG (1.54 to 2.26) than in CG (2.93 to 3.13) (data not shown). The changes in bulk Leu incorporation with depth followed the changes in HB (r = 0.945, p < 0.05), chl a
10
80
60
40
0
Dice similarity coefficient (%)
DN1
(SJ209, 0 m)
DN2
(SJ209, 10 m)
DAG1
(SJ107, 20 m)
PAG1 PAG2
(SJ107, 0 m) (SJ107, 5 m)
PAG3
(SJ107, 10 m)
DCG1
(SJ013, 4.5 m)
DCG2
(SJ013, 9 m)
PCG1
(SJ013, 0 m)
PCG2
(SJ013, 3 m)
DN3
(SJ209, 18 m)
DN4
(SJ209, 35 m)
Fig. 4. Cluster analysis dendrogram of DGGE banding pattern of seawater samples from Stns SJ01, SJ107 and SJ209, showing the Dice’s similarity coefficients calculated for all pairs of samples. ANOSIM (R = 0.799, p < 0.1%) indicates that layers of similar bacterial community structures (subclusters) significantly differ between each other
199
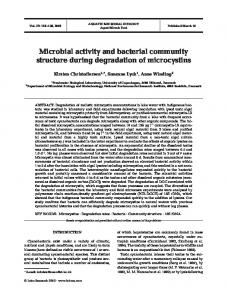
(r = 0.905, p > 0.05) and TEP (r = 0.966, p < 0.05) only in CG. Among enzymes only the activities of alkaline phosphatase (APA) were significantly higher in P than in D. Cell-specific APA (0.196 fmol cell−1 h−1), AMA (0.359 fmol cell−1 h−1) and GLU (0.133 fmol cell−1 h−1) were the highest in the core of AG, i.e. PAG2. Significant activity of dissolved APA and AMA was found in DCG1 (32 and 26% of activity, respectively, in the < 3 µm fraction) and in PAG2 (48 and 55%, respectively) (data not shown). For dissolved AMA, significant activity was also found in dense waters of both gyres (79% in CG and 85% in AG, data not shown). In PCG1 and PAG1, and nonaffected waters, activities of dissolved enzymes were below the detection limit (< 0.009 µmol l−1 h−1). Bulk prokaryotic production and enzymatic activities were significantly higher in affected waters than in nonaffected waters (N < A). The relationship among cell-specific prokaryotic production (Leu and TdR), enzymatic activities (APA, AMA and β-GLU), chl a (taken as a measure of autotrophic biomass) and TEP (taken as a measure of accumulated organic matter) is shown in the principal component analysis plot (Fig. 6). Variables with the highest loadings in each principal component (PC) have the greatest influence on the differentiations of the layers. PC1 explained 43.4%, PC2 25.4% and PC3 16.3% of variability (eigenvalues > 1). The highest loadings for positive relationship were obtained for Leu and TdR on PC1, APA and AMA on PC2 (with equal weights), and chl a on PC3. For the negative relationships the highest loadings were for TEP on PC1, Leu on PC2 and β-GLU on PC3. The score plots separated PAG3, DCG2 and DN3 according to the influence of the higher values for the Leu and TdR combined with low chl a concentrations. The influence of the highest values for the Leu and TdR and enzymatic activities governed the outgrouping of DAG1 and PAG2, respectively. The grouping of PCG1, PCG2, PAG1 and DCG1 was due to the combined influence of higher values for APA, chl a and TEP with lower values for Leu and TdR. Low rates of Leu and TdR incorporation combined with scarcely expressed enzymatic activities, determined the separation of DN1, DN2 and DN4.
DISCUSSION The results indicate that the large gyres which typically appear in the northern Adriatic, and retain freshened waters of River Po origin, the CG and AG, were formed in spring of 2009. The size and extent of
Aquat Microb Ecol 69: 193–203, 2013
200
0
10
20
30
Depth (m)
15
30
45
Leu (pmol l–1 h–1)
0
8
16
24
TdR (pmol l–1 h–1)
0
0.08
0.16
APA (µmol l–1 h–1)
0
0.1
0.2
0.3
AMA (µmol l–1 h–1)
0
0.08
0.16
β-GLU (µmol l–1 h–1)
0
10
20 SJ013 SJ107 SJ209
30
0
0.06
0.12
Leu (amol cell–1 h–1)
0
0.02
0.04
TdR (amol cell–1 h–1)
0
0.1
0.2
APA (fmol cell–1 h–1)
0
0.2
0.4
0
0.1
0.2
AMA (fmol cell–1 h–1) β-GLU (fmol cell–1 h–1)
Fig. 5. Vertical distribution at Stns SJ013, SJ107 and SJ209 of bulk (upper panels) and cell specific (lower panels) incorporation rates of thymidine (TdR) and leucine (Leu) and bulk and cell specific enzymatic activities of alkaline phosphatase (APA), aminopeptidase (AMA) and β-glucosidase (β-GLU)
the gyres changed slightly over time. On the date of sampling, the upper layers (down to approximately 10 m) of main stations SJ013 and SJ107 were part of the CG and AG, respectively. It is possible however that the gyres extended to depths greater than 10 m; however, in deeper layers the geostrophic approximation is less reliable and the exact depth of the gyres is impossible to obtain without direct measurements of currents. Satellite data indicate that previously both SJ013 and SJ107 were part of the AG. Thus, it is likely that residence time of water around Stn SJ107 was longer than around Stn SJ013. In spite of the homogenous thermohaline and trophic conditions in P of the 2 separated circulation cells, CG and AG, a low degree of similarity between their bacterial community structures was found. This small-scale variability in the bacterial community structures within waters of similar salinity and tem-
perature might be generated by heterogeneity of substrate compositions (Yokokawa et al. 2010). The seasonal variation of dissolved organic carbon (DOC) concentrations in the northern Adriatic is significant, with concentrations in summer (up to 150 µM) double those found in winter. DOC enriched in refractory compounds accumulates mainly in surface low-salinity (< 37) waters (Pettine et al. 1999, Giani et al. 2005). The modification in the concentrations and nature of DOC are due to biological and mixing processes (Christaki et al. 2009). These changes in DOC are more pronounced if transit time of freshened waters from source areas into open-sea lower-salinity water structures is longer (Laghdass et al. 2010). However, since the transit times of freshened waters from the Po delta to areas in which the AG or CG are located are approximately similar, in this case the heterogeneity in organic matter between gyres could result
Orlic´ et al.: Structure and variability of a microbial community
Fig. 6. Principal component analysis of samples, applied to chl a (Chl) and transparent exopolymer particle (TEP) concentrations, cell-specific incorporation of leucine (Leu) and thymidine (TdR), and bacterial cell-specific enzymatic activities of alkaline phosphatase (APA), aminopeptidase (AMA) and β-glucosidase (GLU). Identical symbols group samples with a high degree of similarity of bacterial community structure (see Fig. 4)
from differences in the residence time of freshwater residence in the 2 gyres. The observed variability in the bacterial community structures between gyres would then reflect differences in the composition of DOC. The high autotrophic biomass (in terms of chl a) in P of AG and CG indicated an accumulation of organic matter. Such accumulation zones are characterized by a increase in abundances of bacteria, their predators and prokaryotic production (Moran et al. 2001, Van Wambeke et al. 2004, Baltar et al. 2009). However, the increase in prokaryotic production in terms of both biomass and number of cells was associated with increased abundance of bacteria and heterotrophic flagellates in P of CG but not in P of AG. Such positive relationships observed in CG show that bacterial abundance can explain prokaryotic production to a great extent (Cole et al. 1988) and indicate that both were controlled by the same factor, namely by resource availability (Zhang et al. 2006). Comparable results in both PCG1 and PCG2 suggested that bacteria exerted similar control over produced and accumulated organic matter, giving rise to similar community structures at these 2 stations. The correlation between bacterial function and community
201
structure suggests low levels of redundancy in functional bacterial communities, and has also been observed along a productivity gradient in the oceanic transition zone (Alonso-Sáez et al. 2007). In contrast, very similar bacterial community structures in P of AG expressed different patterns of function. This finding suggests that the factors controlling bacterial growth in that area were different from those in P of CG. In P of AG the leucine incorporation together with bacterial abundance decreased from surface to the depth of autotrophic biomass maximum (at 5 m). HF did not correlate with HB, probably due to strong bacterivory by HF and a lack of efficient predation on HF (e. g. Gasol 1994). On the other hand HF could graze on bacteria and smaller planktonic algae (Hagström et al. 1988), both abundantly present in P of AG at that time. Yet, the increased cell-specific production rates suggested that bacteria were subjected to predation, i.e. if HF controls bacterial abundance, their production would be higher (Gasol 1994). The high rates of thymidine incorporation and low Leu:TdR ratios indicated that bacteria were actively synthesizing DNA and, therefore, were highly active. As HF tends to feed preferentially on the active bacteria (del Giorgio et al. 1996, Gasol et al. 2009) it is very likely that grazing had a high impact in control of prokaryotic abundance and activities. As a consequence of the presence of active bacteria and a high autotrophic biomass, enzymatic activities were stimulated at PAG2. Aminopeptidase and glucosidase are responsible for hydrolysis of polymers, released by phosphorus-limited phytoplankton. The activities of these 2 enzymes also increase due to cell lyses (Alonso-Sáez et al. 2008). Therefore, low TEP concentration in PAG2 was caused by the intense activities of these 2 enzymes. At the same time, due to shortage of phosphates, the activity of AP was pronounced. However, the differences in prokaryotic function within P of AG were apparently not as large as the orders of magnitude difference in bulk prokaryotic activities needed to be reflected in differences in community structure (Gasol et al. 2009). The strong predation and active growth of bacteria, highly advanced in AG, was possibly in its early phase in the CG. The delay between the above-mentioned processes in the CG and AG was additionally supported by the fact that high enzymatic activity found in the dissolved fraction in the AG was larger than in the CG. The layers around the pycnocline, DCG1 and PAG3, were characterized by moderately similar bacterial community structures. This indicates that pycnocline layers, at depths of ~5 m in the CG and
202
Aquat Microb Ecol 69: 193–203, 2013
~10 m in the AG, were, at some point in time, connected. They were probably formed before the CG and AG became distinct circulation cells. In addition, at both DCG1 and PAG3, Synechococcus accumulated. To optimize its growth and persistence Synechococcus requires physical stability of the water column and longer water retention (Reynolds 1987). Since the abundance of Synechococcus at PAG3 was double that found at DCG1, we presumed that water retention around PAG3 was longer than around DCG1. The community structures of D, highly dissimilar between sampling points, differed also from those in P. While communities from the upper layers resembled communities in the CG and AG, those from deeper layers were likely introduced into the northern Adriatic by high-salinity oligotrophic waters from the central Adriatic. They were probably related to variable dissolved organic matter (DOM) composition and reflect the contribution of refractory compounds. Similar dissimilarities between bacterial communities have been found to be induced by the intrusion of water masses enriched in refractory DOM (Zhang et al. 2009). The prokaryotic communities from waters affected by the presence of gyres were metabolically more active than ones from non-affected waters. Since these waters differed in salinity and not in phytoplankton biomass, it seems, in accordance with Laghdass et al. (2010), that the lower salinity waters, containing riverine discharges of organic matter, stimulated prokaryotic activities. This influence was apparently propagated into deeper layers of the waters below P. Thus, the surface gyres CG and AG, which typically appear in the northern Adriatic and are persistent for several months or even more, appear to be ‘hotspots’ of prokaryotic activities. Similar evidence has been provided for cyclonic and anticyclonic mesoscale eddies in the ocean (Baltar et al. 2010). Our study provides strong evidence based on biological, hydrographical and satellite data that the AG and CG are isolated circulation cells in which water resides for extended but different periods of time. However, further, more comprehensive studies of the positions and extents of the gyres and their role in structuring microbial communities are necessary to verify these conclusions.
Western Istrian Coastal Sea (Northern Adriatic)-WICOS’ and by the Ministry of Science, Education and Sports of the Republic of Croatia (Projects: 0982705-2729, 0982705-2731, 0982705-2707).
LITERATURE CITED
➤ Alonso-Sáez L, Arístegui J, Pinhassi J, Gómez-Consenau L
➤
➤
➤
➤
➤
➤
➤
➤ ➤
➤
➤ ➤
Acknowledgements. We thank SCUBA diver B. Jagic´ for sampling, P. Krelja for CTD casting, M. Buterer for nutrient analysis and J. Jakov