transformations of traditional social networks based on structural ex- pansion .... Traditional visual analytics tools let us filter this network based on attribute.
Structure-based hierarchical transformations for interactive visual exploration of social networks Lisa Singh, Mitchell Beard, Brian Gopalan, and Gregory Nelson Georgetown University, Washington DC 20057, USA Abstract. One of the goals of visual mining is to combine visual and analytic approaches to give users the ability to manipulate the data and better understand the data space. In this paper, we propose hierarchical transformations of traditional social networks based on structural expansion values of nodes in the network. The hierarchical visualization clusters or groups nodes with similar structural expansion values in the network. It is a complement to traditional network visualization and gives users the ability to quickly understand how structure is distributed throughout the network. There are a number of important benefits to these hierarchies including clustering based on network structure measures, a simple construction algorithm, and straightforward interactive exploration of the hierarchy and the original network. After describing our approach, we analyze a real world social network, highlighting the benefit of a network structure-based hierarchical transformation for visual exploration of this network.
1
Introduction
It can be difficult to understand and interpret data mining results. One of the goals of visual mining is to combine visual and analytic approaches to give users the ability to manipulate the data and better understand the data space. When investigating large social networks, a need exists to identify common structures in the network. For example, if we know that an individual in the network has an important role in the network, we may be interested in finding others that play a similar role in the network. The role may be based on relationships to others in the network as well as on features of the individual. In this paper, we propose an alternative view of traditional social networks based on hierarchies that supports the exploration goals of visual data mining. While hierarchies have been used extensively for visualization of ’top down’ semantic relationships, they have not been used to identify structural similarity based on node expansion within social networks. The hierarchical visualization clusters or group together nodes with similar structural properties in the network. It is a complement to traditional network visualization and gives users the ability to quickly understand how structure is distributed throughout the network. Futher, the structural similarity is based on a node’s view of the entire network, not just it relationship to its immediate neighbors. We will illustrate that determining this structural similarity using the traditional graph view is a complicated visual exploration task, particularly if the network contains more
than a handful of nodes. By considering a complementary hierarchical view of the network, the similarities are more apparent to the user. There are a number of important benefits to these hierarchies including a easily interpretable clustering based on expansion vectors of structural properties associated with network nodes, a simple construction algorithm, and interactive exploration using both a hierarchical and a traditional graph representation of the social network. Finally, the contributions of this paper are twofold. First, we introduce a novel network structure-based hierarchical transformation of a graph that is based on expansion vectors. Second, we demonstrate the utility of this transformation by using it within a visual mining tool to explore real world social networks. The paper is organized as follows. Section 2 begins with a motivating example and background that describes when our hierarchical transformation is beneficial for analysis. We describe the hierarchy semantics and clusters in section 3. Section 4 presents our visual mining case study using the Invenio network mining software. The study compares the traditional social network visual mining approach to one using our hierarchical transformation. In Section 5, we review relevant literature. Finally, Section 6 presents conclusions and final observations.
2
Social Network Background and Motivation
2.1
Social network graph models
When analyzing social networks, both attribute data and relationship data are important for gaining insight about the dynamics or patterns within the network. Examples of social networks include blog networks, email networks, disease transmission networks, and communication networks. Typically, a social network is modeled as a graph, G = (V, E). Here, the actors are represented as a set of n vertices or nodes, V = {v1 , v2 , ...vn }, and the relationships between actors are represented as m edges or links between the nodes, E = {(vi , vj ) | vi, vj ∈ V, i 6= j, i ≤ n, j ≤ n}. 1 We further extend this representation to include attributes or features associated with each actor or relationship. If we consider V to be a relation and each node in V to be an instance of a tuple, then we can specify the relation as V (vid , a1 , a2 , . . . , ak ), where vid is the node id and a1 . . . ak is the set of attributes associated with each node in V . We will refer to this attribute data as semantic content since it is domain specific. Similarly, we can specify a set of attributes for the edges E, where E is an associative relation. Here, E = {eid , a2 , . . . , ak } and each edge is an instance of a tuple in E. We will refer to social network measures that are calculated using the links in the network as structural properties. Some well known centrality structural properties include: 1
While we can use hierarchical transformations multi-mode graphs with multiple node types, we will focus our discussion on uni-mode networks with a single node type.
– Degree degree(aego ) - The number of nodes directly connected to aego . A node with high degree represents a well-connected individual in the network, i.e. one that has many direct relationships with other individuals. – Betweenness between(aego ) - The number of shortest geodesic paths that pass through aego . A node with a high betweenness value represents an individual critially positioned in the network for information flow. This person can be viewed as a bottleneck in the flow between potentially independently functioning regions of the network. Removal of this individual may result in disconnection of the network. – Eigenvector ev(aego ) - Uses the number of ’important’ nodes connected to aego to measure the importance of aego . An individual with a high eigenvalue is said to be very influencial in the network because the individual has relationships with other ’important’ nodes in the network. We refer you to Wassermann and Faust for a detailed discussion of different social network metrics [14]. 2.2
Expansion values for centrality measures
One extension of any centrality measure is to take the average value of the measure for all the nodes in the network. Instead, we investigate a different extension we call expansion. Informally, expansion is a node’s view of the network at different distances. The view is based on the calculation of some centrality measure of a node and its neighbors. The node has a value for the measure, the node’s neighbors have a value of the measure, the neighbor’s neighbor’s have a value of the measure, etc. Expansion aggregates this measure for all the neighbors at a particular distance from the node to create a vector of centrality values. To make our discussion more concrete, we will focus on a particular expansion value, hop expansion, an expansion vector for degree. The centrality measures previously described give little insight into the connectivity patterns or landscape of subgraphs in the network. The landscape can be seen more easily using the hop expansion measure because it is not a single scalar value, but a vector of values. For hop expansion, it is a measure of the number of nodes at different distances from a particular node, aego . We refer to the evaluation of a centrality measure at different distances from each node in the network as an expansion vector. This following discussion of hop expansion is based on one presented in [12]. Definition 1. The φ-hop level of a node aego is the set of nodes Nφ (aego ) = {v1 , ..., vj } for which the shortest path between any vi ∈ Nφ (aego ) and node aego has length φ. Formally, Nφ (aego ) = {vi | distance(aego , vi ) = φ , 1 ≤ φ ≤ diam(G), aego 6= vi , vi ∈ V }
We refer to the size of this set as a node’s hop degree, Hφ (aego ), where Hφ (aego ) = |Nφ (aego )|. We then define H(aego ) as the set of ordered pairs (φ, Hφ (aego )) for all hop levels up to the diameter of the network: H(aego ) = {(φ, Hφ (aego ))} ∀ φ ≤ diam(G)
(1)
This measure shows us the hop expansion for a node in the network. Each element in the vector is a pair of values, the hop level and the hop degree. The vector for each node contains up to diam(G) elements, the diameter of the network. Hop expansion is an extension of degree and gives insight about the network connectivity of the entire graph from a single nodes perspective. This measure captures the influence of other nodes on aego . Is aego surrounded by a tightly bound network (characterized by early large values) or does it go through several medium increases? Definition 2. The hierarchical transformation approximation G∗ is based on the set of hop expansion vectors for every node in the network, G. Formally, G∗ = {H(vi ) ∀ vi ∈ V }. G∗ is the set of hop expansion values for every node in G. This transformation is potentially very powerful. We will use this new representation as a way to create hierarchies of the original network. We note, that while we have illustrated the concept of ’expansion’ using ’hop expansion’, any centrality measure can be used as the basis for the expansion vector. In section 3, we will map this expansion representation to a hierarchy that can be used to interactively explore the structural landscape of a social network. 2.3
Motivation
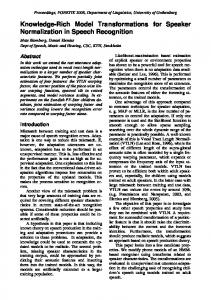
A visualization based on this hierarchical transformation can be insightful in many ways. Figure 2.3 shows an example of a social network of political blogs. It shows the connectivity structure of different blogs during the 2004 elections [1]. Traditional visual analytics tools let us filter this network based on attribute values or centrality measure, e.g. display nodes with degree greater than 3. While this provides some insight, we are still not able to readily identify nodes with structural similarity based on a node’s ’view’ of the other nodes in the network. If instead we had a rooted graph approximation that contained centrality aggregate values for neighborhoods a particular distance away, nodes with the same expansion vectors could be represented as the leaves of the same brances of a tree. With this structural similarity information clearly illustrated, social scientists can investigate questions such as: – How do nodes with the most influence compare structurally and semantically? – How does information propogate through the network? – Do nodes with a similar structural position have similar attribute values?
– How diverse is the structural landscape of the network? For networks with 10s of nodes, the answers may be visible using the traditional social network representation. For networks containing 100s or even 1000s of nodes, the traditional graph visualization will be very cluttered and difficult to interpret, even if interactive filtering operations are supported. The hierarchy will take less screen space and group together nodes with the same expansion vector. This is insightful for identification of like nodes or similar regions in a network. Therefore, in this paper, we propose giving users the ability to create hierarchical transformations of the original network based on structural properties of the nodes in the network. Each level of the hierarchy approximates a level of neighborhood structural information. For example, suppose that we build a hierarchy based on the hop expansion values of each node in the network. If two nodes have the same hop expansion vector, then their overall view of the network is similar, e.g. the two nodes have the same number of neighbors; their neighbors have the same number of neighbors; their neightbor’s neighbors have the same number of neighbors, etc. Using this information, sociologists can then compare these nodes sematically by coloring based on attribute value(s). They can also use this information to help identify potential similar community clusters in the network.
Fig. 1. Political Blogs Network
3 Semantics of Structure-Based Hierarchical Transformation When investigating large social networks, a need exists to identify common structures in the network. We accomplish this by transforming the traditional node
and edge graph representation to another meaningful structure, hierarchies that approximate structural properties in the network. However, unlike the hierarchies proposed in previous literature, these structural hierarchies take a traditional network structural property, e.g. degree, and show the expansion of that property across the network, where expansion is defined in Section 2. These hierarchies can be viewed as path prefix trees containing ego network structure vectors for each node in the network. Recall that these ordered lists can be constructed from any structural property. Once the hierarchy is built, nodes with similar structural properties are children of the same branches. Each level of the hierarchy maps to a distance level φ for the actors in G. Each node label in the hierarchy corresponds to a hop degree, Hφ , of one or more nodes in G. The value associated with each key in the tree is the number of nodes in the social network with the prefix. We will now go through an example for hop expansion of the toy social network illustrated in Figure 3. In that network, there are 5 nodes. The hop expansion values for node A are H1 (A) = 2, H2 (A) = 2, and H(A) = {(1, 2), (2, 2)}. Figure 3 shows the hierarchy for our example graph. For clarity of the example, we show the node label mapping to the hop expansion vectors in the hierarchy at the leaf nodes. The nodes have two structural paths P1 (21 , 22 ) and P2 (31 , 12 ) in the hierarchy, p = 2. Each node in the hierarchy contains the number of nodes with the prefix hop expansion vector. Also, since the network contains a single connected component, the sum of key values for each path from the root to a leaf node is n − 1. For our example, the sum of each path is 4. For this example, nodes A, D, and E have the same structural hop expansion vector. This means that nodes A, D, and E connect to the same number of nodes and their respective neighbors also connect to the same number of nodes. Therefore, A, D, and E are said to have the same ’hop expansion’ position in the network.
Fig. 2. Example - Left: social network; Right: hierarchical transformation
4
Visual mining case study
For this case study, we used a coauthorship network of scientists studying networks. The data set was created in 2006 and contains 1589 scientists and 2742 edges [9]. The network is shown in Figure 3 in the Invenio visual mining interface. Figure 4 highlights the main component of the network. When we investigate degree alone, we need to try many different values to determine which values exist in the network. We then select the ones of interest to us of a particular degree. At that stage, we can look at the neighborhoods of our neighbors and see how they compare. This process can continue iteratively until we feel that the view of the network is similar for the nodes being analyzed. The process of analysis using hierarchical transforms is as follows: the user selects an option to build a hierarchical tranform of the graph using expansion values. The user then selects the structural measure that will be used for the transformation and the maximum distance of interest, i.e. the number of levels of the hierarchy. The tool then uses the selections, generates an expansion vector and places each node in the hierarchy based on the vector values. We use a classical tree layout where children nodes are positioned below their common ancestor. The screen is then split so that both the hierarchy and the original network can be seen and exploration can be done using both representations. Initially, only the root of the structural hierarchy is expanded as illustrated in Figure 5. Then the user can focus on different parts of the hierarchy by selecting them and seeing where the nodes are in the original graph. For this example, we follow one branch multiple levels and then highlight the nodes in the original graph as shown in Figure 6. The larger nodes in the original graph correspond to the nodes with the shown expansion subbranch. We see that the nodes with expansion vector 3 and 3 appear in different parts of the network. A sociaologist can use this as evidence that like regions exist in different areas on the network. Note that if the numbers are similar down different branches of the hierarchy, then information flow is relatively even thoughout the network.
5
Related Literature
Most hierarhical analysis extracted from networks use agglomerative hierarchical clustering methods [8]. This is particularly useful for non-networked data that builds the hierarchy based on a similarity metric on an attribute. However, we feel for network data it can be interesting to build hierarchies based on network connectivity patterns. Our expansion hierarchy is an example of this. We build the hierarchy based on the local view of the network by different nodes. Specifically, each level of the hierarchy shows the ’extended’ approximate representation of the network. We have not seen this type of hierarchy built for network clustering or visual mining applications for the network as a whole. There are many visualization tools for social network analysis [13, 2, 3, 4, 6, 7, 11]. We refer you to Freeman for a survey of visualization approaches and
techniques for exploring social networks [5]. We have integrated our hierarchical transformation into one of them, Invenio [11]. The other tools do not contain an expansion based hierarchy. Instead they focus on visualization of networks using a traditional network model. Invenio is a visual mining tool for interactive exploration of social networks. To incorporate the hierarchical transformation, we implemented a dual screen that allows a user to explore the hierarchical representation and see the results of the exploration on the full social network. SpaceTree is an interactive tool for visualization of social network hierarchies [10]. However, it is based on a single node’s view of the network; the hierarchy is purely a single ego-network view. Our transformation integrates hierarchies for every node in the network. This gives every node equal importance and enables us to visually compare the structure of different nodes. Further, by not expanding certain subbrances of the hierarchy, users can hide details that are not of interest while focusing on subnetwork structure.
6
Conclusions
Hierarchies have been used to analyze networks containing parent child relationships. Here we consider using hierarchies to understand the structural relationship that exists among actors in traditional social networks. We build the hierarchy based on structural similarity, i.e. similarity in local network metrics, of different actors or nodes in the network. We are then able to easily identify like structures across a network. Even though the visualization does not automate the analysis, it provides user with the tools needed to better understand the structural relationship of nodes in the network. The user can guide and conduct the analysis more readily if the tools are interactive and the semantics of the hierarchical transformation provide insight during visual exploration of social networks. There are a number of future extensions including merging brances next to each other to create larger bins of similar nodes and incorporate attribute sematics into the hierarchy expansion process.
References 1. Lada A. Adamic and Natalie Glance. The political blogosphere and the 2004 us election. In The Proceedings of WWW-2005 Workshop on the Weblogging Ecosystem, 2005. 2. Eytan Adar. Guess: a language and interface for graph exploration. In SIGCHI conference on Human Factors in computing systems, pages 791–800, New York, NY, USA, 2006. ACM Press. 3. V. Batagelj and A. Mrvar. Pajek – program for large network analysis. Connections, 21:47–57, 1998. 4. Michael Baur, Marc Benkert, Ulrik Brandes, Sabine Cornelsen, Marco Gaertler, Boris K¨ opf, J¨ urgen Lerner, and Dorothea Wagner. Visone software for visual
Fig. 3. Invenio screen with full network
5.
6.
7. 8.
social network analysis. In Petra Mutzel, Michael J¨ unger, and Sebastian Leipert, editors, Graph Drawing Software, pages 463–464. Springer, 2002. Linton C. Freeman. Graphical techniques for exploring social network data. In J. Scott and S. Wassermann, editors, Models and methods in social network analysis. Cambridge University Press, 2004. Jeffrey Heer and Danah Boyd. Vizster: Visualizing online social networks. In IEEE Symposium on Information Visualization (INFOVIS’05), page 5, Washington, DC, USA, 2005. IEEE Computer Society. Mark Huisman and Marijtje A. J. van Duijn. Software for statistical analysis of social networks. In International Conference on Logic, 2004. A. K. Jain, M. N. Murty, and P. J. Flynn. Data clustering: a review. ACM Comput. Surv., 31(3):264–323, 1999.
Fig. 4. Coloring main component of network
9. M. E. J. Newman. Finding community structure in networks using the eigenvectors of matrices, 2006. 10. Catherine Plaisant, Jesse Grosjean, and Benjamin B. Bederson. Spacetree: Supporting exploration in large node link tree, design evolution and empirical evaluation. In INFOVIS ’02: Proceedings of the IEEE Symposium on Information Visualization (InfoVis’02), page 57, Washington, DC, USA, 2002. IEEE Computer Society. 11. Lisa Singh, Mitchell Beard, Lise Getoor, and M. Brian Blake. Visual mining of
Fig. 5. Split view with 1 level of expansion hierarchy
multi-modal social networks at different abstraction levels. In IV ’07: Proceedings of the 11th International Conference Information Visualization, pages 672–679, Washington, DC, USA, 2007. IEEE Computer Society. 12. Lisa Singh and Gregory Nelson. Understanding neighborhood structure in large social networks without knowing who’s who. In submitted to International Conference on Data Engineering, 2008. 13. L.C. Freeman S.P. Borgatto, M.G. Everett. Ucinet for windows: Software for social network analysis, 2002. 14. S. Wasserman and K. Faust. Social network analysis: methods and applications.
Fig. 6. Interactive mapping between hierarchy and social network
Cambridge University Press, Cambridge, 1994.
This article was processed using the LATEX macro package with LLNCS style