Structure-based maximal affinity model predicts small-molecule druggability Alan C Cheng1–3, Ryan G Coleman1, Kathleen T Smyth2, Qing Cao1, Patricia Soulard2, Daniel R Caffrey1, Anna C Salzberg1 & Enoch S Huang1 Lead generation is a major hurdle in small-molecule drug discovery, with an estimated 60% of projects failing from lack of lead matter or difficulty in optimizing leads for druglike properties. It would be valuable to identify these lessdruggable targets before incurring substantial expenditure and effort. Here we show that a model-based approach using basic biophysical principles yields good prediction of druggability based solely on the crystal structure of the target binding site. We quantitatively estimate the maximal affinity achievable by a drug-like molecule, and we show that these calculated values correlate with drug discovery outcomes. We experimentally test two predictions using high-throughput screening of a diverse compound collection. The collective results highlight the utility of our approach as well as strategies for tackling difficult targets. An estimated 60% of small molecule drug discovery projects fail in hitto-lead because the biological target is found to be not ‘druggable’1. This is a combined attrition due to lack of lead matter from screening and difficulty in optimizing lead matter to yield reasonable drug leads. By some estimates, only 10% of genes in the human genome are druggable, and only 5% are both druggable and relevant to disease2. These numbers are for ‘druggability’ defined as the likelihood of modulating a target by oral small-molecule drugs. Although other delivery approaches, such as injection or inhalation, have demonstrated success against targets that are considered difficult for orally bioavailable drugs, most industry efforts continue to focus on oral delivery owing to ease of dose administration and the potential to treat disease by modulating intracellular and central nervous system targets. High-throughput screening of new targets is costly; thus the ability to assess targets for their probability of success in advance of experimental screening can help reduce the high failure rate and cost of drug discovery. The most common approach to estimating druggability is to classify targets by whether they belong to gene families known to be druggable, such as G protein–coupled receptors or kinases2. However, gene families not known to be druggable have yielded novel targets through genomics
efforts, and not all members of a given gene family are equally druggable3. Here we show that a binding-free-energy model combined with recently discovered parameters for drug-like properties allows us to predict well the druggability of pharmaceutical targets based solely on binding-site structure. Conceptually, our model estimates the maximal achievable affinity for a binding pocket from a hit-to-lead optimization effort, given the constraint that the lead must have certain drug-like properties consistent with passive oral bioavailability. The presence of a cleft or pocket on a biological target is, in general, necessary but not sufficient for modulation by drug-like small molecules. Although protein-protein interactions are generally considered undruggable, the recent case of the MDM2/p53 interaction inhibitors4 indicates that this is not always the case. We thus ventured to build a model for the druggability of a binding site based solely on the binding site’s physiochemical properties. We started with two principles. The first is that orally bioavailable drugs have distinct physiochemical property ranges. Recent work has shown that passively absorbed oral drugs tend to fall within fixed ranges of size (≤500 Da) and polar surface area (≤140 Å2)5–7. In addition, such drugs rarely have more than one formal charge because only neutral molecules passively diffuse across membranes8. The
700 600
Protein SASA (Å2)
© 2007 Nature Publishing Group http://www.nature.com/naturebiotechnology
A N A LY S I S
500 400 300 200 100 0 0
200
400
600
800
1,000
1,200
Ligand molecular weight (Da) 1Departments
1Molecular
2Biological
of Informatics and Sciences, Research Technology Center, Pfizer Global Research & Development, Cambridge, 3 Massachusetts 02139, USA. Present address: Amgen Inc., One Kendall Square Bldg. 1000, Cambridge, Massachusetts 02139, USA. Correspondence should be addressed to A.C.C. (
[email protected]). Published online 8 January 2007; doi:10.1038/nbt1273
NATURE BIOTECHNOLOGY VOLUME 25 NUMBER 1 JANUARY 2007
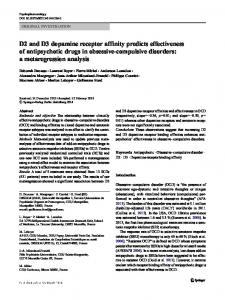
Figure 1 Ligand molecular weight correlates with protein-binding pocket surface area. A 500-Da ligand corresponds to about 300 Å2 on the protein surface. Data measured from a diverse set of 305 protein-ligand co-crystal structures from CCDC/Astex31. The correlation is r2 = 0.77. SASA, solventaccessible surface area.
71
A N A LY S I S
where ∆Gdesolvation terms represent release of water upon binding from the target binding site and part of the ligand. Other binding-energy components include van der Waals and electrostatic interaction energies, and changes in translational, rotational and vibrational entropies, which we treat simply as a constant contribution, ∆Gconstant , to the maximal affinity predicted for a passively absorbed oral drug (MAPPOD). This is a reasonable approximation because we are considering binding of drug-like molecules similar in size (~500 Da) and number of charges (rarely more than one formal charge). A simple model for desolvation is ∆Gdesolvation = –γ • A (ref. 10), where γ is related to solvent surface tension, and A is the relevant solvent-accessible surface area (SASA). It has been argued that polar surfaces make little contribution to the hydrophobic effect11. Equation (1) can then be written:
For small ligands, a constant γ constant = 24 cal/mol/Å2 is well accepted10. For larger surfaces, a γ dependent on the curvature of the surface, r, is thought to be more appropriate12–14. This curvature-dependent model for hydrophobic desolvation has been applied to convex surfaces such as alkanes12, and here we apply it to concave surfaces found in ligandbinding pockets. The γ (∞) term in the model represents the hydrophobic desolvation of a flat surface12,15. The model does not have an explicit polar desolvation term, but we implicitly use the argument that electrostatic interaction and desolvation energies for a charged group act in opposition, and the combination of the two generally provides only an insubstantial contribution16 to drug-like maximal affinity. Because ∆GMAPPOD becomes more favorable with increasing ligand size, normalization for molecular size is necessary for comparisons. We found an
HIV integrase
104
Calculated druggability (nM)
© 2007 Nature Publishing Group http://www.nature.com/naturebiotechnology
second is that the target binding site has a maximal achievable noncovalent binding affinity9 for drug-like compounds, and that this affinity can be calculated based on our current understanding of the molecular driving forces for binding. We model the variation in maximal achievable binding energy for an optimized drug-like molecule as largely due to desolvation:
Neuraminidase HIV RT (nucleoside) PBP2x IMPDH ACE1
103
2
10
ICE1 PTP1b Cathepsin K p
Factor X HMG CoA reductase 10
1
0.1
fCyp 51 CDK PDE-4D
PDE-5 COX-2 0.01 cAbl kinase
DNA gyrase Aldose reductase EGFR HIV protease Acetylcholinesterase Enoyl reductase p38 kinase MDM2/p53
Thrombin
HIV RT (NNRTI) Druggable
Undruggable
Prodrug/transporter Difficult
72
approximately linear correlation between ligand molecular weight and binding-site surface area, which allows us to normalize the total SASA of the protein pocket, , to a drug-like size, , representing a compound of ~500 Da in molecular weight (see Fig. 1 for details):
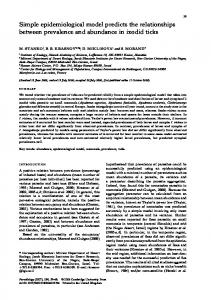
where the constant, C, includes the ligand desolvation component under the approximation that in equation (2) is a constant. In this work, we convert ∆GMAPPOD values to Kd values more commonly used in drug discovery by using the equation, , where R is the gas constant and the temperature, T, is 298 K. To implement the theory, we used computational geometry methods17,18 to represent the binding site and accurately calculate the necessary quantities of curvature and surface area from three-dimensional crystal structures. The model requires a structure of the bound-pocket conformation, but the observed ligand is not usually the maximal affinity ligand. In fact the ligands used in this study include bound peptides and substrate mimetics. The parameters γ (∞) and C remain undefined. To determine a value for γ (∞), we initially set C to zero and looked for differentiation on a set of eight crystal structures (listed in Methods) representing targets that range in experimental druggability. We empirically found that values of γ (∞)= 45 cal/mol/Å2 and C = 0 largely discriminate druggable from undruggable targets. We note that the model itself is physically derived, and that the γ (∞) value we find is nearly identical to an experimentally measured value15, whereas the value of zero for C can be explained but requires further investigation (see comments in Supplementary Methods online). We next applied the method to 63 structures representing 27 pharmaceutical targets (listed in Supplementary Table 1 online), including 23 targets with marketed drugs and four ‘undruggable’ targets that have been pursued extensively by multiple pharmaceutical companies with little success. We refer to the four targets as ‘undruggable’, although we recognize that it is always possible that a drug-like small molecule may eventually be discovered. We found that all ‘undruggable’ targets in our data set have calculated druggability scores of Kd > 100 nM, but the ones for druggable targets span a wide range, from 0.005 to 2,000 nM. Although druggable targets tend to have more favorable MAPPOD values, this discrimination did not appear at first to be useful for making decisions on target prosecution. However, further study of the five druggable targets scoring in the ‘undruggable’ target range found that the known drugs for these targets are highly polar and not passively absorbed, and instead require administration as prodrugs or the use of active transporter mechanisms. In fact, the major drugs for neuraminidase, inosine monophosphate dehydrogenase (IMPDH), angiotensin-converting enzyme 1 (ACE-1) and the nucleotide site of HIV reverse transcriptase (HIV RT) are all Figure 2 Calculated druggability for a set of 27 target binding sites. Known druggable protein targets are shown on the left vertical, whereas known difficult targets (prodrug and “undruggable”) are shown in the right verticals. Difficult and druggable target binding sites are effectively separated by the gray bar. The predicted druggability is the MAPpod score calculated from the protein-ligand binding site structure. HMG-CoA, 3-hydroxy-3-methylglutarylCoA; EGFR, epidermal growth factor receptor kinase; CDK, cyclin-dependent kinase 2; PDE, phosphodiesterase; COX, cyclooxygenase; HIV RT, HIV reverse transcriptase; PBP2x, penicillin binding protein 2x; IMPDH, inosine monophosphate dehydrogenase; ACE-1, angiotensin-converting enzyme 1; ICE1, interleukin-1β-converting enzyme 1; PTP1b, phosphotyrosine phosphatase 1B.
VOLUME 25 NUMBER 1 JANUARY 2007 NATURE BIOTECHNOLOGY
A N A LY S I S c
104
MAPPOD(nM)
NNRTI (4) PDE-5 (2) Enoyl reductase (2) PDE-4D (4) CDK-2 (6) fCyp 51(2) AChE (2) HIV Protease (4) Aldose reductase (3) DNA gyrase (2) HMG CoA (6) Cathepsin K (2) PTP-1b (5) Neuraminidase (5)
102
HMG CoA red
1
cAbl kinase
0.01
0.001
0.01
0.1
1
10
102
103
0.01
104
102
1
104
Best-known affinity (nM)
MAPPOD(nM)
b Druggable
10
5
0 10
Difficult
© 2007 Nature Publishing Group http://www.nature.com/naturebiotechnology
a
5 Thrombin 0 0.4
0.6
0.8
Fraction hydrophobic SASA
1.0
6
8
10
Curvature (Å)
>12
4
8
12
16
Figure 3 MAPpod score comparisons. (a) Variation in druggability predictions. Bars represent the median computed druggability of the target-binding sites. Range bars indicate the minimum and maximum predicted affinities (these are the full ranges, not the s.d.). Aldose reductase in the data set has a large variation in predictions, but the range does not affect its druggability classification. (b) Histograms of fraction hydrophobic SASA, pocket curvature and predicted druggability values for druggable and difficult (prodrug and ‘undruggable’) targets. Thrombin, which is poorly predicted by this method, is identified in the right hand histograms for predicted druggability. Histograms generated using Matlab 7.0.4 (Mathworks). (c) Correlation of predicted maximal achievable drug-like affinity with bestknown affinity. The y-axis represents predicted affinities from our study, and the x-axis represents the lowest known affinity for a druglike compound. Some error is expected because the data is composed of a mix of IC50s, Kds and Kis. Details of the data for lowest known affinity are available in Supplementary Table 2 online.
Calculated druggability (kcal/mol)
administered as prodrugs. In the case of penicillin-binding protein (PBP2x), the β-lactam drugs are covalent inhibitors, and most if not all are also administered as prodrugs or are substrates of peptide transporters (see Supplementary Table 1 online for details). Most of the prodrugs for the five targets are ester versions of the acid compound, where the acid is required for chelating an active-site Zn2+ or Mg2+, and in effect the prodrug moiety is used to mask the acid for increased oral absorption19. In the case of the neuraminidase drug oseltamavir (Tamiflu), the prodrug hides a carboxylic acid that forms multiple salt-bridges to three different arginine guanidinium groups20, whereas with HIV RT nucleotide inhibitors, the prodrugs are nucleoside mimetics that are phosphorylated in vivo. Although our method classifies these targets in the undruggable range because it does not account for strong charge interactions or metal chelation, the chemical functionalities required for such interactions are also not conducive to passive oral bioavailability. Prodrugs substantially complicate drug development and are avoided when possible, and it is difficult to design for the use of active transporters because transporter selectivity is not well understood8. Thus, the five targets with marketed drugs predicted to have weaker than 100 nM MAPPOD affinities are in fact difficult targets with the current state of the art. Further dividing the druggable set into those requiring prodrug or active transport mechanisms and plotting the calculated maximal achievable drug-like affinities (MAPPOD values) of the 27 targets results in the plot in Figure 2. The gray horizontal bar indicates separation of the druggable and difficult druggability targets at 70–100 nM. Despite the simplicity of our biophysical model we are able to achieve surprisingly good discrimination. The one target incorrectly predicted here is thrombin, where the method classifies it in the druggable range but substantial effort has, to our knowledge, resulted in only prodrugs passing phase 2 clinical trials. To estimate the error range of the calculations due to variation in binding mode and structural accuracy, we analyzed multiple cocrystal structures for 14 of the targets, selecting diverse cocrystallized ligands when possible (see Fig. 3a). The mean variation (maximum minus minimum values) in MAPPOD values is 0.9 kcal/mol, with a 99% statistical confidence interval of ±0.5 kcal/mol calculated from a two-tailed t-test. This is equivalent to a tenfold or less variation in predicted Kd. Thus, analysis
NATURE BIOTECHNOLOGY VOLUME 25 NUMBER 1 JANUARY 2007
of multiple cocrystal structures suggests that the druggability calculations are reasonably robust to small variations such as side-chain conformation changes. Binding sites undergo conformational change to differing extents to achieve their bound conformations, and this variation is not explicitly captured here. The current method is meant to address only the specified binding site and does not take into account the possibility of substantial flexibility or inhibition at allosteric pockets, both of which are important considerations in drug design21–23. The two variable properties in the model are curvature and hydrophobic surface area of the binding pocket. To determine how well each property discriminates between druggable and difficult, we generated histograms for each set of targets in Figure 3b. There is a clear trend toward higher fraction hydrophobic SASA and lower radius of curvature (binding site is more curved) for druggable targets, and there is greater overlap of the curvature distributions between the sets, suggesting that hydrophobicity by itself is a better discriminator. The combination of the two using the model, however, yields a substantially better discrimination than either property alone. Very recent data-mining studies using a large number of binding-site descriptors to discriminate small molecule-binding pockets from other pockets arrived at similar conclusions24,25. To address whether the calculated affinity values are quantitatively meaningful, we compared MAPPOD values for 11 targets with the affinities of the most potent known drug-like compounds (see Supplementary Table 2 online for details). The identified experimental maximal affinity values are likely close to the true values given the substantial effort invested into small-molecule inhibitors for these targets. However, these values must be considered approximate due to the differences in assays used and the uncertainty over whether these are the true maximal affinity values. Nevertheless, Figure 3c suggests a reasonable linear correlation for the predicted and estimated experimental maximal-binding affinities. There are two outliers, HMG-CoA reductase and cAbl kinase. In the case of cAbl kinase, selectivity was likely more important than affinity for Gleevec, and a more potent (IC50 < 1 nM) but less selective analog has recently entered clinical trials26. In the case of HMG-CoA reductase, the predictions are three log orders greater than the best known drug affinity of 0.1 nM. This is likely due to underestimation of the contribution of electrostatic interactions, as statins have a conserved glutaminyl group
73
A N A LY S I S
© 2007 Nature Publishing Group http://www.nature.com/naturebiotechnology
MAPPODKD
Fungal HSD
H-PGDS
240 nM
30 nM
Primary HTS hits
16
200
Compounds with IC50 ≤ 5 µM
2
33
Compounds with IC50 ≤ 1 µM
0
11
Figure 4 Predictions and screening results for two novel targets using a diverse set of 11,000 compounds. MAPpod affinity scores for fungal homoserine dehydrogenase (HSD) and hematopoietic prostaglandin D synthase (H-PGDS) calculated using available crystal structures (PDB IDs: 1EBU and 1PD2, respectively). A set of compounds designed to be a diverse representation of known compound space were screened to find inhibitors of HSD and H-PGDS. High-throughput screening was performed at 20 µM compound concentration using duplicate measurements for each compound. Raw hits were selected based on hits meeting a 60% inhibition cutoff and significance of P ≤ 0.05. Assay details available in the Methods section. The binding site surface of each target is shown and is based on the available crystal structures. Analytic Connolly surfaces are generated using MOE (version 2004.03; Chemical Computing Group) and is colored green for hydrophobic, blue for polar and red for solvent exposed.
that makes numerous hydrogen-bond and ion-pair interactions to the protein27. Statin compounds, however, are all highly polar, with the top selling statins (atorvastatin, rosuvastatin and simvastatin) having polar surface areas between 150 and 174 Å2, which is considerably higher than the drug-like range of