Structure in the Enron Email Dataset. P.S. Keila and D.B. Skillicorn. School of Computing. Queen's University. {keila,skill}@cs.queensu.ca. Abstract.
Structure in the Enron Email Dataset P.S. Keila and D.B. Skillicorn School of Computing Queen’s University {keila,skill}@cs.queensu.ca
Abstract We investigate the structures present in the Enron email dataset using singular value decomposition and semidiscrete decomposition. Using word frequency profiles we show that messages fall into two distinct groups, whose extrema are characterized by short messages and rare words versus long messages and common words. It is surprising that length of message and word use pattern should be related in this way. We also investigate relationships among individuals based on their patterns of word use in email. We show that word use is correlated to function within the organization, as expected. We also show that word use among those involved in alleged criminal activity may be slightly distinctive. 1
Introduction
Many countries intercept communication and analyze messages as an intelligence technique. The largest such system is Echelon [?], run jointly by the U.S., Canada, U.K, Australia, and New Zealand. The standard publicly-acknowledged analysis of intercepted data is to search messages for keywords, discard those messages that do not contain keywords, and pass those that do to analysts for further processing. An interesting question is what else can be learned from such messages; for example, can connections between otherwise innocuous messages reveal links between their senders and/or receivers [12]. The Enron email dataset provides real-world data that is arguably of the same kind as data from Echelon intercepts – a set of messages about a wide range of topics, from a large group of people who do not form a closed set. Further, individuals at Enron were involved in several apparently criminal
activities. Hence, like Echelon data, there are probably patterns of unusual communication within the dataset. Understanding the characteristics and structure of both normal and abnormal (collusive) emails therefore provides information about how such data might be better analyzed in an intelligence setting. Linguistically, email has been considered to occupy a middle ground between written material, which is typically well-organized, and uses more formal grammatical style and word choices; and speech, which is produced in real-time and characterized by sentence fragments and informal word choices. Although the potential for editing email exists, anecdotal evidence suggests that this rarely happens; on the other hand, email does not usually contain the spoken artifacts of pausing (Ums etc.). We examine the structure of the Enron email dataset, looking for what it can tell us about how email is constructed and used, and also for what it can tell us about how individuals use email to communicate. 2
Related Work
Previous attention has been paid to email with two main goals: spam detection, and email topic classification. Spam detection tends to rely on local properties of email: the use of particular words, and more generally the occurrence of unlikely combinations of words. This has been increasingly unsuccessful, as spam email has increasingly used symbol substitution (readable to humans) which makes most of its content seem not to be words at all. Email topic classification attempts to assist
users by automatically classifying their email into different folders by topic. Some examples are [2, 6, 9, 11]. This work has been moderately successful when the topics are known in advance, but perform much less adequately in an unsupervised setting. An attempt to find connections between people based on patterns in their email can be found in [7]. 3
Matrix Decompositions
We will use two matrix decompositions, Singular Value Decomposition (SVD) [3], and SemiDiscrete Decomposition (SDD) [4, 5]. Both decompose a matrix, A, with n rows and m columns into the form A = CW F
first k columns of U can be interpreted as the coordinates of a point corresponding to each row of A in a k-dimensional space, and that this is the most faithful representation of the relationships in the original data in this number of dimensions. The correlation between two objects is proportional to the dot product between their positions regarded as vectors from the origin. Two objects that are highly correlated have a dot product (the cosine of the angle between the two vectors) that is large and positive. Two objects that are highly negatively correlated have a dot product that is large and negative. Two objects that are uncorrelated have dot product close to zero. This property is useful because there are two ways for a dot product to be close to zero. The obvious way is for the vectors concerned to be orthogonal. However, when m is less than n (as it typically is) there are many fewer directions in which vectors can point orthogonally than there are vectors. Hence if most vectors are uncorrelated, they must still have small dot products but cannot all be orthogonal. The only alternative is that their values must be small. Hence vectors that are largely uncorrelated must have small magnitudes, and the corresponding objects are placed close to the origin in the transformed space. Hence, in a transformed space from an SVD, the points corresponding to objects that are ‘uninteresting’ (they are correlated either with nothing or with everything) are found close to the origin, while points corresponding to interesting objects are located far from the origin (potentially in different direction indicating different clusters of such objects). The SemiDiscrete Decomposition (SDD) of a matrix A is A = XDY
where C is n×k, W is a k×k diagonal matrix whose entries indicate the importance of each dimension, and F is k × m. There are several useful ways to interpret such a decomposition. The factor interpretation regards the k rows of F as representing underlying or latent factors (and hence better explanations of the data) while the rows of C describe how to mix these factors together to get the observed values in A. The geometric interpretation regards the k rows of F as representing axes in some transformed space, and the rows of C as coordinates in this (k-dimensional) space. The layer interpretation relies on the fact that A is the sum of k outer product matrices, Ai , where each Ai is the product of the ith column of C and the ith row of F (and the ith diagonal element of W ). All of these interpretations can be helpful in interpreting a dataset. Singular value decomposition is usually interpreted using the factor model (in the social sciences) and the geometric model (in the sciences). where the entries of X and Y come from the set {−1, 0, +1}, D is a diagonal matrix, and k can An SVD for the matrix A is have any value, not necessarily less than m. The 0 natural interpretation of SDD is a layer one [8]. A = USV Each Ai corresponds to a column of X and a row where U and V are orthonormal, the diagonal of of Y , weighted by an entry from D. The product of S is non-increasing, and k ≤ m. The usefulness xi and yi is a stencil representing a ‘bump’ (where of SVD comes primarily from the fact that the the product has a +1) and corresponding ‘ditch’ columns of V are orthogonal and hence represent (where the product has a −1). The corresponding independent factors, or orthogonal axes. The value of D gives the height of the bump and ditch
at each level. Hence an SDD expresses a matrix as the sum of bumps, with the most significant bumps appearing first. Because the choice of the sequence of bumps depends on both their area (how many locations in the matrix they cover) and their height, altering the scale of A will change the resulting SDD. In particular, taking the signed square of each value in the matrix will give greater emphasis to the heights of bumps and hence select outlying regions of the dataset earlier. Conversely, taking the signed square root of each value in the matrix will tend to find large homogeneous regions earlier. SDD generates a ternary, unsupervised hierarchical classification of the samples, based on the values in each successive column of the X matrix. Consider the first column of X. Those samples for which this column has the value +1 can be grouped; those samples for which this column has the value −1 are, in a sense, similar but opposite; and those samples for which this column has the value 0 are unclassified at this level. This can be repeated for columns 2, 3, and so on, to produce a classification tree. Neither SVD nor SDD exploit the order of rows and columns in the data matrix, so they do not start with any advantage over more conventional data-mining techniques. 4
Structure from Word Usage
Most emails contain few words from the possible vocabulary, so a word-document (word-email) matrix is extremely sparse. Although SVD could be performed on such matrices using sparse matrix techniques such as Lanczos methods, we chose instead to analyze matrices whose rows correspond to emails and whose columns correspond to frequency in the email. The entries in the matrix are the (global) ranks of words in frequency order in the message. For example, if the most frequent words in an email is “stock” and this word ranks 12,000th overall in the Enron noun frequency list, then the entry in the row corresponding to that email and the first column of the matrix is 12,000. Two emails are similar in this representation if they have similar word usage profiles in descending order of frequency; in other words, the similarity metric is more discriminating than one based only
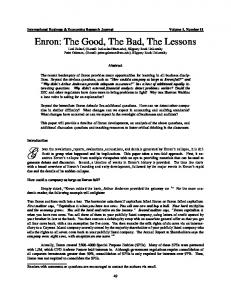
on a bag-of-words similarity metric. Basic Structure An SVD analysis of the entire email dataset is shown in Figure 1, based on 494,833 messages using 160 203 distinct words (no stemming has been applied).
Figure 1: SVD plot of entire email set of 494,833 messages. Note the strong bifurcation. The most obvious and striking feature of this plot is that it results in a ‘butterfly’ shape, that is the emails separate into two clusters that grow increasingly different with distance from the origin. This separation is quite surprising; as far as we are aware previous analysis of email datasets has revealed separation by topic, but not such as strong structural separation. This structure remains more or less fixed as the set of nouns is reduced, indicating that it is not an artifact of particular choice of nouns under consideration. To explore the structure of the dataset more deeply, we reduced the number of words under consideration by removing those we believed made the least contribution to interesting structure. We used the BNC corpus [1], which is a frequencyranked list of words in both spoken and written English to assist. We first removed words that appear in the Enron dataset but not in the BNC corpus. This removes almost all of the strings that are not real words (artifacts of email processing and also of postprocessing of the dataset); and
also almost all of the proper names and acronyms. We also removed words that were very frequent (appeared more than 1000 times in the dataset) and very infrequent (appeared fewer than 20 times in the dataset). Reducing the set of words removes some emails entirely. Figure 2 shows the SVD plot for this reduced dataset. As expected, the ‘less interesting’ emails are the ones that disappear, and a secondary structure begins to appear. The two ‘wings’ reduce to borders, and there are marked extensions that extend into the page on the left wing and out of the page on the right – in other words, the overall shape becomes a spiral. We reduced the word set further by retaining only words whose frequency of use in the email dataset is greater than their frequency of use in English (as recorded in the BNC corpus). This restricts attention to the 7424 words that Enron people use to communicate amongst themselves more than the general population. We call this Enronspeak, the normal patterns of utterance within the organization.
0.02 0.015 0.01
U3
0.005 0 −0.005 −0.01 −0.015 −0.02 −0.01
0.02 −0.005
0.01 0
0.005
0 0.01
0.015
spiral shape is now very pronounced.
Figure 3: SVD plot of 289,695 emails, when the word set is reduced further by removing words whose frequency is greater in Enron email than in the BNC corpus (Enronspeak) – a set of 7424 words. The reason for the strong bifurcation of emails is not clear. In general, the left hand ‘wing’ consists of messages with few distinct nouns; the emails near the origin are messages with a moderate number of distinct nouns, and the right hand ‘wing’ consists of messages with many distinct nouns. Recall that distance from the origin is a surrogate for interestingness, at least with respect to correlation structure. This spiral shape shows that there are three ways for an email to be uninteresting:
−0.01 0.02
0.025
−0.02 U2
U1
Figure 2: SVD plot of 350,248 emails, when the word set is reduced by (a) removing all words that appear in the Enron emails but not in the BNC corpus, and (b) removing all words with frequency greater than 1000 or less than 20. This further reduces the number of email messages. An SVD plot is shown in Figure 3. The
1. It contains very few distinct words (the sharp spike at the back of the left hand wing, which ends up quite near the origin); 2. It is of moderate size and uses words in ordinary ways (the region near the origin); 3. It is very long, and contains so many different nouns that it correlates with many of the other emails (the sharp spike at the front of the right hand wing which also ends up quite near the origin).
16
14
12
10
Frequency
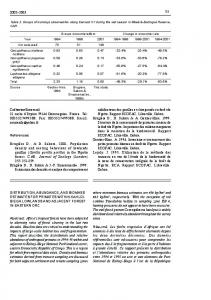
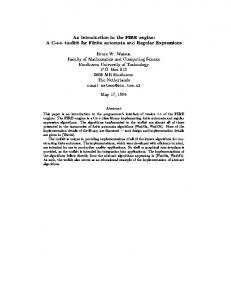
The remaining extremal emails are those that have the most interesting correlational structure. Words on the right wing use more nouns altogether, and so have greater opportunities for interesting correlation, whereas nouns on the left wing use few nouns and so have fewer opportunities. Hence the butterfly structure is quite asymmetric, with the right wing much larger and further from the origin than the left. Figure 4 shows the word frequency profile for a typical extremal message on the left wing. Figure 5 shows the word frequency profile for an extremal message on the right wing.
8
6
4
2
0 1
0
1000
2000
3000
4000 Noun rank
5000
6000
7000
8000
0.9
0.8
Figure 5: Noun frequency distribution for a typical extremal message on the right wing.
0.7
Frequency
0.6
0.5
0.4
0.3
0.2
0.1
0
0
1000
2000
3000
4000 Noun rank
5000
6000
7000
8000
with position along the spiral. Figure 7 shows that infrequent words are much more likely to occur at the left hand end, and frequent words to occur at the right hand end. Hence, message length is, at least to some extent, inversely correlated with rareness of words used.
Figure 4: Noun frequency distribution for a typical extremal message on the left wing. Extremal emails on the left wing can be characterized as: having been composed by a single author, short (in Enronspeak, although potentially containing many ordinary words), and tending to use each noun only once. Extremal emails on the right wing can be characterized as: coming from outside Enron, either digests with many different topics (sports updates, general news) or emails that reference many proper names, long (containing 100-350 Enronspeak nouns), and having more Figure 6: SVD plot labelled by message length typical word frequency (Zipf-like) profiles. Figures 6 and 7 show the way in which other (magenta: < 20 nouns; black: < 70 nouns) properties correlate with position in the SVD plot. Figure 6 shows that message length correlates well Figure 8 shows the relationship between emails
Figure 7: SVD plot labelled by average noun Figure 8: SVD plot labelled by email senders from frequency rank (magenta: > 14,000; black: > the CPC. Magenta circle: Delaney; black circle: 8000). Derrick; red circle: Horton; blue circle: Kean; green circle: Lay; cyan circle: Skilling; magenta and their senders. The Corporate Policy Com- star: Whalley. mittee (CPC) consisted of 15 influential executives at Enron. These executives included the CEO, Chairman, Vice-Chairman, CFO, CAO, a number of heads from different Enron divisions, and an in-house lawyer. One member from this committee has since committed suicide, four have been charged and found guilty of various accounting and securities frauds, and three have been indicted. The figure shows the distribution of emails for those members of the committee whose emails remain in the dataset. Kean was responsible for circulated summaries of references to Enron in the media, and this explains his unusual email profile and relationships. Figure 9 shows that the interestingness of an email (measured by distance from the origin) peaks for messages with about 220 total nouns, dropping to an asymptote for longer messages. This is Figure 9: Plot of interest (i.e. distance from the surprising, since these messages contain several origin in an SVD plot) versus total number of nouns thousand words. in the message. 5
Authors and Emails
We now consider the matrix whose objects are individuals and whose columns are word frequency, aggregated over all of their emails in the dataset. Hence each row captures a characteristic word use
pattern for an individual. More interestingly, correlation in word use patterns determines position in an SVD plot, so that individuals with similar patterns will be placed close together. We might
expect that individuals with similar job responsibilities and similar rank might use words in similar ways, both because of writing style, and because of similarity in typical subject matter. Further details of participants and their situation within Enron can be found in [10].
0.6
0.4
U3
0.2
0 0.4 −0.2 0.2 −0.4 −0.4
0.6
0 −0.3
−0.2
−0.1
0
−0.2 0.1
0.2
0.4
0.3
0.4
U2
−0.4
U1
U3
0.2
0 0.4 0.3
−0.2
−0.4 −0.4
0.2
−0.3
−0.2
−0.1
0
0.1
0.2
0.3
0.4
0.1 0 −0.1 −0.2 −0.3 U2 −0.4
Figure 11: Relationships among 30 most interesting individuals. Labelling as in Figure 10
U1
0.6 0.5 0.4 0.3 0.2
U3
Figure 10: Relationships among 150 individuals based on similarity of email word use. Magenta: VP (diamond), President (circle); Black: CEO; Green: Director; Blue: Trader; Red: Manager; Cyan: Lawyer; Yellow: Unknown/Other. In this and subsequent figures, a set of 1713 words used by no more than 15 people are used.
0.1 0 −0.1 −0.2
0.2 −0.4 −0.4
Figure 10 shows an SVD plot with a point for each individual in the dataset. The basic structure is a T-shape, with Vice-presidents along one arm towards the bottom right, and traders and other managers towards the bottom left. Core figures in the company tend to appear close to the center. We can further restrict our attention to the individuals whose distance from the origin in the SVD plot is greater than the median distance. This leaves 30 individuals, including most of those with a significant role in the organization. Figure 11 shows the SVD plot of the 30 most interesting individuals. Figure 12 shows the same plot, but with the points labelled by their SDD classification. Note how the (unsupervised) clustering properly distin-
0.4
−0.3 0 −0.3
−0.2
−0.1
0
−0.2 0.1
0.2
0.3
0.4
−0.4
U2
U1
Figure 12: Relationships among 30 most interesting individuals, labelled by SDD classification. guishes the functional properties of these individuals. Note also that the SDD labelling agrees, in general, with the positional similarities from SVD. We can also add weights to certain rows and columns in the raw data. This has the effect of moving them away from the origin, and hence making them seem more important – but it also tends to cause correlated objects or attributes to
0.1
0.08
0.06
0.04
0.02
U2
follow them. We experiment with this by increasing the weight on words used by Lay and Skilling by a factor of 1.4. The result is shown in Figure 13. The effect is to begin to partition the entire set of words into two clusters, one perhaps corresponding to the language of senior executives, and the other to the language of ordinary organization members.
0 0.08 −0.02 0.06 −0.04 0.04 −0.06 0.02 −0.08 −0.06
−0.04
−0.02
0
0.02 U1
0.04
0.06
0.08
0.1
U2
0
−0.02
−0.04
−0.06
−0.08
−0.1 −0.1
−0.08
−0.06
−0.04
−0.02
0 U1
0.02
0.04
0.06
0.08
0.1
Figure 14: SDD labelled plot of words, weighting emails from Lay and Skilling by 2. The clusters at the top and right are words used disproportionately by Lay and Skilling; The cluster at the left is words that are rare; the cluster at the bottom is words used by individuals on the CPC but not by Lay and Skilling.
Figure 13: SDD labelled plot of words, weighting emails from Lay and Skilling by 1.4. Whalley
Figure 15 plots the positions of individuals by word use, when the words used by Lay and Skilling are weighted by 1.4. Several other pairs of individuals move into closer proximity compared to Figure 11. This may reflect particular topics about which these pairs, as well as Lay and Skilling, exchanged emails.
0.5 0.4 0.3 0.2 0.1 Forney Derrick
0
Kaminski Lay
Bass
−0.1
Delainey −0.2
Skilling Kean
6
Conclusions
Using matrix decompositions such as singular value decomposition and semidiscrete decomposition, we have explored the structure of a large real-world email corpus. The structure of email messages, using similarity based on word use frequency profiles shows a distinctive butterfly/spiral pattern which we have not been able to fully account for. There appears to be a strong differentiation between short messages using rare (in this context) words, and long messages using more typical words. The characteristic length of the emails with the most inter-
1
−0.3 0.5 −0.4 −0.6
−0.4
0 −0.2
0
0.2
0.4
−0.5
Figure 15: SVD plot of individuals when words used by Lay and Skilling are weighted by 1.4. Lay and Skilling move closer together, but so do Bass and Delainey, and Forney and Derrick.
esting correlative structure seems surprisingly long. We also analyzed the relationships among individuals based on the word use frequency profiles of the emails they send. This showed a clear effect of company role on such relationships – individuals of similar status and role tend to communicate in similar ways. There are some hints that emphasizing certain words tends to pull together individuals who are not obviously associated in the company environment, but there may be several explanations for this behavior. References
[1] British National Corpus (BNC), 2004. www.natcorp.ox.ac.uk. [2] W.W. Cohen. Learning to classify English text with ILP methods. In L. De Raedt, editor, Advances in Inductive Logic Programming, pages 124–143. IOS Press, 1996. [3] G.H. Golub and C.F. van Loan. Matrix Computations. Johns Hopkins University Press, 3rd edition, 1996. [4] G. Kolda and D.P. O’Leary. A semi-discrete matrix decomposition for latent semantic indexing in information retrieval. ACM Transactions on Information Systems, 16:322–346, 1998. [5] T.G. Kolda and D.P. O’Leary. Computation and uses of the semidiscrete matrix decomposition. ACM Transactions on Information Processing, 1999. [6] D. Lloyd and N. Spruill. Security screening and knowledge management in the Department of Defense. In Federal Conference on Statistical Methodology, 2001. [7] R. McArthur and P. Bruza. Discovery of implicit and explicit connections between people using email utterance. In Proceedings of the Eighth European Conference of Computer-supported Cooperative Work, Helsinki, pages 21–40, 2003. [8] S. McConnell and D.B. Skillicorn. Semidiscrete decomposition: A bump hunting technique. In Australasian Data Mining Workshop, pages 75–82, December 2002. [9] C. OBrien and C. Vogel. Exploring the subject of email filtering: Feature selection in statistical filtering, submitted, 2004. [10] J. Shetty and J. Adibi. The Enron email dataset database schema and brief statistical report. Technical report, Information Sciences Institute, 2004.
[11] A.F. Simon and M. Xenos. Dimensional reduction of word-frequency data as a substitute for intersubjective content analysis. Political Analysis, 12:63–75, 2004. [12] D.B. Skillicorn. Detecting related message traffic. In Workshop on Link Analysis, Security and Counterterrorism, SIAM Data Mining Conference, pages 39–48, 2004.