Sep 27, 2007 - [28] Kohara S and Suzuya K 2003 Nucl. Instrum. Methods Phys. Res. ... [60] Neuefeind J and Liss K-D 1996 Ber. Bunsenges. Phys. Chem.
IOP PUBLISHING
JOURNAL OF PHYSICS: CONDENSED MATTER
J. Phys.: Condens. Matter 19 (2007) 415110 (22pp)
doi:10.1088/0953-8984/19/41/415110
Structure of glassy GeO2 Philip S Salmon1 , Adrian C Barnes2 , Richard A Martin1 and Gabriel J Cuello3 1 2 3
Department of Physics, University of Bath, Bath BA2 7AY, UK H H Wills Physics Laboratory, Royal Fort, Tyndall Avenue, University of Bristol, BS8 1TL, UK Institut Laue-Langevin, BP 156, F-38042, Grenoble C´edex 9, France
Received 5 May 2007, in final form 7 May 2007 Published 27 September 2007 Online at stacks.iop.org/JPhysCM/19/415110 Abstract The full set of partial structure factors for glassy germania, or GeO2 , were accurately measured by using the method of isotopic substitution in neutron diffraction in order to elucidate the nature of the pair correlations for this archetypal strong glass former. The results show that the basic tetrahedral Ge(O1/2 )4 building blocks share corners with a mean inter-tetrahedral Ge– ˆ O–Ge bond angle of 132(2)◦ . The topological and chemical ordering in the resultant network displays two characteristic length scales at distances greater than the nearest neighbour. One of these describes the intermediate range order, and manifests itself by the appearance of a first sharp diffraction peak in the ˚ −1 , while measured diffraction patterns at a scattering vector kFSDP ≈ 1.53 A the other describes so-called extended range order, and is associated with the ˚ −1 . We find that there is an interplay between principal peak at kPP = 2.66(1) A the relative importance of the ordering on these length scales for tetrahedral network forming glasses that is dominated by the extended range ordering with increasing glass fragility. The measured partial structure factors for glassy GeO2 are used to reproduce the total structure factor measured by using high energy x-ray diffraction and the experimental results are also compared to those obtained by using classical and first principles molecular dynamics simulations. (Some figures in this article are in colour only in the electronic version)
1. Introduction Germania (GeO2 ) is, like silica (SiO2 ), an archetypal ‘strong’ glass forming material, a taxonomy which stems originally from the Arrhenius temperature dependence observed for the liquid viscosity η and which can be usefully used to describe many of the generic properties of glass forming systems [1]. For strong liquids, a plot of ln η versus Tg /T gives a straight line, where T is the absolute temperature and Tg is the glass transition temperature, whereas large deviations from linearity are found for fragile liquids. Strong liquids, by contrast to their fragile counterparts, commonly show a small change of heat capacity at Tg corresponding to 0953-8984/07/415110+22$30.00 © 2007 IOP Publishing Ltd
Printed in the UK
1
J. Phys.: Condens. Matter 19 (2007) 415110
P S Salmon et al
a small change in the configurational entropy with temperature as the liquid solidifies into the glassy phase [2]. Computer simulation studies show quantitative differences between the potential energy landscapes of strong and fragile liquids that help to rationalize the experimental observations [3–6]. There is evidence to suggest that the concept of fragility can be related to the microscopic properties of a glass [7]. A correlation between the fragility of a glass forming liquid and the Poisson ratio of the corresponding glass has also been reported [8], although later work casts doubt on the reliability of this finding [9]. Strong liquids and glasses like GeO2 and SiO2 form network structures which eventually collapse with increasing density and there is often an accompanying increase in the number of structural configurations that can be adopted. For example, whereas the network of glassy GeO2 at ambient conditions is built predominantly from Ge-centred tetrahedral units, the Ge coordination number increases to six at higher pressures [10–13]. Strong systems tend to become more fragile with increase of density [4, 14, 15]. It is therefore important to understand the relation between the structure and relative fragility of glass forming systems. Detailed information on the former is, however, notable by its paucity, especially at length scales greater than the nearest neighbour which determine many important aspects of liquid and glass phenomenology [16]. Recently, progress has been made by employing the method of isotopic substitution in neutron diffraction to measure the full set of partial structure factors for two network forming AX2 glasses, namely GeSe2 [17, 18] and ZnCl2 [19]. By constructing the Bhatia–Thornton partial structure factors [20], the topological and chemical ordering was examined and at distances greater than the nearest neighbour, two length scales associated with the atomic ordering were identified [19]. One of these is associated with an intermediate range and manifests itself by the appearance in the measured ˚ −1 . diffraction patterns of a first sharp diffraction peak (FSDP) at a scattering vector kFSDP ≈ 1 A The other is associated with an extended range which has a periodicity given by ≈ 2π/kPP ˚ −1 . It is therefore crucial to understand where kPP is the position of the principal peak at ≈2.1 A how this ordering affects the system properties e.g. in the case of network forming ionic melts the density fluctuations relax much more slowly on length scales associated with the FSDP compared with the principal peak [21]. In particular, what distinguishes the structure of a strong glass such as GeO2 or SiO2 from that of ZnCl2 and GeSe2 which are much more ‘intermediate’ in character given that the dominant structural motif in all these systems is the A(X1/2 )4 tetrahedron? We have therefore taken advantage of advances in neutron diffraction instrumentation [22] to apply the method of isotopic substitution [23] to make the first accurate measurement of the full set of partial structure factors for GeO2 . Although these functions have previously been estimated for GeO2 , by combining one neutron diffraction pattern with two x-ray diffraction patterns measured using anomalous scattering, the results are prone to systematic error and, even in the most recent work, significant unphysical features can be identified [24–26]. For example, the published partial structure factors correspond to a negative measured intensity in the region of the FSDP [26] and the results have not allowed for a detailed investigation of the glass structure at distances beyond the nearest neighbour. The partial structure factors for glassy GeO2 have also been calculated from neutron and x-ray diffraction data by using reverse Monte Carlo modelling [27–29]. This modelling procedure tends, however, to produce the most disordered structure that is consistent with the data and imposed constraints [30] and, in the most recent work, only two diffraction patterns were used in the refinement procedure. The structure of amorphous, crystalline and liquid GeO2 has recently been reviewed by Micoulaut et al [31] and the use of germania glass for fibre optics is described by Dianov 2
J. Phys.: Condens. Matter 19 (2007) 415110
P S Salmon et al
and Mashinsky [32]. A preliminary account of the present work on glassy GeO2 is given elsewhere [33]. The manuscript is organized as follows. Firstly, the theory that is required to understand the experimental results is given, followed by the method of sample preparation and the neutron diffraction experimental procedure. Next, the neutron diffraction results, at both the first order difference function and partial structure factor levels, are presented. The structure of glassy GeO2 on different length scales is then discussed and, to help elucidate the interpretation of x-ray and neutron diffraction patterns taken under extreme conditions, the x-ray and neutron total structure factors are reconstructed by using the measured partial structure factors. The results for GeO2 are compared with those recently obtained by using classical [34–37] and first principles molecular dynamics simulations [38, 39]. Finally, the results are also compared with the structure of SiO2 , with the structure of glassy GeO2 under pressure, and with the structure of other tetrahedral network forming glasses such as ZnCl2 and GeSe2 . The comparison suggests that there is a competition between the ordering on the intermediate and extended length scales which is won by the extended range order with increasing glass fragility. 2. Theory In a neutron diffraction experiment on glassy GeO2 the coherent scattered intensity can be represented by the total structure factor [40] 2 2 F(k) = cGe bGe [SGeGe (k) − 1] + 2cGe cO bGe bO [SGeO (k) − 1] + cO2 bO2 [SOO (k) − 1]
(1)
where Sαβ (k) represents a Faber–Ziman [41] partial structure factor and cα , bα denote the atomic fraction and bound coherent scattering length of chemical species α , respectively. Let the diffraction patterns be measured for three samples denoted by nat GeO2 , 70 GeO2 and 73 GeO2 that are identical in every respect except for their Ge isotope composition, where nat denotes the natural isotopic abundance of germanium. The corresponding total structure factors, denoted by nat F(k), 70 F(k) and 73 F(k) respectively, can then be represented in matrix notation by � nat � � � �� F(k) 0.0744(4) 0.2111(5) 0.1497(2) SGeGe (k) − 1 70 (2) F(k) = 0.1097(21) 0.2563(25) 0.1497(2) SGeO (k) − 1 73 F(k) 0.0297(4) 0.1334(10) 0.1497(2) SOO (k) − 1 where the weighting coefficients of the Sαβ (k) are quoted in units of barns (1 barn = 10−28 m2 ) and were calculated by using b(70Ge) ≡ � bGe = 9.94(10), b(nat Ge) ≡ �� bGe = 8.185(20) and b(73 Ge) ≡ ��� bGe = 5.17(4) fm, which correspond to the isotopic enrichments used in the neutron diffraction experiment (see section 3), and bO = 5.803(4) fm [42]. By using two total structure factors it is possible to eliminate, for instance, the O–O correlations by forming a first order difference function such as (1) �FGe (k) = 70 F(k) − 73 F(k) 2 � 2 2 ( bGe − ��� bGe )[SGeGe (k) − 1] + 2cGe cO bO (� bGe − = cGe
���
bGe )[SGeO (k) − 1] (3)
where the Ge–Ge and Ge–O weighting factors take values of 0.080(2) and 0.123(3) barns, (2) (3) respectively. Equivalent expressions hold for �FGe (k) = 70 F(k) − nat F(k) and �FGe (k) = nat 73 F(k) − F(k). The full set of partial structure factors is obtained by inverting the scattering matrix given by equation (2) to give � � � � � nat � 62.8 F(k) SGeGe (k) − 1 −170.7 107.9 70 (4) SGeO (k) − 1 = 111.1 −62.1 −49.0 F(k) . 73 SOO (k) − 1 −65.2 33.9 37.9 F(k) A measure of the conditioning of this matrix is provided by its normalized determinant |An | = −0.006 [43]. This value compares, for example, with |An | = 0.011 for the experiment 3
J. Phys.: Condens. Matter 19 (2007) 415110
P S Salmon et al
of Petri et al [17, 18] on glassy GeSe2 in which the full set of Sαβ (k) were successfully measured by using the method of isotopic substitution in neutron diffraction. Extraction of the full set of partial structure factors for GeO2 is therefore more challenging than for GeSe2 . The partial structure factors are related to the partial pair distribution functions, gαβ (r ), through � ∞ 1 gαβ (r ) = 1 + dk k[Sαβ (k) − 1] sin(kr ) (5) 2π 2 n 0 r 0 ˚ −3 [44]) is the atomic number density of the glass. The total pair where n 0 (= 0.0629(3) A distribution function corresponding to equation (1) is therefore given by 2 2 G(r ) = cGe bGe [gGeGe (r ) − 1] + 2cGe cO bGe bO [gGeO (r ) − 1] + cO2 bO2 [gOO (r ) − 1]
(6)
and the real space difference function corresponding to equation (3) is given by 1) 2 � 2 �G (Ge (r ) = cGe ( bGe −
��� 2 bGe )[gGeGe (r )
− 1] + 2cGe cO bO (� bGe −
���
bGe )[gGeO (r ) − 1].
(7)
The mean number of particles of type β contained in a volume defined by two concentric spheres of radii ri and r j , centred on a particle of type α , is given by � rj β n¯ α = 4πn 0 cβ dr r 2 gαβ (r ). (8) ri
In practice, the measured reciprocal space data sets will be truncated at some finite maximum value kmax owing to the finite measurement window function M(k) of the diffractometer. In consequence, equation (5) needs to be modified and it is convenient to rewrite it as � 2 ∞ � dαβ (r ) = dk k[Sαβ (k) − 1]M(k) sin(kr ) = dαβ (r ) ⊗ M(r ) (9) π 0 where dαβ (r ) = 4πn 0r [gαβ (r ) − 1] and ⊗ denotes the one-dimensional convolution operator. The dαβ (r ) functions are then convoluted with a symmetrical M(r ) function. For example, the measurement window is usually represented by the step function M(k � kmax ) = 1, M(k > kmax ) = 0 whence M(r ) = kmax sinc(kmaxr )/π with sinc(x) ≡ sin(x)/x . Alternatively, the adoption of a Lorch [45] modification function M(k) = sin(ak)/(ak) where a = π/kmax gives � x M(r ) = [Si(π(r + a)/a) − Si(π(r − a)/a)]/2πa where the sine integral Si(x) ≡ 0 sin(t)/t dt [46]. Application of this modification function gives smoother pair correlation functions at all r values by comparison with the use of a step modification function but leads to a loss in resolution of the first peaks in r -space. A total structure factor can also be written in terms of the Bhatia–Thornton [20] number– number, concentration–concentration and number–concentration partial structure factors, denoted by SNN (k), SCC (k) and SNC (k) respectively, where
F(k) = �b 2 [SNN (k) − 1] + cGe cO (bGe − bO )2 [{SCC (k)/cGe cO } − 1] + 2�b (bGe − bO )SNC (k)
(10)
and �b = cGe bGe + cO bO is the average scattering length. If the scattering matrix of equation (2) is rewritten in terms of the Bhatia–Thornton S I J (k) (where I, J = N, C) then the corresponding normalized determinant |An | = 0.016 i.e. the conditioning of the Bhatia– Thornton partial structure factors is better than for the corresponding Faber–Ziman partial structure factors. The relationship between these two sets of partial structure factors is given by 2 SNN (k) = cGe SGeGe (k) + cO2 SOO (k) + 2cGe cO SGeO (k)
SCC (k) = cGe cO [1 + cGe cO (SGeGe (k) + SOO (k) − 2 SGeO (k))] SNC (k) = cGe cO [cGe (SGeGe (k) − SGeO (k)) − cO (SOO (k) − SGeO (k))]. 4
(11)
J. Phys.: Condens. Matter 19 (2007) 415110
P S Salmon et al
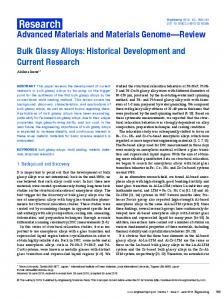
If bGe = bO then the incident neutrons in a diffraction experiment cannot distinguish between the different scattering nuclei and inspection of equation (10) shows that the measured total structure factor gives SNN (k) directly. The Fourier transform of SNN (k), the partial pair distribution function gNN (r ), describes the sites of the scattering nuclei, but does not distinguish between the chemical species that decorate those sites, and therefore gives information on the topological ordering in the glass. If �b = 0, however, the measured total structure factor will give SCC (k) directly. The Fourier transform of SCC (k), namely gCC (r ), describes the chemical ordering of the Ge and O atomic species. When there is a preference for like or unlike neighbours at a given distance, corresponding positive or negative peaks will appear in gCC (r ) respectively. The Fourier transform of SNC (k), namely gNC (r ), describes the correlation between the sites described by gNN (r ) and their occupancy by a given chemical species. A more complete description of 2:1 binary systems using the Bhatia–Thornton formalism is given elsewhere [47]. 3. Experimental procedure Germania glasses were made by heating ≈1.35 g of powdered nat GeO2 (99.9999%, Alfa Aesar), 70 GeO2 (97.22% enrichment) or 73 GeO2 (95.51% enrichment) contained in platinum crucibles (supported by an alumina crucible) at 1400 ◦ C. The crucibles were heated in air in order to minimize any change of sample stoichiometry which is increased if inert gas conditions are used [48]. After ≈2 h, the crucibles were removed from the furnace and placed on a copper block to cool to room temperature. The transparent, colourless samples are hygroscopic and were therefore stored under dry conditions. A sample of commercial silica of natural isotopic abundance was also chosen for investigation and the number density of this glass ˚ −3 . n 0 = 0.0665(2) A The diffraction experiments were made using the D4C instrument [22] at the Institut ˚ The Laue-Langevin (ILL), Grenoble, operating with an incident wavelength of 0.49991(2) A. samples were coarsely powdered and were held in a cylindrical vanadium container of 4.8 mm internal diameter and 0.1 mm wall thickness. Diffraction patterns were taken for the samples at 25(1) ◦ C in their container, the empty container, the empty instrument, and a cylindrical vanadium rod of diameter 6.35 mm for normalization purposes. Each diffraction pattern was built up by making repeated scans of the detectors over the available range of scattering angles. No deviations were observed between scans, apart from the expected statistical variations [49]. The intensity for a bar of neutron absorbing 10 B4 C with dimensions comparable to the sample was also measured to account for the effect of sample self-shielding on the background count rate at small scattering angles [50]. The data were carefully corrected to yield the total structure factor for each sample and the usual self-consistency checks were performed [18, 51]. 4. Results The measured total structure factors are illustrated in figure 1 and the corresponding total pair distribution functions are given in figure 2. As shown in these figures, good agreement is found with the previous measurements of Desa et al [52] who studied the total structure factor of nat GeO2 by using an earlier version of the diffractometer D4 at the ILL with an ˚ The results for the F(k) functions given in figure 1 show that incident wavelength of 0.5 A. as the scattering length of Ge decreases, the intensity of the first sharp diffraction peak at ˚ −1 ˚ −1 decreases whereas the intensity of the principal peak at kPP ≈ 2.67 A kFSDP = 1.53(2) A increases. The results for the corresponding G(r ) functions given in figure 2 show the extent to which the smoothing achieved by use of a Lorch modification function, relative to a step 5
J. Phys.: Condens. Matter 19 (2007) 415110
P S Salmon et al
F(k) (barn)
0.2
Total structure factor F(k) (barn)
1.2 1
0 nat
GeO2 (present work)
-0.2
nat
GeO2 (Desa et al)
0.8
0
5
10
20 15 -1 k (Å )
0.6 70
GeO2 (+ 0.6)
0.4 nat
0.2
GeO2 (+ 0.3)
0 73
-0.2 0
5
10
GeO2
15
-1
20
Scattering vector k (Å ) Figure 1. The measured total structure factors, F(k), for glassy GeO2 at 25(1) ◦ C. The solid circles give the data points and are larger than the statistical errors. The solid curves give the result of recombining the Sαβ (k) given by the solid (blue) curves in figure 5. The inset compares nat F(k) as measured in the present work (solid circles) with the results of Desa et al [52] (solid curve).
modification function, comes at the expense of a loss in resolution which can be readily ˚ discerned up to ≈5 A. ˚ −1 in the first order difference The FSDP remains as a prominent feature at ≈1.54 A (i) functions �FGe (see figure 3). This demonstrates that the intermediate ranged atomic ordering in GeO2 has a strong contribution from the correlations involving Ge atoms. The real space (1) difference function �G Ge is shown in figure 4. By comparison with the structure of crystalline ˚ will arise from Ge–O correlations and a fit to this peak, GeO2 [31] the first peak at 1.73(1) A taking the window function M(k) into account (see equation (9)), gives n¯ O Ge = 3.8(1). As will be shown by the full partial pair distribution function analysis of the data, the second and third 1) ˚ have a strong contribution from gGeGe (r ) and gGeO (r ) peaks in �G (Ge at 3.16(2) and 4.43(2) A respectively. The partial structure factors Sαβ (k) of figure 5 were obtained from the total structure factors F(k) of figure 1 by direct inversion of the scattering matrix (see equation (4)) which means that the total structure factors can be accurately reconstructed from the Sαβ (k) by using equation (2). The Sαβ (k) are of high statistical quality, fully satisfy the sum rule and inequality relations given by Edwards et al [43], and give rise to gαβ (r ) functions that oscillate about the correct low r limit of gαβ (r ) = 0. The Sαβ (k) are also in good agreement at all k values with the Fourier back-transforms of the corresponding gαβ (r ) after the low r oscillations are set to this limit, which indicates correct normalization of the data sets [53]. Furthermore, although the SGeβ (k) functions are the least well conditioned of the set of three, they can be used to accurately 6
J. Phys.: Condens. Matter 19 (2007) 415110
G(r) (barn)
Total pair distribution function G(r) (barn)
7
P S Salmon et al
6 5
nat
GeO2 (Desa et al)
1
nat
GeO2 (present work)
0 0
2
4
4
70
r (Å)
6
GeO2 (+ 4)
3 2
nat
GeO2 (+ 2)
1 0 -1
73
1
2
3
4
GeO2 7
6
5
8
Distance r (Å) Figure 2. The measured total pair distribution functions G(r) for glassy GeO2 . The functions were obtained by Fourier transforming the F(k) shown in figure 1 after truncating either (i) abruptly by using a step function (solid light (red) curves) or (ii) smoothly by using a Lorch function (solid ˚ −1 in both cases. The inset compares nat G(r) as measured in the dark curves) with kmax = 23.5 A present work (solid curve) with the results of Desa et al [52] (broken curve). Both data sets were obtained by Fourier transforming the measured nat F(k) after the application of a Lorch function ˚ −1 . with kmax ≈ 23.5 A
Table 1. Parameters obtained by fitting the Bhatia–Thornton pair correlation functions for glassy GeO2 . The rh I J (r) functions were fitted by using equations (12)–(14) and the maxima in the ln |rh I J (r)| functions were fitted by using equation (15).
IJ
−1
˚ a0 (A
NN 0.33(3) CC 0.24(1) NC 0.250(5) a b
−1
˚ ) a0 a (A 0.26(4) 0.25(2) 0.26(1)
−1
˚ ) a1 (A
−1
˚ ) kPP (A
2.78(3) 2.62(1) 2.654(5)
2.67(1) 2.65(1) 2.66(1)
)
AI J
b
˚) (A
2.1(8) 6.3(5) 4.7(2)
θ I J (rad) 2.8(4) −1.26(7) 1.66(5)
R2
˚ Range (A)
0.86 12.3–19.9 0.94 4.7–15.4 0.99 7.1–16.6
From a straight line fit to the maxima in ln |rh I J (r)| versus r . ANN ≡ 2|ANN |, ACC ≡ 2cGe cO |ACC | and ANC ≡ 2|ANC |.
(i)
(i)
account for the first order difference functions �FGe (k) and �G Ge (r ) (see figure 4) which is important because several types of systematic error are reduced or essentially eliminated when these difference functions are formed [54]. The results show that the FSDP in the measured F(k), which is a ubiquitous feature of covalently bonded amorphous solids [55], appears at ˚ −1 and has a notable contribution from all three Sαβ (k). The principal peak in each 1.53(2) A ˚ −1 (see table 1). function occurs at kPP ≈ 2.66 A 7
P S Salmon et al
0.5 0.4 (3)
ΔFGe(k) + 0.4
(i)
First order difference function ΔFGe(k) (barn)
J. Phys.: Condens. Matter 19 (2007) 415110
0.3 0.2
(2)
ΔFGe(k) + 0.2
0.1 0
(1)
ΔFGe(k)
-0.1
-0.2
0
10
5
20
15 -1
Scattering vector k(Å ) (i)
Figure 3. The measured first order difference functions �FGe (k) (i = 1, 2 or 3) for glassy GeO2 . The solid circles give the data points and are larger than the statistical errors. The solid curves give (i) the Fourier back-transforms of the corresponding �G Ge (r) functions after the small r oscillations (i) are set equal to the limiting �G Ge (r = 0) value.
First order difference function (barn)
2 (1)
(1)
ΔGGe(r) - ΔGGe(0)
1.5
Ge-Ge Ge-O Ge-Ge + GeO
1
0.5
0
-0.5
1
2
3
4
5
6
Distance r (Å) (1)
Figure 4. The measured first order difference function �G Ge (r) for glassy GeO2 obtained by direct (1) Fourier transformation of the �FGe (k) function shown in figure 3 after the application of a step ˚ −1 (solid dark curve). The function is compared with the modification function with kmax = 23.5 A neutron weighted contributions from gGeGe (r) (solid light (red) curve) and gGeO (r) (broken (blue) (1) curve) (see equation (7)). There is no significant discrepancy between �G Ge (r) and the weighted sum of the contributions from gGeGe (r) and gGeO (r) (solid circles).
8
J. Phys.: Condens. Matter 19 (2007) 415110
P S Salmon et al
7 6
SGeGe(k) + 3
Partial structure factor Sαβ(k)
5 4 3
SOO(k)
2 1 0
SGeO(k) - 3
-1 -2 -3 -4 -5 -6
0
5
10
20
15 -1
Scattering vector k (Å ) Figure 5. The measured Faber–Ziman partial structure factors Sαβ (k) for glassy GeO2 as represented by the points with error bars. The functions were obtained from the F(k) shown in figure 1 by direct inversion of the scattering matrix (see equation (4)). The solid (blue) curves give the result of Fourier back-transforming the corresponding partial pair distribution functions, gαβ (r), which are shown in figure 6.
The gαβ (r ) for glassy GeO2 were obtained by Fourier transforming the measured Sαβ (k) functions after they were spline fitted in order to reduce the effects of statistical noise. In the case of gGeO (r ), a correction was also made for the effect of a step modification function M(k) by assuming a Gaussian first peak in dGeO (r ), convoluting this peak with the corresponding M(r ) function (see equation (9)), and fitting the result to the experimental data. The artifacts of M(r ) were thus identified and the fitted Gaussian was smoothly joined to the higher r � features of the dGeO (r ) function obtained by direct Fourier transformation of the spline fitted Sαβ (k). The gαβ (r ) functions of figure 6 were thus obtained after setting the unphysical low r oscillations to zero. They were then Fourier transformed into k -space in order to confirm agreement with the measured Sαβ (k) (see figure 5). Full details of the procedure used to extract gGeO (r ) are described in [18]. 5. Discussion 5.1. Structure of glassy GeO2 ˚ gives a coordination number n¯ O The first peak in gGeO (r ) at rGeO = 1.73(1) A Ge = 3.8(1). As in several other diffraction studies of GeO2 [45, 52, 56], the measured Ge–O coordination number is systematically less than four owing to the finite k -space resolution function of the diffractometer for which a correction was not made [46, 57]. The first peak in gOO (r ) at 9
J. Phys.: Condens. Matter 19 (2007) 415110
P S Salmon et al
5
16
0
14 12
gIJ(r)
Pair distribution function gαβ(r)
18
10
gNN(r)
-5
gNC(r) - 4
-10
8 6
gCC(r) - 9
-15
4 1
2
3
4
5
2 0
2
4
6
8
6 r (Å)
10
Distance r (Å) Figure 6. The measured partial pair distribution functions for glassy GeO2 . The main panel shows the functions gGeO (r) (solid black curve), gGeGe (r) (solid light (red) curve) and gOO (r) (broken (blue) curve). The inset shows the Bhatia–Thornton partial pair distribution functions which were obtained from the gαβ (r) functions of the main panel by using the relations gNN (r) = 2 2 cGe gGeGe (r) + cO gOO (r) + 2cGe cO gGeO (r), gCC (r) = cGe cO [gGeGe (r) + gOO (r) − 2gGeO (r)] and gNC (r) = cGe [gGeGe (r) − gGeO (r)] − cO [gOO (r) − gGeO (r)] where cGe = 1/3 and cO = 2/3.
˚ rOO (r ) = 2.83(1) A √ gives a ratio rOO /rGeO = 1.636(11) that is in agreement with the ideal tetrahedral ratio of 8/3 = 1.633. The tetrahedra share corners to give 4.1(2) Ge–Ge nearest ˚ and there is an average of 6.7(1) O–O nearest neighbours neighbours at rGeGe = 3.16(1) A ˚ for the range 2.58 � r (A) � 3.13. In general, the packing fraction of X atoms of radius rX in an AX2 system is η� = (√ 8/9)n 0 πrX3 and for a perfect tetrahedron of four spherical touching X atoms, rXX /rAX = 8/3 where rXX = 2rX . Hence the packing fraction of X atoms in tetrahedral units,√expressed as a function of rAX and the atomic number density n 0 , √ 3 3 is η� = 16 2πn 0rAX /27 3 = 1.520n 0rAX [58]. The packing fraction of oxygen atoms in tetrahedral units is thus found to be 0.495(9) in glassy GeO2 . A mean inter-tetrahedral Ge– ˆ O–Ge bond angle of 132(2)◦ , which is consistent with the literature [26, 38, 44, 59, 60], is obtained from the first Ge–O and Ge–Ge peak positions. The measured Bhatia–Thornton partial structure factors S I J (k) for glassy GeO2 are shown in figure 7 and the corresponding partial pair distribution functions g I J (r ) are shown in the inset ˚ −1 to figure 6. All of the S I J (k) functions show a first sharp diffraction peak at kFSDP ≈ 1.53 A that is most prominent for SNN (k). The associated intermediate range order in real space [61] has a periodicity 2π/kFSDP and coherence length 2π/�kFSDP where �kFSDP is the full width at half maximum of the FSDP. In the case of SNN (k), the periodicity and coherence length take ˚ respectively. The SCC (k) and SNC (k) functions both show values of 4.13(3) and 8.98(13) A qualitative agreement with the corresponding functions for glassy GeSe2 and ZnCl2 , which can be emphasized by plotting them against the reduced scattering vector krAX where rAX is the separation of unlike nearest neighbours (see figure 2 in [19] and figure 1 in [33]). Intriguingly, SCC (k) shows a small but distinct FSDP which is indicative of concentration fluctuations on the scale of the intermediate range order [18, 47, 62]. This feature is not anticipated for strong glass forming systems such as GeO2 and SiO2 [63] and the origin of this feature for liquid and glassy GeSe2 has proved difficult to trace [64–66]. It is now thought to result from coordination defects 10
J. Phys.: Condens. Matter 19 (2007) 415110
P S Salmon et al
3
Partial structure factor SIJ (k)
2.5
S NN(k) + 1
2 1.5 1
S CC(k) + 0.3 0.5 0
S NC(k) - 0.4
-0.5 -1 0
10
20
30
40
Scaled scattering vector krGeO Figure 7. The measured Bhatia–Thornton partial structure factors, S I J (k), for glassy GeO2 (solid dark curves—the statistical uncertainties are represented by the scatter in the data points) compared with the first principles molecular dynamics results of Giacomazzi et al [38, 39] (broken (red) curves) and the molecular dynamics simulations of Micoulaut et al [35] (open (blue) circles). The partial structure factors are plotted as a function of the scaled scattering vector krGeO where rGeO ˚ or calculated (1.78 A ˚ for [38, 39] or 1.72 A ˚ for [35]) nearest neighbour is the measured (1.73 A) ˚ −1 or krGeO ≈ 2.65. Ge–O distance. Each of the measured functions has an FSDP at k ≈ 1.53 A
and conformations of edge sharing tetrahedra [67, 68] that are not expected for GeO2 [39]. The nature of the structural features in GeO2 that are responsible for the FSDP in SCC (k) therefore requires further investigation. By contrast with the C–C and N–C partial structure factors, the partial structure factor describing the topological ordering, SNN (k), shows large differences between GeO2 and both GeSe2 and ZnCl2 which are more intermediate in character on the fragility scale. In particular, the FSDP is stronger and the principal peak is weaker for GeO2 compared with the other glasses [19, 33]. To examine further the differences between the topological and chemical ordering at distances greater than the nearest neighbour, it is useful to consider the theory for the asymptotic decay of the pair correlation functions developed by Evans and co-workers who made a pole analysis of the k -space solutions to the Ornstein–Zernike equations [69–72]. For a high density ionic AX2 system described by pair potentials involving short ranged repulsive and long ranged Coulomb terms, the pair distribution functions at large distances are expected to decay as [46]
r h NN (r ) → 2|ANN | exp(−a0r ) cos(a1r − θNN ) r h CC (r ) → 2cA cX |ACC | exp(−a0r ) cos(a1r − θCC )
(12)
r h NC (r ) → 2|ANC | exp(−a0r ) cos(a1r − θNC )
(14)
(13)
where h NN (r ) = gNN (r ) − 1, h CC (r ) = gCC (r ) and h NC (r ) = gNC . The amplitudes are related by |ANN ||ACC | = |ANC |2 , the phases are related by θNN + θCC = 2θNC , the common decay 11
J. Phys.: Condens. Matter 19 (2007) 415110
P S Salmon et al
length is given by a0−1 , and the common wavelength of the oscillations is given by 2π/a1 . Alternatively, if the pair potentials also include van der Waals (dispersion) terms with an r −6 dependence, a power law decay is ultimately expected where r h NN (r ) → r −5 , r h CC (r ) → r −9 and r h NC (r ) → r −7 [46, 73]. This power law decay might be difficult to observe owing to the relative weakness of the dispersion forces. However, the presence of these forces means that equations (12)–(14) will not necessarily hold since they were derived for the case when dispersion forces are absent. Furthermore, the presence of three or higher body interactions for glass forming AX2 systems also provides complications but, provided the large r interactions can be described by effective pair potentials that lead to simple poles [46], it is feasible that the theory which leads to equations (12)–(14) will remain valid. Notwithstanding, these equations provide a benchmark for analysing the large r dependence of the Bhatia–Thornton pair distribution functions and for understanding the origin of extended range ordering in more complicated systems that involve three-body potentials. The h I J (r ) functions for GeO2 were obtained by spline fitting and Fourier transforming ˚ −1 ) were extrapolated to k = 0 by plotting the S I J (k) after (i) the low k data points (k � 0.45 A either [SNN (k) − 1], [SCC (k)/cGe cO − 1] or SNC (k)/cGe cO versus k 2 and fitting a straight line at small k [74] and (ii) a Lorch modification function was applied [45]. The resultant functions, plotted as ln |r h I J (r )| versus r in figure 8, show that the N–N correlations have a greater complexity than the N–C and C–C correlations over a wide range of distances and decay more rapidly at lower r values. All of the functions show extended range ordering at large r which persists to distances far exceeding the coherence length estimated from the width of an FSDP. The decay coefficients a0 were estimated by fitting the repeated maxima at large r in figure 8, that are least sensitive to the details of any smoothing procedure, to the straight line ln |r h I J (r )| = −a0r + constant.
(15)
The r h I J (r ) functions were also fitted [46] by using equations (12)–(14) (see figure 8) and the fitted parameters, the range used for the fits, and the R 2 goodness-of-fit parameter are summarized in table 1. The a0 values thus deduced represent upper limits owing to the k space resolution function of the diffractometer [46]. The results show that the extended range oscillations for GeO2 decay exponentially with a common decay coefficient a0 and a periodicity that is determined not by the position of the FSDP but by the position of the principal peak i.e. the wavelength of the oscillations 2π/a1 ≈ 2π/kPP . The relations between the amplitudes and phases predicted by the simple theory do not, however, appear to hold. The values of the moments extracted from the small k fits to the S I J (k) functions for glassy GeO2 are not quoted since they are prone to systematic error [74]. For information, we note that the isothermal compressibility, κT , of glassy GeO2 at ambient pressure is 4.2 × 10⁻¹¹ Pa−1 [75] and the measured refractive index for light of wavelength 0.589 29 μm is n = 1.606 86 [76] ˚ [74]. By assuming an ionic interaction which leads to a Debye screening length D = 0.027 A 3 4+ ˚ [77], use of this refractive index in the Clausius– model with Ge ions of polarizability 0.60 A 2− ˚ 3. Mossotti relation gives an O ion polarizability of 1.67 A 5.2. Reconstruction of the x-ray and neutron total structure factors for glassy GeO2 by using the measured Sαβ (k) In order to interpret the x-ray diffraction data for glassy GeO2 taken under ambient conditions and to aid in the interpretation of data taken under extreme conditions of temperature and pressure [13, 78, 79], it is instructive to investigate the contribution of the partial structure factors to the measured total x-ray structure factor where
S X (k) ≡ [F X (k) + � f (k) 2 ]/� f (k) 2 . 12
(16)
J. Phys.: Condens. Matter 19 (2007) 415110
P S Salmon et al
6
2
(a)
(b) 4
0 -2
NN
NN
0
-6
-2
-8
5
2 0
NC
NC
0
-2 -4
-5
-6
5
2 0
Pair distribution function rhIJ(r)
Logarithm of pair distribution function ln|rhIJ(r)|
-4
2
CC
CC
0
-2 -4 -6
-5 0
5
10
0 15 5 Distance r(Å)
10
15
20
Figure 8. Decay of the Bhatia–Thornton partial pair distribution functions for glassy GeO2 as shown by plotting ln |rh I J (r)| versus r (solid (blue) curves) in column (a) and rh I J (r) versus r (solid (blue) curves) in column (b). For column (a), the coefficient a0 was obtained from the fitted straight lines given by the broken (red) curves and for the N–N, N–C and C–C functions it takes ˚ R 2 = 0.87), 0.26(1) A ˚ ˚ −1 (fit range 12.5–19.6 A, ˚ −1 (fit range 7.6–15.9 A, values of 0.26(4) A −1 2 2 ˚ ˚ R = 0.99) and 0.25(2) A (fit range 5.1–14.9 A, R = 0.93) respectively. For column (b), the broken (red) curves show the fits to the rh I J (r) functions at large r values.
In this expression, F X (k) is given by equation (1) with bGe and bO replaced by the x-ray form factors f Ge (k) and fO (k) for Ge and O respectively, and � f (k) = cGe f Ge (k) + cO f O (k). The F X (k) for glassy GeO2 at ambient conditions, as measured by Sampath et al [78] using high energy x-ray diffraction, is illustrated in figure 9 together with its reconstruction from the x-ray weighted Faber–Ziman partial structure factors measured by neutron diffraction. Within the experimental error, agreement is found between the measured and reconstructed functions at all k values except the smallest where differences between the actual and tabulated [80] atomic form factors are expected to be greatest owing to the role of the outermost (valence) electrons in bonding. For comparison, the contribution of the Sαβ (k) to the measured total neutron structure factor, S N (k), for nat GeO2 is shown in figure 10 where
S (k) ≡ [nat F(k) + ��� b 2 ]/��� b 2 ,
nat N
(17) 13
J. Phys.: Condens. Matter 19 (2007) 415110
P S Salmon et al
Structure factor (barn)
2
1
0
-1
X
AGeGe(k) - 1 X
AGeO(k) - 1 X
AOO(k) -1
-2 0
5
10
20
15 -1
Scattering vector k (Å ) Figure 9. Reconstruction of the measured total x-ray structure factor S X (k) = AX GeGe (k) + X AX GeO (k) + AOO (k) for glassy GeO2 [78] (solid circles) by using the x-ray weighted Faber–Ziman partial structure factors (solid (blue) curve). The contributions from the partial structure factors 2 2 2 X are given by AX GeGe (k) = cGe f Ge (k) SGeGe (k)/� f (k) (solid light (red) curve), AGeO (k) = 2 f (k)2 S 2cGe cO f Ge (k) f O (k)SGeO (k)/� f (k) 2 (solid dark curve) and AX (k) = c (k)/� f (k) 2 OO OO O O (broken (blue) curve) where the Sαβ (k) are taken from figure 5, � f (k) = cGe f Ge (k) + cO f O (k), and the atomic form factors f Ge (k) and f O (k) are taken from [80]. The statistical uncertainties are represented by the scatter in the data points.
��� b = cGe �� bGe + cO bO and �� bGe = b(nat Ge). In this expression, the weighting coefficients for the Ge–Ge, Ge–O and O–O partial structure factors are independent of k and take values of 0.1710, 0.4851 and 0.3439 respectively. A comparison of the results given in figures 9 and 10 show that, although the O–O correlations have a larger weighting in nat S N (k) compared with S X (k), the Ge–Ge and Ge–O correlations still give the largest contribution to nat S N (k) in the region of the FSDP. It is therefore unsafe to attribute the changes observed with increasing pressure in the FSDP region for S X (k) and nat S N (k) to changes that are mostly associated with the oxygen atom correlations [13]. The small principal peak observed in nat S N (k) (figure 10) arises from an almost complete cancellation of the large principal peaks in the neutron weighted Sαβ (k). 5.3. Comparison between the measured and simulated structure of glassy GeO2 The measured partial structure factors and pair distribution functions are compared with the results from two recent molecular dynamics simulations in figures 7, 11 and 12. The first set of simulations were made by Micoulaut et al [34, 35, 37] using the two body potential developed by Oeffner and Elliott for GeO2 [81] and classical molecular dynamics (a similar approach was adopted by Guti´errez and Rogan [82] to study the density dependent structure of the liquid phase of GeO2 ). The second set of simulations were made by Giacomazzi et al using first principles molecular dynamics [38, 39]. Compared to experiment, both sets of simulations give a higher first peak in gGeO (r ) (24.4 [35] and 20.3 [38, 39] cf. 18.5) which yields a larger Ge–O coordination number of four, features that can be attributed to the k -space resolution 14
J. Phys.: Condens. Matter 19 (2007) 415110
P S Salmon et al
Structure factor (barn)
2
1
0
-1
N
AGeO(k) - 1 N
AOO(k) - 1 N
AGeGe(k) - 1
-2 0
5
10
20
15 -1
Scattering vector k (Å ) Figure 10. The contribution to the measured total neutron structure factor nat S N (k) = AN GeGe (k) + N nat GeO (solid (blue) curve) from the neutron weighted Faber– (k) + A (k) for glassy AN 2 GeO OO 2 �� 2 �� 2 Ziman partial structure factors where AN GeGe (k) = cGe bGe SGeGe (k)/� b (solid light (red) curve), �� �� 2 N 2 2 �� 2 AN (k) = 2 c c b b S (k)/� b (solid dark curve) and A Ge O Ge O GeO GeO OO (k) = cO bO SOO (k)/� b (broken (blue) curve). The Sαβ (k) are taken from figure 5, ��� b = cGe �� bGe + cO bO , �� bGe is the bound coherent scattering length of nat Ge, and the measured nat S N (k) function is reproduced by the sum of the AN αβ (k). The statistical uncertainties are represented by the scatter in the data points.
function of the diffractometer used in the experiments [46, 57]. Although a correction for the resolution function was not made, one approach to this problem lies in the ‘moments method’ of Howells [83] which has been successfully applied to the case of liquid lithium [84]. The first peak positions and coordination numbers obtained from the gαβ (r ) functions are compared with experiment in table 2. The experimental values obtained from the present work are in excellent accord with the results obtained from previous diffraction experiments (see table 1 in [31]), with the exception of n¯ O O for which a value greater than six was obtained directly from the measured gOO (r ) function and not from a peak fitting procedure as used in previous work. ˚ attributed to the The first principles results give an elongated peak position of rGeO = 1.78 A use of a generalized gradient approximation in the electronic structure calculations, which has ˆ prompted the use of a scaled abscissa in figures 7, 11 and 12. The mean inter-tetrahedral Ge–O– ◦ ◦ ◦ Ge bond angle of 132(2) obtained from experiment compares with 159 [35] and 135 [38, 39]. Overall, there is good agreement between the measured and simulated pair correlation functions although some important discrepancies occur. For the classical molecular dynamics results, the most notable disagreement with experiment manifests itself in a shift to high k of the FSDP position and reduction of the principal peak height in the simulated SGeGe (k), a phase shift of the higher k oscillations in this function (figure 11), a reduction in height and shift to high r of the first peak in the simulated gGeGe (r ), and a much broader distribution of the other features in this function (figure 12). In ˆ consequence, the Ge–O–Ge bond angle is too large and the relative distribution of the centres of the Ge(O1/2 )4 tetrahedra on an intermediate length scale is not correctly described, thus leading to systematic errors in a description of the topological ordering [37]. The failure to 15
J. Phys.: Condens. Matter 19 (2007) 415110
P S Salmon et al
8 7
SGeGe(k) + 4
Partial structure factor Sαβ(k)
6 5 4 3
SOO(k)
2 1 0 -1
SGeO(k) - 4
-2 -3 -4 -5 -6
-7
0
5
10
20
15
25
30
35
40
Scaled scattering vector krGeO Figure 11. Comparison of the measured Faber–Ziman partial structure factors, Sαβ (k), for glassy GeO2 (solid dark curves) with the first principles molecular dynamics results of Giacomazzi et al [38, 39] (broken (red) curves) and the molecular dynamics simulations of Micoulaut et al [35] (open (blue) circles). The data sets are plotted as a function of the scaled scattering vector krGeO where ˚ or calculated (1.78 A ˚ for [38, 39] or 1.72 A ˚ for [35]) nearest neighbour rGeO is the measured (1.73 A) Ge–O distance. Table 2. Parameters obtained from the first peak in the measured and simulated gαβ (r) for glassy GeO2 . The coordination numbers were calculated using a cut-off value equal to the minimum after the first main peak in gαβ (r). β
Correlation α –β
˚ rαβ (A)
n¯ α
˚ Range (A)
Reference
GeO
1.73(1) 1.72 1.69 1.78
3.8(1) 4.1 4.00 4.01
1.53–1.96 1.60–2.30 1.5–2.2 1.53–2.25
Present work [35] [36] [39]
GeGe
3.16(1) 3.32 3.21 3.25
4.1(2) 4.4 4.06 4.1
2.58–3.56 2.20–3.60 2.7–3.6 2.70–3.73
Present work [35] [36] [39]
OO
2.83(1) 2.81 2.78 2.88
6.7(1) 8.2 6.44 7.8
2.58–3.13 2.25–3.30 2.5–3.2 2.11–3.40
Present work [35] [36] [39]
reproduce these experimental features may help to account for the severe over estimation of the self-diffusion coefficients obtained from simulations of the molten phase [35]. Classical molecular dynamics simulations of glassy GeO2 have also been made using a pair potential with 16
J. Phys.: Condens. Matter 19 (2007) 415110
gGeO(r) 10
18
gGeGe(r) + 6
8
16 14
gαβ(r)
Pair distribution function gαβ(r)
20
P S Salmon et al
12
6 4
10 8
gOO(r)
2
6 4
0
1
2
3
4
5 r/rGeO
2 0
1
2
3
4
5
6
Scaled distance r/rGeO Figure 12. Comparison of the measured partial pair distribution functions, gαβ (r), for glassy GeO2 (solid dark curves) with the first principles molecular dynamics results of Giacomazzi et al [38, 39] (broken (red) curves) and the molecular dynamics simulations of Micoulaut et al [35] (open (blue) circles). The data sets are plotted as a function of the scaled distance r/rGeO where rGeO is the ˚ or calculated (1.78 A ˚ for [38, 39] or 1.72 A ˚ for [35]) nearest neighbour Ge–O measured (1.73 A) distance.
a Morse-type short ranged term [36] and give an improved Ge–Ge nearest neighbour distance ˆ and Ge–O–Ge bond angle of 133◦ although the Ge–O and O–O distances are too small (see table 2). The diffusion coefficients calculated for the liquid phase are significantly smaller than those obtained in [35], in better agreement with experiment. For the first principles molecular dynamics results, the agreement with experiment is improved although the small number of atoms used in the simulation (168) leads to large statistical uncertainties in the region of the FSDP [38, 39]. A small FSDP in SCC (k) is nevertheless found, in agreement with experiment (figure 7). In real space, the most notable discrepancies between the first principles and experimental results (figure 12) occur with respect to the relative sharpness of the measured first peak in gOO (r ) and the small mismatch between the measured and simulated gGeGe (r ) in the second peak region. The vibrational properties of the simulated network give spectra that are in good overall agreement with those measured by using inelastic neutron scattering, infrared spectroscopy and Raman scattering. The theoretical spectra do, however, show an overall shift to lower frequencies which is attributed to the use of a generalized gradient approximation in the set-up of the density functional theory [38]. 5.4. Relation between the structure and fragility of AX2 glass forming systems To investigate the relation between the structure of GeO2 and other strong network forming AX2 glasses based on tetrahedral A(X1/2 )4 units, the total structure factor for SiO2 , FSi (k), was measured in the same neutron diffraction experiment used to obtain the partial structure factors for GeO2 . Silica is often regarded as the canonical network forming glass and is of wide scientific and technological significance [1, 14]. The total structure factor for silica was then 2 2 reconstructed by using the measured Sαβ (k) for germania where FSirec (k) = cSi bSi [SGeGe (k) − 17
J. Phys.: Condens. Matter 19 (2007) 415110
P S Salmon et al
0.2
F(k) (barn)
0.1
0
-0.1
rSiO = 1.60 Å rGeO = 1.73 Å
-0.2 0
10
20
30
40
krAX Figure 13. The measured total structure factor for glassy SiO2 , FSi (k), (solid curve with vertical error bars—the latter are smaller than the curve thickness at all k values) compared with its reconstruction, FSirec (k), (broken curve) from the measured partial structure factors for glassy GeO2 given in figure 5 (see text). Both data sets are plotted as a function of the scaled scattering vector krAX where rAX is the separation of unlike nearest neighbours.
1]+ 2cSi cO bSi bO [SGeO (k)− 1]+cO2 bO2 [SOO (k)− 1] and bSi = 4.1491(10) fm [42]. The measured FSi (k) and its reconstruction FSirec (k) are shown in figure 13 and the corresponding Fourier transforms, the total pair distribution functions G Si (r ) and G rec Si (r ), are shown in figure 14. In these figures, scaled abscissae of krAX and r/rAX are used, where rAX is the nearest neighbour bond length, to provide the best match between the data sets. The structure of silica is also based on an open network of corner sharing A(X1/2 )4 tetrahedra, where the nearest neighbour Si–O and O–O distances are 1.60(1) and ˆ ˚ respectively (see figure 14). The mean inter-tetrahedral bond angle Si–O–Si 2.62(1) A is, ◦ however, larger at 148 [60] and the packing fraction of the oxygen atoms is smaller at η� = 0.414(8). The relative arrangement of the A(X1/2 )4 tetrahedra is therefore different and manifests itself on both the intermediate and extended range as shown by a higher and sharper FSDP in FSi (k) compared with FSirec (k) together with a lower and broader principal peak. Neutron scattering studies hint at concomitant differences between the microscopic dynamics of GeO2 and SiO2 in the liquid phase [85]. The same general features nevertheless occur in the total structure factors and pair distribution functions for both strong glasses. Polyamorphic phase transitions are often associated with a distinct change in the structure of a liquid or glass from strong to fragile with increase of density [4, 14, 15] and tetrahedrally bonded systems remain the most promising candidates for studying this phenomenon experimentally [86, 87]. Furthermore, two or more competing length scales are built into simple model pair potentials that are used in calculations to examine the feasibility of liquid–liquid phase transitions [88–90]. A comparison of the present results with those for glassy ZnCl2 [19] show that it is the relative importance of the FSDP and principal peak that most readily enables a distinction to be made between the diffraction patterns measured for the strong glass GeO2 and the intermediate glass ZnCl2 —the FSDP in SNN (k) for ZnCl2 is much smaller and the principal peak is much 18
J. Phys.: Condens. Matter 19 (2007) 415110
P S Salmon et al
1.2
rSiO = 1.60 Å
G(r) (barn)
0.8
rGeO = 1.73 Å 0.4
0
-0.4 1
2
3
r/rAX
4
Figure 14. The measured total pair distribution function, G Si (r), for glassy SiO2 (solid curve) compared with its reconstruction, G rec Si (r), from the data for glassy GeO2 (broken curve). Both functions were obtained by Fourier transforming the total structure factors shown in figure 13 by ˚ −1 and are plotted as a function of the scaled distance using a step function with kmax = 23.5 A r/rAX .
larger than for GeO2 (see figure 1 of [33]). Like GeO2 , the network of glassy ZnCl2 is also made ˆ from corner sharing A(X1/2 )4 tetrahedra but the mean inter-tetrahedral bond angle Zn–Cl–Zn ◦ � is smaller at 111(1) and the anion packing fraction is much higher at η = 0.647(9). Although homopolar bonds and edge sharing A(X1/2 )4 tetrahedra are a feature of glassy GeSe2 [17, 18], the measured S I J (k) are comparable to those for glassy ZnCl2 (see figure 2 of [19]) with an FSDP and principal peak that are a little sharper and a little weaker, respectively. On the fragility scale, GeSe2 is also more intermediate in character than GeO2 [91] and, if the influence of homopolar bonds is ignored, an anion packing fraction η� = 0.667(17) is found ˆ ˚ with a mean inter-tetrahedral bond angle Ge–Se–Ge using rGeSe = 2.36(2) A of 98(1)◦ . When glassy GeSe2 is subjected to a pressure increasing from ambient to 9.3 GPa, the FSDP in SNN (k) vanishes and the principal peak gains in intensity [92]. Similar behaviour for SNN (k) is observed for the liquid phase of GeSe2 as the density is increased at constant temperature by applying a pressure between 0.5 and 4.1 GPa at 1120 K [93]. When the temperature of liquid GeSe2 is increased at much lower pressures, the density also increases as the network collapses [94]. The FSDP in SNN (k) diminishes in intensity relative to the principal peak and shifts to higher k values as the temperature is raised to 1100 ◦ C and the observed trend in the overall shape of SNN (k) [95] mimics that found in the liquid phase as Ge is added to GeSe2 to form GeSe [96]. In both situations, the Ge(Se1/2 )4 tetrahedra are broken down [97, 98]. When pressures up to 15 GPa are applied to GeO2 , x-ray and neutron diffraction experiments show that the FSDP moves to higher k and merges with the principal peak as the network first collapses and the germanium coordination number eventually increases [13], thus enhancing the relative importance of the principal peak. For silica, the measured diffraction pattern features a more prominent FSDP and weaker principal peak (see figure 13) and much higher pressures are required to induce a network collapse compared to germania [11, 13]. Hence there is a competition between the intermediate and extended range ordering in 19
J. Phys.: Condens. Matter 19 (2007) 415110
P S Salmon et al
tetrahedral network forming AX2 glasses, the former being favoured for open network ˆ structures with large A–X–A inter-tetrahedral bond angles and the latter being favoured for ˆ close packed structures when A–X–A is correspondingly small. This competition is won by the extended range ordering when the density is increased and the system becomes more fragile. 6. Conclusions The full set of partial structure factors has been accurately measured for glassy GeO2 by using the method of isotopic substitution in neutron diffraction. The results show that the network ˆ structure is based on corner sharing Ge(O1/2 )4 tetrahedra with a mean inter-tetrahedral Ge–O– Ge bond angle of 132(2)◦ . The measured Sαβ (k) can be used to reproduce the structure factor measured by using high energy x-ray diffraction and a comparison with molecular dynamics simulations shows that improved models for the network structure can be developed. The results suggest that there is a competition between the intermediate and extended range ordering in network AX2 glasses that is won by the latter with increasing glass fragility. Acknowledgments It is a pleasure to thank Pierre Palleau for help with the diffraction experiment, Adrian Wright and Chris Benmore for providing their diffraction data for GeO2 , Luigi Giacomazzi and Matthieu Micoulaut for providing their molecular dynamics results for GeO2 , and the EPSRC for financial support. It is also a pleasure for Phil Salmon and Adrian Barnes to express their sincere gratitude to Spencer Howells for all his invaluable help, advice and friendship over many years. References [1] [2] [3] [4] [5] [6] [7] [8] [9] [10] [11] [12] [13] [14] [15] [16] [17] [18] [19] [20] [21] [22] [23] [24] 20
Angell C A 1995 Science 267 1924 Debenedetti P G 1996 Metastable Liquids (Princeton, NJ: Princeton University Press) p 301 Sciortino F, Kob W and Tartaglia P 1999 Phys. Rev. Lett. 83 3214 Sastry S 2001 Nature 409 164 Saksaengwijit A, Reinisch J and Heuer A 2004 Phys. Rev. Lett. 93 235701 Moreno A J, Buldyrev S V, La Nave E, Saika-Voivod I, Sciortino F, Tartaglia P and Zaccarelli E 2005 Phys. Rev. Lett. 95 157802 Scopigno T, Ruocco G, Sette F and Monaco G 2003 Science 302 849 Novikov V N and Sokolov A P 2004 Nature 431 961 Yannopoulos S N and Johari G P 2006 Nature 442 E7 Itie J P, Polian A, Calas G, Petiau J, Fontaine A and Tolentino H 1989 Phys. Rev. Lett. 63 398 Durben D J and Wolf G H 1991 Phys. Rev. B 43 2355 Polsky C H, Smith K H and Wolf G H 1999 J. Non-Cryst. Solids 248 159 Guthrie M, Tulk C A, Benmore C J, Xu J, Yarger J L, Klug D D, Tse J S, Mao H-k and Hemley R J 2004 Phys. Rev. Lett. 93 115502 Saika-Voivod I, Poole P H and Sciortino F 2001 Nature 412 514 Saika-Voivod I, Sciortino F and Poole P H 2004 Phys. Rev. E 69 041503 Angell C A 1985 J. Non-Cryst. Solids 73 1 Petri I, Salmon P S and Fischer H E 2000 Phys. Rev. Lett. 84 2413 Salmon P S and Petri I 2003 J. Phys.: Condens. Matter 15 S1509 Salmon P S, Martin R A, Mason P E and Cuello G J 2005 Nature 435 75 Bhatia A B and Thornton D E 1970 Phys. Rev. B 2 3004 Foley M, Wilson M and Madden P A 1995 Phil. Mag. B 71 557 Fischer H E, Cuello G J, Palleau P, Feltin D, Barnes A C, Badyal Y S and Simonson J M 2002 Appl. Phys. A 74 S160 Enderby J E, North D M and Egelstaff P A 1966 Phil. Mag. 14 961 Bondot P 1974 Acta Crystallogr. A 30 470
J. Phys.: Condens. Matter 19 (2007) 415110 [25] [26] [27] [28] [29] [30] [31] [32] [33] [34] [35] [36] [37] [38] [39] [40] [41] [42] [43] [44] [45] [46] [47] [48] [49] [50] [51] [52] [53] [54] [55] [56] [57] [58] [59] [60] [61] [62] [63] [64] [65] [66] [67] [68] [69] [70] [71] [72] [73] [74] [75] [76] [77] [78] [79]
P S Salmon et al
Waseda Y, Sugiyama K, Matsubara E and Harada K 1990 Mater. Trans. JIM 31 421 Price D L, Saboungi M-L and Barnes A C 1998 Phys. Rev. Lett. 81 3207 Kang S, Park C, Saito M and Waseda Y 1999 Mater. Trans. JIM 40 552 Kohara S and Suzuya K 2003 Nucl. Instrum. Methods Phys. Res. B 199 23 Kohara S and Suzuya K 2005 J. Phys.: Condens. Matter 17 S77 McGreevy R L 2001 J. Phys.: Condens. Matter 13 R877 Micoulaut M, Cormier L and Henderson G S 2006 J. Phys.: Condens. Matter 18 R753 Dianov E M and Mashinsky V M 2005 J. Lightwave Technol. 23 3500 Salmon P S, Barnes A C, Martin R A and Cuello G J 2006 Phys. Rev. Lett. 96 235502 Micoulaut M 2004 J. Phys.: Condens. Matter 16 L131 Micoulaut M, Guissani Y and Guillot B 2006 Phys. Rev. E 73 031504 Van Hoang V 2006 J. Phys.: Condens. Matter 18 777 Micoulaut M, Yuan X and Hobbs L W 2007 J. Non-Cryst. Solids 353 1961 Giacomazzi L, Umari P and Pasquarello A 2005 Phys. Rev. Lett. 95 075505 Giacomazzi L, Umari P and Pasquarello A 2006 Phys. Rev. B 74 155208 Fischer H E, Barnes A C and Salmon P S 2006 Rep. Prog. Phys. 69 233 Faber T E and Ziman J M 1965 Phil. Mag. 11 153 Sears V F 1992 Neutron News 3 26 Edwards F G, Enderby J E, Howe R A and Page D I 1975 J. Phys. C: Solid State Phys. 8 3483 Leadbetter A J and Wright A C 1972 J. Non-Cryst. Solids 7 37 Lorch E 1969 J. Phys. C: Solid State Phys. 2 229 Salmon P S 2006 J. Phys.: Condens. Matter 18 11443 Salmon P S 1992 Proc. R. Soc. A 437 591 Vergano P J and Uhlmann D R 1970 Phys. Chem. Glasses 11 30 Jal J F, Mathieu C, Chieux P and Dupuy J 1990 Phil. Mag. B 62 351 Bertagnolli H, Chieux P and Zeidler M D 1976 Mol. Phys. 32 759 Salmon P S 1988 J. Phys. F: Met. Phys. 18 2345 Desa J A E, Wright A C and Sinclair R N 1988 J. Non-Cryst. Solids 99 276 Salmon P S and Benmore C J 1992 Recent Developments in the Physics of Fluids ed W S Howells and A K Soper (Bristol: Hilger) p F225 Salmon P S, Xin S and Fischer H E 1998 Phys. Rev. B 58 6115 Elliott S R 1991 Nature 354 445 Price D L, Ellison A J G, Saboungi M-L, Hu R-Z, Egami T and Howells W S 1997 Phys. Rev. B 55 11249 Grimley D I, Wright A C and Sinclair R N 1990 J. Non-Cryst. Solids 119 49 Wright A C, Etherington G, Desa J A E, Sinclair R N, Connell G A N and Mikkelsen J C Jr 1982 J. Non-Cryst. Solids 49 63 Hussin R, Dupree R and Holland D 1999 J. Non-Cryst. Solids 246 159 Neuefeind J and Liss K-D 1996 Ber. Bunsenges. Phys. Chem. 100 1341 Salmon P S 1994 Proc. R. Soc. A 445 351 Penfold I T and Salmon P S 1991 Phys. Rev. Lett. 67 97 Massobrio C, Celino M and Pasquarello A 2004 Phys. Rev. B 70 174202 Massobrio C, Pasquarello A and Car R 1998 Phys. Rev. Lett. 80 2342 Massobrio C, Pasquarello A and Car R 2001 Phys. Rev. B 64 144205 Massobrio C and Pasquarello A 2003 Phys. Rev. B 68 020201 Sharma B K and Wilson M 2006 Phys. Rev. B 73 060201 Massobrio C and Pasquarello A 2007 Phys. Rev. B 75 014206 Evans R, Leote de Carvalho R J F, Henderson J R and Hoyle D C 1994 J. Chem. Phys. 100 591 Leote de Carvalho R J F and Evans R 1994 Mol. Phys. 83 619 Leote de Carvalho R J F, Evans R, Hoyle D C and Henderson J R 1994 J. Phys.: Condens. Matter 6 9275 Grodon C, Dijkstra M, Evans R and Roth R 2004 J. Chem. Phys. 121 7869 Kjellander R and Forsberg B 2005 J. Phys. A: Math. Gen. 38 5405 Salmon P S 2005 J. Phys.: Condens. Matter 17 S3537 Smith K H, Shero E, Chizmeshya A and Wolf G H 1995 J. Chem. Phys. 102 6851 Polukhin V N 1982 Fiz. Khim. Stekla 8 338 Duffy J A 2005 Phys. Chem. Glasses 46 1 Sampath S, Benmore C J, Lantzky K M, Neuefeind J, Leinenweber K, Price D L and Yarger J L 2003 Phys. Rev. Lett. 90 115502 Hong X, Shen G, Prakapenka V B, Newville M, Rivers M L and Sutton S R 2007 Phys. Rev. B 75 104201
21
J. Phys.: Condens. Matter 19 (2007) 415110
P S Salmon et al
[80] Maslen E N, Fox A G and O’Keefe M A 1995 International Tables for Crystallography vol C ed A J C Wilson (Dordrecht: Kluwer) p 476 (section 6.1.1) [81] Oeffner R D and Elliott S R 1998 Phys. Rev. B 58 14791 [82] Guti´errez G and Rogan J 2004 Phys. Rev. E 69 031201 [83] Howells W S 1984 Nucl. Instrum. Methods Phys. Res. 219 543 [84] Salmon P S, Petri I, de Jong P H K, Verkerk P, Fischer H E and Howells W S 2004 J. Phys.: Condens. Matter 16 195 [85] Meyer A, Schober H and Neuhaus J 2001 Phys. Rev. B 63 212202 [86] Poole P H, Grande T, Angell C A and McMillan P F 1997 Science 275 322 [87] Wilding M C, Wilson M and McMillan P F 2006 Chem. Soc. Rev. 35 964 [88] Franzese G, Malescio G, Skibinsky A, Buldyrev S V and Stanley H E 2001 Nature 409 692 [89] Jagla E A 2001 Phys. Rev. E 63 061501 [90] Gibson H M and Wilding N B 2006 Phys. Rev. E 73 061507 Gibson H M and Wilding N B 2006 Phys. Rev. E 74 019903 [91] Stølen S, Grande T and Johnsen H-B 2002 Phys. Chem. Chem. Phys. 4 3396 [92] Mei Q, Benmore C J, Hart R T, Bychkov E, Salmon P S, Martin C D, Michel F M, Antao S M, Chupas P J, Lee P L, Shastri S D, Parise J B, Leinenweber K, Amin S and Yarger J L 2006 Phys. Rev. B 74 014203 [93] Crichton W A, Mezouar M, Grande T, Stølen S and Grzechnik A 2001 Nature 414 622 [94] Ruska J and Thurn H 1976 J. Non-Cryst. Solids 22 277 [95] Petri I, Salmon P S and Howells W S 1999 J. Phys.: Condens. Matter 11 10219 [96] Salmon P S and Liu J 1994 J. Phys.: Condens. Matter 6 1449 [97] Petri I, Salmon P S and Fischer H E 1999 J. Phys.: Condens. Matter 11 7051 [98] Massobrio C, van Roon F H M, Pasquarello A and De Leeuw S W 2000 J. Phys.: Condens. Matter 12 L697
22