MICROBIAL ECOLOGY Microb Ecol (1999) 38:168–179 DOI: 10.1007/s002489900161 © 1999 Springer-Verlag New York Inc.
Structure of the Microbial Communities in Coniferous Forest Soils in Relation to Site Fertility and Stand Development Stage T. Pennanen,1 J. Liski,2 E. Bååth,3 V. Kitunen,1 J. Uotila,4 C.J. Westman,2 H. Fritze1 1
Finnish Forest Research Institute, Post Office Box 18, 01301 Vantaa, Finland Department of Forest Ecology, University of Helsinki, Post Office Box 24, 00014 University of Helsinki, Finland 3 Department of Microbial Ecology, Lund University, 223 62 Lund, Sweden 4 Juve Group Oy, Pahtajakuja 7, 96400 Rovaniemi, Finland 2
Received: 9 November 1998; Accepted: 26 April 1999
A
B S T R A C T
The structure, biomass, and activity of the microbial community in the humus layer of boreal coniferous forest stands of different fertility were studied. The Scots pine dominated CT (Calluna vulgaris type) represented the lowest fertility, while VT (Vaccinium vitis-idae´a type), MT (Vaccinium myrtillus type), and OMT (Oxalis acetocella–Vaccinium myrtillus type) following this order, were more fertile types. The microbial community was studied more closely by sampling a succession gradient (from a treeless area to a 180-years-old Norway spruce stand) at the MT type site. The phospholipid fatty acid (PLFA) analysis revealed a gradual shift in the structure of the microbial community along the fertility gradient even though the total microbial biomass and respiration rate remained unchanged. The relative abundance of fungi decreased and that of bacteria increased with increasing fertility. The structure of the bacterial community also changed along the fertility gradient. Irrespective of a decrease in fungal biomass and change in bacterial community structure after clear-cutting, the PLFA analysis did not show strong differences in the microbial communities in the stands of different age growing on the MT type site. The spatial variation in the structure of the microbial community was studied at a MT type site. Semivariograms indicated that the bacterial biomass, the ratio between the fungal and bacterial biomasses, and the relative amount of PLFA 16:15 were spatially autocorrelated within distances around 3 to 4 m. The total microbial and fungal biomasses were autocorrelated only up to 1 m. The spatial distribution of the humus microbial community was correlated mainly with the location of the trees, and consequently, with the forest floor vegetation.
Correspondence to: T. Pennanen; E-mail:
[email protected]
Microbial Community Structure in Coniferous Forest Soils
Introduction
169
Materials and Methods Soil Sampling and Description of the Study Sites
Forest soil microorganisms and soil fauna decompose organic material, and thus they strongly influence the nutrient cycling of the ecosystem. Soil chemical characteristics and soil physical factors, including soil texture and the climatic variables, influence the structure and the spatial distribution of the decomposer community both directly and indirectly by affecting the amount and quality of litter input through the plant species composition. Numerous studies have been carried out dealing with the litter decomposition in coniferous forests [e.g., 6, 28]. The litter decomposition rate has been shown to be affected by the forest site productivity [20], as well as the forest floor type [37]. Nohrstedt [31] studied the relationship between biological activity and site properties in a number of forest stands and concluded that the soil organic C content affected the microbial activity more than the other measured soil properties. Gyllenberg et al. [14] studied soils of different forest types using plate counts and found that beside affecting the activity of the microorganisms, site properties and their influence on plant community also affect the microbial community composition. Scots pine, Norway spruce, and silver birch, all common tree species in Scandinavian boreal forests, have been shown to alter the chemical and microbial characteristics of the originally similar soils in a 60-year time span [39]. However, the site variation in the microbial characteristics of the boreal forest soil is still largely unknown, even though it would provide essential information about the relationship between the environmental factors and the structure of the indigenous microbial community exposed to these environmental factors. Consequently, the present study is an attempt to investigate the microbial community structure along a forest site fertility and productivity gradient. In addition, the variation in microbial community structure was studied more closely in relation to three different aspects connected with the forest site type gradient: (i) the gradual shift between two forest site types; (ii) the spatial distribution of the microbial community in one forest site type; and (iii) the effect of stand development stage on the microbial community along a succession gradient representing the same fertility type. Phospholipid fatty acid analysis (PLFA), a nonselective community-level technique, was used to detect changes in the microbial community structure without determining the exact species composition.
All the samples were collected from the humus layer (F/H layer) using a soil corer (7.2 cm diameter) and sieved (2.8 mm mesh) before analyses. Forest site fertility gradient: A total of 23 sites were located in mature Scots pine (Pinus sylvestris L.) and Norway spruce (Picea abies L. Karst.) stands, scattered over an approximately 400 km2 area near the Helsinki University Forestry Station in southern Finland (61° 48⬘ N, 24° 19⬘ E). Climate is uniform throughout the area. The annual mean temperature is +2.9°C; January is the coldest month (mean −8.9°C) and July the warmest (mean + 15.3°C). The soils are podzolic and have developed on deep glacio-fluvial or wind-blown deposits consisting of stony esker material, sorted coarse or fine sand, or shallow supra-aquatic silty till. The Finnish classification of forest types [7] was utilized to select sites of different fertilities in the area. The classification system divides sites into a few forest site types on the basis of the composition of the ground vegetation: these types generally differ in productivity. Our fertility gradient covered the range of forest site types from nutrient-poor and dry Calluna vulgaris (CT) site types, through Vaccinium vitis-idae´a types (VT) and Vaccinium myrtillus types (MT), to nutrient-rich Oxalis acetosella–Vaccinium myrtillus (OMT) site types. The tree stands of CT and VT type sites are dominated by Scots pine, while those of MT and OMT type sites are dominated by Norway spruce. The different fertility of the types is reflected in their yield capacities. In general, the total stemwood production of naturally developed (naturally regenerated and no forest harvest) Scots pine stands average 310 m3 ha−1 and 528 m3 ha−1 at the age of 100 years at typical CT and VT type sites, respectively. Similar production figures for Norway spruce are 614 m3 ha−1 at MT sites and 658 m3 ha−1 at OMT type sites. The total number of the study plots consisted of 5 CT plots, 6 VT plots, 8 MT plots, and 4 OMT plots. At each site the coverage percentage of each plant species in the ground vegetation layer was determined. Average soil chemical characteristics concerning these study plots, including the carbon pools in the different soil horizons, are given by Liski and Westman [24]. From each of the 23 study plots (10 × 30 m), 21 cores were taken in September 1994. Sample points were distributed at 3 m distances along 3 lines, and 7 cores were taken from each of the lines. Gradual shift between VT and MT site types along a gentle slope: The study area is located near the Helsinki University Forestry Station in southern Finland (61° 48⬘ N, 24° 19⬘ E) and covers a gradual shift from dry Vaccinium vitis-idae´a (VT) forest site type, dominated by Scots pine, to a mesic Vaccinium myrtillus (MT) site type where Norway spruce is a dominating tree species. The area consists of three adjacent 30 × 30 m study sites along a gentle, 100-m long slope, producing a moisture and fertility gradient. A detailed description of the soil particle size distribution, water retention capacity, hydraulic conductivity, etc., is given by Mecke and Ilvesniemi [27]. Because of the gradual shift in forest site types and soil hydrological properties along the gradient, we called the three study plots dry, intermediate, and mesic. Nine separate humus
170 samples, each of them consisting of three cores of humus, were taken from the three study sites. Samples were collected systematically along three lines placed in each of the study site (across the slope). The distance between the lines was 10 m and the distance between the samples along the lines was about 7 m. Samples were taken in September 1994. The biomass results of this study area were presented per dry matter (d.m.) since the organic matter content was not determined. Spatial variation within a MT site type: Spatial variation in the structure of the microbial community in the humus layer within a MT forest site was studied in a mature Norway spruce stand in southern Finland. Sampling was performed in June 1995. A 4 × 10 m sampling grid was placed at the site so that one-half of the grid lay in a small opening (break in the canopy) and the other one-half under tree canopies to allowed us to study the effect of trees on the variation. Grasses and Vaccinium myrtillus were more abundant in the open half compared to the canopied half. A total of 55 samples were collected from this grid so that the distance between the adjacent samples was 1 m. To study the variation also on a smaller scale, 20 samples were collected along a line placed in the center of the grid. The distance between the samples along this line was 15 cm. Only PLFAs were determined. Stand development stage gradient within a MT site type: Study plots representing five different stages of stand development were situated in MT site type stands in Evo (E), southern Finland and in Lohikoski (L), southeast Finland [40]. Development class 0 constituted open sites clear-cut about 5 years before sampling. In Lohikoski the area had also been scarified and planted with birch. Development class 1 constituted 10 to 15-year-old advanced seedling stands mainly dominated by Scots pines. Class 2 sites were young thinned stands, 30 to 40-year-old Scots pine and Norway spruce. Development class 4 study plots were mature stands dominated by 120 to 150-year-old Norway spruce. Development class 6 sites were 135–175 years old (except another L6 study plot, which was about 100 years old) Norway spruce dominating stands in the natural stage. Classes 0–4 were managed according to normal Finnish silvicultural practise, for example, repeated thinning cuttings in production stands aiming at clear-cutting of the mature stand and regeneration by planting. In class 6 stands no cuttings had been conducted and their successional stage thus more or less resembled that of a naturally developed stand. Sampling was performed in September 1996 in a similar way as along the forest site type gradient.
Chemical and Microbiological Analyses Humus samples were stored at +4°C for about 2 weeks before basal respiration rate, substrate-induced respiration (SIR), and phospholipid fatty acid (PLFA) analysis were performed. Humus dry weight was determined by drying duplicate subsamples at 105°C overnight and organic matter content by heating dried subsamples at 550°C for 4 h. Total organic carbon and nitrogen were determined by dry combustion (Leco CHN-1000) on air-dried humus. pHH2O (1:1.7 v/v) was measured on fresh humus that had been stored in a freezer (−18°C).
T. Pennanen et al. The water content of the fresh soil was adjusted to 60% of the water-holding capacity before CO2-production measurements. Basal respiration was then measured as CO2 evolved in 22–49 h. Substrate induced respiration (SIR) [1], which measures the biomass of active microbes in soil, was performed following modifications described by Priha and Smolander [38]. Fresh humus, equaling 2 g dry weight, with two replicates was used in both analyses. The phospholipid extraction and analysis of phospholipid fatty acids (PLFAs) was done as previously described by Frostegård et al. [12] with some modifications. To briefly summarize this procedure, 0.5 g fresh weight of humus was extracted with chloroform: methanol:citrate buffer mixture (1:2:0.8) and the lipids separated into neutral lipids, glycolipids, and phospholipids on a silicic acid column. The phospholipids were subjected to a mild alkaline methanolysis, and the fatty acid methyl esters were detected by gas chromatography (flame ionization detector) using a 50 m HP-5 (phenylmethyl silicone) capillary column. Helium was used as a carrier gas. The temperatures of the injector and detector were 230 and 270°C, respectively. The initial temperature of the oven was 50°C and it was raised at the rate of 30°C min−1 to 160°C, then at the rate of 2°C min−1 to 270°C and at the end oven was kept for 5 min at the final temperature of 270°C. Peak areas were quantified by adding methyl nonadecanoate fatty acid (19:0) as an internal standard. The recognition of the fatty acids was based on fatty acid standard compounds (Larodan Fine Chemicals AB, Nu Chek Prep, Inc.), on a gas chromatograph equipped with a mass selective detector (GC-MSD, HP 5873) and on previous identifications published by Frostegård et al. [12]. Fatty acids are designated in terms of total number of carbon atoms:number of double bonds, followed by the position of the double bond from the methyl end of the molecule. The prefixes i and a indicate iso- and anteiso branching, br indicates unknown branching, and cy indicates cyclopropane fatty acid. Me refers to the position of methyl group from the carboxyl end of the chain. The prefix C (C15:1) indicates that the PLFA has 15 carbon atoms and one double bond, but the arrangement of the carbon atoms (e.g., branching position) was not confirmed. The sum of PLFAs considered to be predominantly of bacterial origin (i15:0, a15:0, 15:0, i16:0, 16:19, 16:17t, i17:0, a17:0, 17:0, cy17:0, 18:17, and cy19:0) was chosen as an index of the bacterial biomass [10]. The quantity of PLFA 18:26,9 was used as an indicator of fungal biomass, as it is suggested to be mainly of fungal origin in the soil [8] and it is known to correlate with the amount of ergosterol [10], a sterol found only in fungi. The ratio of fungal and bacterial PLFAs was used as an index of the ratio of fungal/bacterial biomass in the soil.
Statistical Analyses Except for the samples along a gentle slope, which were expressed on dry matter (d.m.) basis, the results were expressed per organic matter (o.m.) content of the humus, since organic matter is known to affect microbial biomass and activity [31, 46]. The one-way
Microbial Community Structure in Coniferous Forest Soils analysis of variance (ANOVA) was used to study the difference between forest site types and between the sampling points along the hydrological slope. Spatial variation in the PLFAs within the site was analyzed using semivariograms. In a semivariogram, semivariances, ␥, are calculated for different distance intervals, h, in data and plotted against these lags: ␥(h) = ∑(z(xi) − z(xi + h))2/2(N(h)) where N(h) is the number of sample pairs in the lag h and z(xi) and z(xi + h) are data values at locations xi and xi + h, respectively [18]. In this study, N(h) ranged from 33 to 356. In spatially dependent data, samples located close to each other tend to be more similar than samples located further away, and consequently the semivariances increase with distance. In this study, the range of spatial dependence was determined by visually interpreting the semivariograms. To illustrate the spatial patterning, maps were drawn after interpolating the data values for 20 × 20 cm blocks using block kriging. The coefficients of variation (CV) for the total, bacterial, and fungal biomasses of each of the experiments were calculated to allow comparison of the variation between the different experiments. To give ecological relevance to the variation in PLFA composition of the humus horizon samples from our forest site type series, canonical correspondence analysis (CCA) [21] was applied. Our input data in the analysis consisted of 23 sample plots having altogether 83 different nonwoody plant species and 13 environmental variables. Among the environmental variables six were descriptive variables such as silt and sand in soil parent material, SIR, pH, and nitrogen concentration in humus horizon soil material. Site productivity was described by the H 40 index, i.e., mean height of the dominant trees of the stand at 40 years of age. Further, the mole percents of seven PLFAs were entered in the analysis. The PLFAs entered in the analysis had to be chosen from a total of 33 different PLFAs. Therefore, we first calculated the Spearman rank correlation coefficients between all PLFAs and axis scores obtained from an ordination analysis on our vegetation data (detrended correspondence analysis). Among the PLFAs we then chose those ones having he highest rank correlation with the first three axes. The result of the CCA analysis is presented in a series of four plots with species and sites as scatter plots, and descriptive environmental variables and PLFAs as vector plots. Axis scores and vector coordinates were standardized to zero mean and −1 to +1 range. In cases where vegetation data were not available (the hydrological slope and the stand development gradient), the standardized mol% of the PLFAs were subjected to principal component analysis (PCA).
Results Forest Site Fertility Gradient The fertility and productivity gradient was related to soil properties described by environmental vectors in Fig. 1c.
171
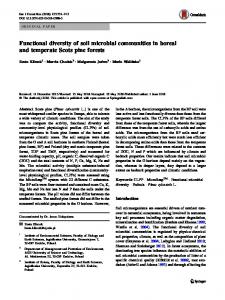
The low productive CT type sites on sandy soils with high water permeability and xeric surface vegetation (lichens and woody small shrubs), concentrated to the −x, +y region in Figs. 1a and b. The VT type sites, characterized by forest floor mosses such as Pleurozium schreberii, Hylocomium splendens, and Ptilium christa-castrensis, in most cases were located near to the center of the plot, while the most productive sites appeared to the right side of the plot. As the perpendicular projections of the pH, total N and Silt vectors on the x-axis extended far to the right (Sand projection to the left), and as the H 40 vector indicating mean height of the dominant trees of the stand at 40 years age also increases along the x-axis (Fig. 1c), this axis in Figs. 1a–d can be taken as a productivity gradient. Typical for the more fertile and productive MT and OMT type sites is the presence of several small herbs such as Trientalis europea, Maianthemum bifiolium, Luzula pilosa, and Vaccinium myrtillus. On the most fertile sites (OMT site type), a rich surface vegetation, including liver mosses, herbs, and ferns, also occurs. However, two of the most productive sites (OMT) separate from the main gradient. Both sites (Fig. 1b, upper right corner) are of high productivity and are characterized by a great number of plant species occurring only on these two sites. One of the sites is located on a coarse sandy soil down slope with laterally moving ground water constantly near to the soil surface, and the other one has been broadcast fertilized with nitrogen several times. In addition, one single VT site having an abundant occurrence of Empetrum nigrum deviates from the bulk of the VT type sites. It is important to note that these three outlier sites with diverging ground vegetation are the main cause of the “arch” effect in Figs. 1a and 1b, and all the other sites distribute along the divergent Sand–Silt vectors. Humus pH and the concentration of total N increased with increasing fertility of the site type, being lowest in the CT and VT types and highest in the OMT type (Table 1, Fig. 1c). However, the concentration of organic C in the humus material did not change along the gradient, and thus the C/N ratio decreased toward more fertile sites. The total biomass of active microbes measured by SIR and the amount of total PLFAs indicating the total microbial biomass were not significantly affected by the fertility of the forest site type. The microbial activity, estimated by the basal respiration rate, did not change, either. However, the fungal biomass decreased with the increasing fertility of the sites, while the bacterial biomass was unaffected. These trends resulted in a decrease in the ratio of fungal/bacterial biomass with in-
172
T. Pennanen et al.
Fig. 1. Scatter and vector plots of CCA illustrating the distribution of plant species (a), forest site types (b), trends in environmental variables (c), and PLFA pattern (d) along two first canonical axes (x, y). Plant species scientific name is indicated by three first letters from each name. Forest site types refer to Cajanderian site type classification, where CT equals Calluna vulgaris type, VT Vaccinium vitisidae´a type, MT Vaccinium myrtillus type, and OMT Oxalis acetocella–Vaccinium myrtillus type. Among the environmental variables, Silt and Sand are fractions 0.06–0.002 and 2–0.2 mm, respectively, H 40 is a stand productivity measuring index based on the estimated height of the dominant trees at 40 years age. N is total N as % of dry matter. SIR is given as mg Cmic (o.m.) and the individual PLFAs (d) are given as mol% of the total PLFAs.
creasing fertility of the site. Coefficients of variation for all the data were 12, 12, and 23% for the total microbial, bacterial, and fungal biomass, respectively. The CCA analysis separated the PLFAs into two main
vector groups. The relative amount of fungal PLFA 18:26,9 increased with decreasing site fertility (Fig. 1d). The same trend was also seen for PLFAs 18:19 and 17:18 (data not shown). The relative amount of PLFAs br18:0, 10Me16:0,
Table 1. Chemical and microbiological variables in forest sites of different fertilitya
CT VT MT OMT SD F p a
o.m. %
Corg
Ntot
74.5 81.7 80.2 81.0
39.3 45.5 42.7 41.4
1.05 1.27 1.35 1.48
6.4 1.34 0.29
4.7 1.64 0.21
0.13 9.33