Structured Computer-based Training in the Interpretation of Neuroradiological Images Sharples, M.1, Jeffery, N.P. 3, du Boulay, B. 2, Teather B.A. 3, Teather, D. 3 & du Boulay, G.H. 3,4 1. School of Electronic and Electrical Engineering, University of Birmingham, UK 2. School of Cognitive and Computing Sciences, University of Sussex, UK 3. Department of Medical Statistics, De Montfort University, Leicester, UK 4. Institute of Neurology, London, UK Address for correspondence: Professor Mike Sharples Educational Technology Research Group School of Electronic and Electrical Engineering University of Birmingham Edgbaston Birmingham B15 2TT UK Fax: +44 121 414 4291 Email:
[email protected] Keywords: Medical imaging, computer-based training, statistical diagnosis, image description
Summary Computer-based systems may be able to address a recognised need throughout the medical profession for a more structured approach to training. We describe a combined training system for neuroradiology, the MR Tutor, that differs from previous approaches to computer-assisted training in radiology in that it provides case-based tuition whereby the system and user communicate in terms of a well-founded Image Description Language. The system implements a novel method of visualisation and interaction with a library of fully described cases utilising statistical models of similarity, typicality and disease categorization of cases. We describe the rationale, knowledge representation and design of the system, and provide a formative evaluation of its usability and effectiveness.
Introduction The specialty of radiology, in common with most of medicine, is gradually developing a more systematic approach to training, replacing the traditional mixture of ad hoc apprenticeship and formal lectures with a combination of structured tuition and casebased experiential learning. This is intended to meet a long-recognised need for clinicians to encapsulate general medical knowledge within the development of skills through diagnostic practice [1]. A structured approach to training can have the additional benefit of equipping learners with a coherent ‘conceptual framework’: an appropriately defined and organised notation that enables them to externalise, reflect on and share diagnostic knowledge. Computer-enhanced reporting, whereby radiologists describe images by means of a structured notation for abnormal image features supplemented by a computergenerated diagnosis, has been shown (for mammography) to improve the diagnostic accuracy of general radiologists to equal that of specialists [2]. In Magnetic Resonance Imaging (MRI), the predictive power of data generated from structured reports has been demonstrated for two key clinical problems [3, 4].
Computer-based Training in Radiology Computer-based systems to assist in radiology training include videodisk applications [5, 6], hypermedia-based programs (such as FACT/FILE [7], RADMAC [8] and CT-The Game [9]) and teaching files available on the World Wide Web. They offer a valuable backup to human or textbook teaching, particularly if the teaching is linked explicitly to the specific reference material, but they are limited by the shallowness of relations between the images and the textual material. The descriptive labels and pre-prepared texts do not form a systematic representation of knowledge that could be interpreted by the computer to provide active teaching, or to answer complex queries. Few active knowledge-based tutors have been developed that can call on structured representations of domain knowledge to generate sequences of teaching actions, provide comparisons between cases and diagnose learner misconceptions. The CT Brain Tutor developed at the Medical College of Georgia [10] trains radiology residents in the diagnosis of brain tumours from CT and MRI scans. It presents images from a library of 120 cases indexed by case history and radiological features. The indicative features are disease based (‘tumour’, ‘oedema’, ‘calcification’) and do not form a comprehensive image description language. The Radiology Tutor [11] generated Socratic tutorials about the appearance of chest X-rays. It was able to conduct a viable dialogue with a trainee in natural language but was constrained by its limited natural language understanding, only being able to parse a limited subset of English. RUI [12] is a generalisation of the Radiology Tutor into a general-purpose authoring shell. Demonstration tutors have been implemented in RUI for a limited subset of diagnostic problems in MR, CT, Ultrasound and X-ray. RUI and the Radiology Tutor take a conventional Intelligent Tutoring Systems approach to training, with the system acting as a simulated human tutor.
— 2 —
RadTutor is a prototype system to train radiologists in diagnosing mammograms exhibiting breast diseases [13]. A cognitive account of diagnostic reasoning in mammography underlies its instructional principles (multiplicity, activeness, accommodation and adaptation, and authenticity) and methods (including modelling, coaching, fading of assistance, structured problem solving, and situated learning).
Comparison between the MR Tutor and Other Systems In this paper we describe a system, the MR Tutor, that teaches a structured approach to lesion description. It is based on a constructivist approach to learning, whereby the trainee is helped to acquire a well-structured approach to describing abnormal features of images by engaging in an active process of case-based reporting. The MR Tutor differs from other computer-based training systems for radiology in three fundamental ways: − Its teaching and diagnostic support is based on a consistent and diagnostically powerful Image Description Language (IDL). − It implements a novel method of visualisation, the overview plot, to display the distribution of cases across diseases. − It utilises statistical-based models of similarity, typicality and disease categorization estimated from an archive of expert case descriptions and diagnoses. It enables the trainee to explore the archive, by viewing the cases according to similarity and typicality on the plot, by inspecting the MR images for selected cases, and by comparing their structured case descriptions. For any case, the system offers a teaching session in which the trainee is guided towards a full and correct description using the terminology of the IDL. This paper provides an overview of the system requirements, structure, functions and interface of the MR Tutor and then describes the system in terms of the distinguishing aspects of its design. It concludes with the findings of a formative evaluation of the system and plans for future development.
System Requirements The specific requirements for the MR Tutor were derived through socio-cognitive engineering: a process of describing and analysing the complex interactions between people and computer-based technology so as to inform the design of socio-technical systems that support human work, learning, communication and culture [14]. The investigations have included an analysis of the literature on cognitive and perceptual processes of medical image interpretation and the task of radiological reporting; detailed observations of reporting and radiological training in two medical institutions (a general teaching hospital and a specialist imaging centre); and interviews with trainee radiologists, consultants and lecturers to elicit differing conceptions of training practice, issues of concern and opportunities for introducing new technology in support of training [15]. The main findings of these studies are summarised here. Radiological expertise is based on two kinds of skill: the swift and accurate processing of normal appearance, and the ability to distinguish disease from normal variation in appearance [16]. Thus, skill development in radiology requires exposure to, and
— 3 —
reporting of, a large range of images, so that recognition of varied normal anatomy becomes automatised and cognitive resources can be devoted to the process of describing abnormal appearance. Lesgold et al. [17] propose that radiologists carry out a multi-stage process of interpretation. On first seeing a film they automatically invoke a mental schema that covers the salient abnormal features, resulting in one or more tentative diagnoses. This triggers a process of active search for other cues in the image along with case data and medical knowledge that might constrain the interpretation. Lastly, they articulate their findings as a verbal report. A more recent study by Azevedo and Lajoie [18] indicates that perception and problem solving are tightly coupled, with experts creating an active mapping between their perception of the visual image and their evolving hypotheses about competing diagnoses. Our own investigations support these accounts of radiological reporting. They also confirm the two main teaching events identified by Azevedo and Lajoie of guiding junior residents systematically through the interpretation process and of scaffolding the interpretation of more senior trainees by offering hints and indications of where to direct attention. In summary, our investigations indicated that a computer system to support the training of radiologists should: − base the training on a large library of cases representative of radiological practice; − provide a means of making rapid comparisons between cases by similarity of diagnostically relevant features; − expose the trainee to cases in an order that promotes understanding and retention; − help the trainee to make rapid, accurate initial judgements; − help the trainee to integrate fragmentary knowledge into more general structural schemata; − help the trainee to reflect on experience gained and to integrate general and situated knowledge; − be implemented on a personal computer, for use as part of self study at home or work. The current MR Tutor, as described in this paper, meets these criteria. The training is based on an archive of 1200 cases, fully described in the terms of the IDL, that constitute a representative sample of the patient clientele from two different imaging centres (a specialist tertiary referral centre and a more general imaging centre) dealing with very varied disease. The current system displays all cases for two diseases from the archive and further disease sets are being added. The trainee can make rapid comparisons between cases by selecting them from the overview plot and viewing their associated images and structured descriptions. The system teaches a consistent method of reporting based on a structured language, supported by a context-sensitive help system giving precise definitions of terms, to help the trainee acquire a structural schema for describing abnormal images. It relates the trainee’s description to other cases in the archive by means of a visual display that helps the trainee reflect on the experience of describing each case. It is implemented in Java and runs on personal computers.
— 4 —
Overview of the MR Tutor The training provided by the MR Tutor has a number of pedagogic aims. The first is to help the trainee to acquire and apply a structured language for describing abnormal features of MR images of the head. The second aim is to help trainees to gain an appreciation of the range, distribution and variability of features presenting with a particular disease. A third aim is to help the trainee to discriminate between confusable diseases. We intend to carry out a series of studies, using the MR Tutor as a test environment, to investigate these aims. The system is intended for trainees in the specialism of neuroradiology. These are highly educated professionals who have already gained a medical qualification and experience in general radiology. They have intrinsic motivation and at least a basic competence in working with computer-based technology. Computer-based “coached practice” environments such as SOPHIE [19] SHERLOCK [20] and IDM [21] are examples of successful systems for training in complex skills. The theory of cognitive apprenticeship [22] that underlies these systems is appropriate for training in the professions and has informed the design of the MR Tutor. Figure 1 here
Structurally and in presentation to the user the MR Tutor is divided into two main modules (shown on the left and right sides of Figure 1), to enable the trainee to explore the archive of cases and to engage in case based training. Both modules request images and structured descriptions from the case archive and interact with the user through a common graphical interface. The basic operation is that a) the user explores the case archive, b) either the user or the computer selects a case for teaching, c) the user describes the case using the terminology of the IDL and receives tutorial feedback from the system. Figure 2 shows the main flow of tasks supported by the system, though the user may at any point break the flow and switch tasks.
Figure 2 here The interface of the prototype MR Tutor is divided into two halves that indicate its two main functions (see Figure 3). The right side of the screen allows the trainee to interact with the image archive through an interactive “overview plot” that provides a direct representation of typicality, similarity and category membership of the cases. It is computed automatically from the structured descriptions of the lesions and enables a trainee to view the distribution of cases within and across diseases. The plot can be interpreted as a “radar screen” with each point representing a case from the archive. The small crosses represent the centres of disease categories and the ellipses show scaled “contours of typicality” for the categories. The closer a case point lies to the centre of a disease category, the more typical it is of that disease (in terms of the abnormal image features it shares with other members of that disease category). The closer any two cases are to each other, the more similar are their abnormal features. Thus, a trainee can see directly whether any case is typical or atypical of a disease, the similarity between any pair of cases, and whether an outlier (atypical) case belongs unambiguously to one disease or if lies in the space between two or more disease regions and thus may be difficult to diagnose.
Figure 3 here
— 5 —
For the initial prototype system, fifteen T2 weighted representative examples of glioma and eight examples of infarcts have been selected from the archive. The images are displayed at 256 by 256 pixel size. The overview plot for the glioma and infarct case space is shown at the lower right of Figure 3, with gliomas shown as dark points and infarcts as light points. The trainee selects a case to examine by clicking on a point in the overview plot. The associated stack of images then appears in the pane at the top middle right of the screen. A control panel enables the trainee to move up and down the slices and to “window” an image by adjusting its grey levels. The trainee can call up similar cases, and more or less typical ones, by selecting other appropriate points on the plot. Slices can be dragged to the “gallery” below the main image pane. The left half of the screen is the interface to the tutoring component. Either the trainee or the system can select a case for tutoring (a “target case”). This can be viewed and windowed as for the reference images, so the trainee can make visual comparisons between the target case and any reference cases. The trainee describes the target case by selecting terms from pop-up menus of feature descriptors. A contextdependent help system offers a definition of each term from the image description language, to assist the trainee to enter a full and accurate description. As the trainee works through a description the system gives a response in two forms. When the trainee moves the mouse cursor over a menu of feature descriptors (e.g. the terms for “location” shown in Figure 3) the system “lights up” those points on the overview plot that correspond to cases in which the indicated feature is present. This shows at a glance the position of the case being tutored relative to those with a particular feature. User trials have suggested that this is a useful facility for beginning users but makes the task of describing a case too easy for more expert trainees, so future versions will provide a means to disable the feature as the teaching progresses. The second type of feedback is provided by a written tutorial response generated by the system. The system gives a confirming or remedial message each time the trainee completes a section of the structured description. A typical response is as follows: You have correctly identified the following locations: Cerebral white matter However, you have incorrectly identified the lesion as being in the following areas: Cortical grey matter And omitted the following areas: Periventricular Central grey Brainstem or cerebellum Now describe the exterior margin of the lesion. Indicate to what extent the lesion is distinct form normal tissue
— 6 —
When the description is complete, the system adds a point to the overview plot that corresponds to the trainee’s description. This enables the trainee to make a visual comparison with the point that represents the expert description for the case. It shows, for example, whether the trainee’s description is more or less typical than the expert description and where it lies in relation to cases for candidate diseases. The trainee can then make further attempts to describe the case until the description matches that of the expert, when the trainee’s case point will appear in the same position as the expert’s. At any time the trainee can give up and request the Tutor to show the expert’s description of the case in the menu window. The MR Tutor has been implemented in Java. All the facilities described in the Overview of the MR Tutor section have been implemented. Running on a Toshiba Tecra 8000 laptop computer (Pentium II 233 MHz processor, 127Mb RAM) the delay for the slowest operation (loading a new case and displaying the first image) is less than 1 second.
Structured Reporting and the Image Description Language Although there is no standard method of describing abnormalities in MR neuroradiological images, there is widespread agreement on the need to develop a more structured approach to the description of lesions, so that radiologists can exchange findings in an agreed language using terms that have been precisely defined. CT and MRI have provided opportunities to describe in formal terms and in great detail the positions and features of brain lesions and to calculate disease probabilities or to index image features for teaching purposes. Despite the hopes of some for a unified language to describe medical images [23], most progress has been made in description menus applied to a single organ or system, imaged by one imaging modality. The early work by G. du Boulay on diagnostic assistance for brain diseases evolved into a collaborative research project to develop image description languages for CT and MR images of the head. This has continued over eighteen years and involves the Medical Systems Group, De Montfort University, and the Institute of Neurology, London. A study of CT brain scans led to the development of a structured description process for CT images and a menu-based computer advisor (BRAINS) to aid in image interpretation and cerebral disease diagnosis [24]. An independent evaluation of that project [25] involved 10 users of various levels of expertise, each describing up to 20 cases. It identified the training benefits of a structured approach to reporting linked to a reference set of annotated example images and diagrams. The language for MR has been derived using an iterative prototyping approach. The initial specification of the description language was based on observation, transcription and protocol analysis of focused discussions between G. du Boulay, Emeritus Professor of Neuroradiology at the Institute of Neurology, and D. P. Kingsley, a senior neuroradiologist, during the examination of a representative sample of abnormal MR images. The language was then applied to a set of ten cases which were reviewed by both observers for accuracy and completeness. The language was subsequently further developed in consultation with Kingsley and G. du Boulay. A new sample of 66 cases was described in the terminology of the lDL by du Boulay, and rated by him for
— 7 —
accuracy and completeness. This led to further refinements as a result of information regarding the inadequacies of the prototype IDL in describing these cases. The IDL describes the appearance of the images rather than the underlying disease, though the ontology of the language is influenced by a knowledge of diagnostically important disease processes. There are 183 individual values in the full description language. Figure 4 gives a list of its main category headings. Figure 4 here
The analytical power of the IDL has been partly tested by its application to the differentiation between multiple sclerosis (MS) and vascular disease [3] and the effects of HIV infection on the brain [4]. Further insights into the predictive power of combinations of features will emerge as part of the continuing statistical analysis of the data, including the application of Multiple Correspondence Analysis [26] (the basis of the overview plot methodology described later). The language is particularly suited to computer implementation, since it provides a canonical set of feature descriptors that can be stored as schemas for each case where the image features are represented by slots whose fillers indicate feature values (e.g. lesion margin: graded). The terms of the IDL are supported by precise definitions and, for lesion shape, by indicative examples. To test the methodology, a simplified version of the description language has been used in the current prototype training system, based on the main category headings of the full IDL. It provides an initial set of terms to support discussion and sharing of knowledge amongst trainee neuroradiologists and their supervisors. It also serves as a structured representation of knowledge for the MR Tutor, enabling it to generate remedial responses to student errors. Figure 5 shows the terms of the simplified language and Figure 6 shows a description of a case using the simplified language. Figure 5 here Figure 6 here
The Overview Plot: Visualisation and Interaction with the Case Library The acquisition of skill in radiology involves integrating knowledge gained from viewing and reporting individual cases into general schemas covering diagnostic categories, enabling judgements to be made of the likelihood of possible abnormalities. We propose that the process of building disease schemas can be aided by providing, as part of training, visual indications of the distribution of cases by disease category, spatially organised according to similarity, typicality and category membership. To test this proposal we have developed a novel interactive overview plot (see Figure 3) that enables a trainee to view a given case in relation to other cases of the same and related diseases. The plot is based on a statistical model of the distribution of cases within categories, where each category represents one disease. The model provides operational definitions of typicality, similarity and graded category membership. It enables estimates to be computed of the probability of feature profile given disease p(f|D). The model can also be used in a non-independent Bayesian procedure to give estimates of disease given a feature profile p(D|f), thus providing diagnostic advice for a given case.
— 8 —
Each case in the archive is associated with an expert description formed from the terms of the image description language. The case description is stored as an array of features where each feature value is coded as a binary variable indicating its presence or absence in the image (e.g. “lesion margin graded: present”; “lesion margin sharp: absent”). Ordinal attributes (such as “size”) are coded by dividing them into ranges of values and representing each range as a corresponding binary variable. The benefits of this approach compared to scalar representations are that nominal and ordinal features can be combined into a single feature list, without the necessity to create contrived and incommensurable scales. The description language defines a multi-dimensional space, where each dimension represents one feature value with two states, present or absent. We can consider a case as representing a single point in the space and a category as occupying a region. For the simplified language used in the prototype MR Tutor, the space has 30 dimensions. To allow a trainee to visualise the distribution of cases, it is necessary to simplify the presentation of these multiple dimensions whilst retaining the most useful information. The statistical technique of multiple correspondence analysis (MCA) [26] provides such a visualisation. Simple two dimensional scatterplots are a well established statistical technique for viewing bivariate data. The benefit of the MCA is that it can project a multi-dimensional space onto a two-dimensional surface, such that the data points are maximally spread over the surface. Computed values of typicality and similarity can be presented as direct perceptual relationships. A case that lies near the centroid of a category can be interpreted as being highly typical of that category, whereas a case nearer to the periphery is less typical. The similarity of any two cases within a particular category is indicated by the spatial distance between their two points. A cluster of points indicates a group of cases of similar appearance. The plot is scaled such that the same perceptual distance between cases represents an increasing degree of similarity as one moves out from the centre of a category. This matches the psychological finding that people can make finer similarity judgements for more typically encountered cases [27, 28]. To assist judgement, we have augmented the plot by showing “contours of typicality” for disease categories, based on a bivariate normal model of the distribution of cases for a particular disease in the overview plot [29]. As a means of visualising and interacting with libraries of cases, the overview plot offers a number of benefits: − It is a representation across all the variables rather than a small selection of terms. − It can be applied to a mixture of ordinal and categorical features. − The data points are maximally spread out over the display surface. The degree of spread does not depend merely on the position of outliers. These can influence the spread, but the method summarises the main source of variation of all the variables. The plot allows outliers to be identified, in a more sophisticated manner than with univariate plots. − It gives a direct perceptual overview of the typicality, similarity, spread and clustering of cases, and overlap of categories.
— 9 —
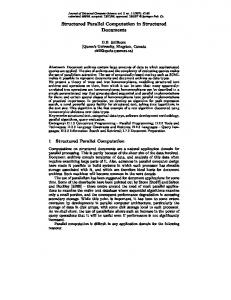
− An image description can, in principle, be generated for any position in the plot. If the position does not correspond to one of the stored cases, then the description can be computed by interpolation from nearby cases. The mapping from a position in the plot to a description is one-to-many and heuristic methods would be required to select the most plausible description. − The plots can be pre-computed automatically from the feature arrays. − For a large sample, new cases can be added without the need to recompute the plot (the distribution of a large sample is not markedly affected by the addition of a small number of extra cases). The simplified version of the image description language was used to generate the initial overview plots for the Tutor, but the method can be scaled to the full IDL. The plot for a single disease category, glioma, is shown in Figure 7. Annotations have been added to the figure to indicate the distribution and clustering of cases. As the figure shows, the MCA has separated out a cluster of cases with lesions that exhibit a focal structure. The vertical dimension has further divided the cases, primarily according to size of lesion. Figure 7 here
Cases from further diseases could be added to the plot until it displays the entire archive. However, there is no diagnostic value in plotting within a single space of dissimilar diseases. Instead, we have adopted the “small worlds” metaphor [30]. We divide the archive into small sets of confusable diseases and compute separate overview plots for each of these disease sets. Figure 8 shows an example of an overview plot for combined glioma and infarct cases. The display indicates that there is a cluster of cases in the centre of the plot that cannot easily be distinguished as gliomas or infarcts. It also shows a number of outlying cases that, although they are atypical, should present no difficulty in a differential diagnosis of glioma or infarct (they may, however, be confusable with other diseases). It should be noted that the two axes of the plot summarise the main source of variability in the data. Adding a third orthogonal axis might provide some improved separation of the diseases; this could be investigated for pairs of diseases using statistical methods and, if appropriate, presented as an additional plot of the 2nd and 3rd principal dimensions. Figure 8 here
The display provides an easy method of accessing cases from the archive. A trainee can call up the images and structured description for a case by clicking on its point in the overview plot. The display can also enable a trainee to explore the relationship of a case description to cases in the archive or to disease categories. For example, a trainee can investigate and eliminate differential diagnoses by describing a target case and viewing its position on the overview plot for candidate diseases.
Evaluation A heuristic evaluation [31, 32] of the MR Tutor was undertaken to assess the overall usability, intuitiveness and efficacy of the system and its interface. The evaluation involved three expert neuroradiologists from The Institute of Neurology, London and
— 10 —
four Human Computer Interaction (HCI) experts from the School of Cognitive and Computing Sciences, University of Sussex. Each subject was given a 20 minute tutorial on the interface actions to demonstrate the functionality of the MR Tutor. The subjects were then asked to undertake a set of three tasks for which the system was designed (for example to retrieve a typical example of a given disease from the archive and describe the appearance of the lesion). The subjects were asked to comment on any problems they encountered with regard to eight heuristics, based on those proposed by Nielson and Molich [31]. The heuristics were: visibility of system status; match between the system and the real world; user control and freedom; consistency and standards; intuitiveness; speed and ease of use; aesthetic and uncluttered design; help and documentation. The subjects also filled in a questionnaire to ascertain their overall impression of the system. The questionnaire provided evidence relating to overall usability and intuitiveness of the user interface of the MR Tutor. The HCI subjects recorded a mean score of 3.96 for overall level of satisfaction (on a 5 point scale) and the radiologists gave a mean score of 4.13. The HCI subjects indicated that the system conforms to good practice in interface design and were pleased with the overall look and feel of the interface. All subjects described the screen layout as good and aesthetically pleasing Although the interface and system were in general well received, the subjects offered useful suggestions for improvement. For example, radiologists suggested providing additional imaging sequences to give context to the target case, and also providing a slightly larger image. The radiologists indicated that the image description language is adequate for initial tutoring, but suggested that some of the terminology used to describe the lesion appearance needed to be further validated, especially with regard to lesion size and shape. The HCI subjects suggested that, although the menu area was clear, well structured and well laid out, there appears to be a basic flaw in the action of submitting an answer in the menu area by pressing the next major heading button. All the HCI subjects found this confusing, although it was surprising that none of the radiologist subjects commented on this problem and generally liked the menu area. The overview plot was found to be an intuitive and useful way of retrieving cases from the archive. An initial evaluation of the overview plot [33] involved the expert providing subjective ratings (on a scale from 0 to 100) of similarity between the images for a sample of 8 cases taken from the Glioma disease space. The expert’s subjective assessments of similarity were in good agreement the scores based on the Euclidean distances between the sample cases on the overview plot, with Spearman's Rank Correlation (rho) of 0.754 demonstrating a highly significant correlation p