PHYSICAL REVIEW PHYSICS EDUCATION RESEARCH 12, 010106 (2016)
Student reasoning about graphs in different contexts Lana Ivanjek, Ana Susac, Maja Planinic,* and Aneta Andrasevic Department of Physics, Faculty of Science, University of Zagreb, Bijenicka 32, HR—10000 Zagreb, Croatia
Zeljka Milin-Sipus Department of Mathematics, Faculty of Science, University of Zagreb, Bijenicka 30, HR—10000 Zagreb, Croatia (Received 20 September 2014; revised manuscript received 6 July 2015; published 16 February 2016) This study investigates university students’ graph interpretation strategies and difficulties in mathematics, physics (kinematics), and contexts other than physics. Eight sets of parallel (isomorphic) mathematics, physics, and other context questions about graphs, which were developed by us, were administered to 385 first-year students at the Faculty of Science, University of Zagreb. Students were asked to provide explanations and/or mathematical procedures with their answers. Students’ main strategies and difficulties identified through the analysis of those explanations and procedures are described. Student strategies of graph interpretation were found to be largely context dependent and domain specific. A small fraction of students have used the same strategy in all three domains (mathematics, physics, and other contexts) on most sets of parallel questions. Some students have shown indications of transfer of knowledge in the sense that they used techniques and strategies developed in physics for solving (or attempting to solve) other context problems. In physics, the preferred strategy was the use of formulas, which sometimes seemed to block the use of other, more productive strategies which students displayed in other domains. Students’ answers indicated the presence of slope-height confusion and interval-point confusion in all three domains. Students generally better interpreted graph slope than the area under a graph, although the concept of slope still seemed to be quite vague for many. The interpretation of the concept of area under a graph needs more attention in both physics and mathematics teaching. DOI: 10.1103/PhysRevPhysEducRes.12.010106
I. INTRODUCTION Student understanding of graphs is very important in all areas of science, especially physics and mathematics. Many student difficulties with graph interpretation were documented and identified in studies that were carried out in physics (mostly kinematics) [1–6] or mathematics [7–13]. Overall, the findings of both physics and mathematics education research were rather similar and pointed to the presence of similar student difficulties in both domains. Leinhardt, Zaslavsky, and Stein [9] classified student difficulties with graphs as interval-point confusions, slopeheight confusions, and iconic confusions. Iconic confusion is usually characteristic of younger students, although traces of it can be found also in older populations, sometimes even university students [1,3]. It consists of students’ incorrect interpretation of the graph as an actual picture of the motion. Students who show this difficulty will tend to *
Corresponding author.
[email protected] Published by the American Physical Society under the terms of the Creative Commons Attribution 3.0 License. Further distribution of this work must maintain attribution to the author(s) and the published article’s title, journal citation, and DOI.
2469-9896=16=12(1)=010106(13)
interpret, for example, a curved v vs t graph as representing the motion along a curved trajectory. Such students do not yet see the graph as a symbolic representation of an abstract relationship between the variables on its axis, but as a concrete picture of a body’s motion. It is therefore difficult for them to see why the graph should change if the variables on the axes change, and they will generally expect the graph to remain the same. The slope-height confusion happens when students mistake the height of the graph for its slope [1,3,9]. For example, when asked to reason about the slope of a graph, students sometimes just read off the y coordinate (the height of the graph at the point of interest). If they observe, for example, the constant diminishing of the y coordinate of the graph they usually conclude that the slope of the graph shows the same behavior (e.g., the slope of the straight line constantly diminishes, because the y coordinate constantly diminishes). The interval-point confusion refers to the cases where students focus on a single point of the graph when they should be using an interval. This difficulty will be displayed, for example, when students attempt to determine the slope of a graph from one point only, instead of choosing two points and calculating Δy=Δx. Slope-height and interval-point confusions are quite common among
010106-1
Published by the American Physical Society
LANA IVANJEK et al.
PHYS. REV. PHYS. EDUC. RES 12, 010106 (2016)
students at the high school and university level [1,3,4,9,13–15]. Few studies, to our knowledge, attempted to compare student reasoning difficulties about graphs in different contexts and domains [14–16]. Such comparison, on the other hand, can provide interesting and important insights into student knowledge and learning. The study of Wemyss and van Kampen [15], in which first-year university students solved three different context problems including line graphs, found that the number of students’ correct answers to a problem involving a water level vs time graph, which students had not encountered in the formal educational setting before, was much higher than the number of correct answers to the supposedly more familiar problem of determining the speed of an object from a distance-time graph. The reason for students’ poorer performance on physics problems was attributed to students’ reliance on learned procedures in physics (e.g., use of formulas). This study also found evidence that students’ mathematical knowledge of slope does not guarantee their success on problems involving slope in kinematics. Similar conclusions followed also from our previous study on high school students’ understanding of a line graph slope [14]. The problem of transfer of knowledge between mathematics and physics was addressed also in cognitive psychology, unrelated to graphs. One study that investigated interdomain transfer between isomorphic topics in algebra and physics (kinematics) found very high transfer from algebra to physics, but almost no transfer from physics to algebra, and suggested that “transfer from physics to other domains is blocked by the embedding of physics equations within a specific content domain” [17]. The problem of domain specificity of knowledge is not limited to physics; it is also present in mathematics [18]. Michelsen [18] suggests that it is not just the mathematical formalism that presents a barrier in learning physics, but that there is also the missing link between mathematics and physics. He suggests that the mathematical domain should be expanded by using examples from physics and from everyday life contexts in mathematics teaching, in order to solve the problem of domain specificity. In such an expanded domain, modeling of real life situations could be a way of bridging the gap between mathematics and physics. In summary, existing research seems to indicate that students have many difficulties with understanding of line graphs, but also that the context of a problem may influence the choice of students’ strategy, as well as the type of difficulties which will be expressed. Problem context can, therefore, influence its difficulty. In a previous paper [16], of which this one is a sequel, we have described the first part of the study that attempted to compare first-year university students’ performance on mathematically similar problems, which were situated in mathematics, physics, and other contexts (parallel or
isomorphic problems). The analysis of item difficulties of eight sets of parallel problems pointed to the higher difficulty of problems that involved some context (either physics or other context), compared to direct mathematical problems on graphs. The added context generally increased the difficulty of parallel problems with regards to mathematics, because problems including context required more steps in solving (interpretation and translation of context into mathematical language and vice versa). The analysis also suggested that the concept of slope seemed to be better understood than the concept of area under a graph. In the same study students also gave explanations for their answers, which provided additional insight in the reasoning strategies that they used in different domains, but also in their conceptual and reasoning difficulties regarding graphs. These strategies and difficulties will be described and analyzed in the present study, which attempts to identify the main student strategies, as well as students’ reasoning difficulties, expressed on parallel graph problems, and to answer the following research questions: (i) How consistent are students in their choice of strategies and solutions to parallel questions in different domains and contexts? (ii) What are the main observed student difficulties in each domain and how do they relate to the context of the questions? II. THEORETICAL BACKGROUND There is still some debate going on among researchers in physics education about the nature and origin of student difficulties in physics, and the structure of students’ naive knowledge. The two opposing views are sometimes described [19] as knowledge as theory [20–21] and knowledge as elements [22–24]. The first one sees naive knowledge as highly organized and interconnected, containing firm beliefs or ideas inconsistent with the accepted physics knowledge, known as misconceptions or alternative conceptions [20–21], and the other one sees naive knowledge as a set of relatively loosely connected knowledge elements, whose activation is very context dependent [22–24]. In the knowledge-as-elements perspective, the displayed difficulties reflect students’ inappropriate or simplified reasoning patterns, which originate from using basic reasoning elements called phenomenological primitives (p prims), which are in themselves neither correct nor incorrect [22]. Which knowledge or reasoning elements will be activated in a certain situation depends largely on the context of the problem and on students’ framing of the problem [24]. Framing means that students consciously or unconsciously make choices as to what knowledge to activate and use, based on their perception of the situation and on the social and cultural expectations. Student responses are dynamically created in response to their perception of the task [24]. The question of transfer of knowledge, which is usually defined as the ability to extend
010106-2
STUDENT REASONING ABOUT GRAPHS IN …
PHYS. REV. PHYS. EDUC. RES 12, 010106 (2016)
what has been learned in one context to new contexts [25], is then replaced with the question of which cognitive resources will be considered appropriate by the student in a given problem, and, therefore, activated. That will largely be determined by the context and domain of the problem. The two perspectives on students’ naive knowledge might also have different consequences for teaching: the first one would require replacing firm incorrect ideas with scientific ones through the radical process of conceptual change, whereas the other one would focus more on refinement of knowledge and appropriate use of reasoning elements [19]. Many studies that have looked for transfer of knowledge have usually come up with mostly negative results, which may be due, among other things, also to the design of those studies [26]. Bransford and Schwartz [26] have suggested shifting the view on transfer from the direct application perspective (successful application of knowledge acquired in one context to similar problems in different contexts) to a more dynamical view of preparation for future learning (PFL). The PFL perspective can be demonstrated through the questions about and approaches to the new problem, which were shaped and influenced by the previous learning, even if students are not able to completely solve the new problem. The PFL perspective is very important for learning, because it reveals more about students’ useful learning trajectories than the direct application perspective. The focus is not only on what students can or cannot directly transfer and solve, but whether students are able to learn while they transfer. In this way, transfer can be considered a dynamical way of reconstructing knowledge [27] rather than just an application of previously acquired knowledge in a different situation. This dynamical view of transfer is in agreement with the knowledge-as-elements perspective, because it assumes activation of different knowledge elements in a new context and dynamical creation of the response on the spot. III. DATA COLLECTION AND ANALYSIS Eight sets of parallel mathematics, physics, and other context questions about graphs were developed by us and described in the previous paper on graphs in different contexts [16]. The complete test can be accessed through the link at Ref. [28]. Five sets of questions referred to the concept of graph slope, and three to the concept of area under a graph. One set of questions is presented in Fig. 1. Four sets of questions were in a multiple choice format, and four sets were open ended. In addition to choosing the correct answer in multiple choice questions, or providing the answer in open-ended questions, students were asked to provide explanations for their answers and/or necessary calculations where appropriate, so that the insight into the underlying student reasoning could be obtained. The labels of questions are given in Table I. Questions with the same
two last labels are parallel in content (e.g., PS1, MS1, and CS1). The test consisting of those eight sets of questions was administered to 385 first year students at the Faculty of Science, University of Zagreb in Zagreb, Croatia. Students were either prospective physics or mathematics teachers, or prospective physicists or mathematicians. Students received some credit points for writing explanations (regardless of their correctness) and/or for required calculations. The tests were scored by us and first analyzed in terms of item difficulties over different domains and conceptual areas. The results of that analysis were presented in the previous paper [16]. In the present study, each student explanation provided with the answers was carefully analyzed and categorized. The categorization process followed the general guidelines for analyzing verbal data [29]. By reading a sample of student answers, insights into their thinking and into the most frequent approaches to problems were obtained. The strategies suggested by those answers then received codes, but the answers also provided examples of what constitutes evidence for a certain strategy. That would be applied to new data, which would usually contain some new examples of student thinking, which required either expanding or refining of prior operationalization of evidence for a certain category, or introduction of new categories or subcategories. Coding was refined through several passes through the data. Two of us coded data separately (L.I. and A.A. coded slope categories, and A.S. and A.A. coded area categories). Differences and ambiguities in coding were discussed and resolved at meetings of us. The categories were, in principle, different for each set of questions, although some of them appeared on multiple questions. Different categories reflect different student strategies, some correct, and some incorrect. Sometimes a student answer suggested more than one strategy, and was accordingly assigned to two categories. The data were finally summarized in tabular form, and patterns in the data were detected and interpreted. At this point, some of the less frequent categories were merged into larger categories to make the general patterns in the data more noticeable. Based on the frequency of students’ use of different strategies, several incorrect strategies were recognized as possible indications of underlying student difficulties with graph interpretation, and will be analyzed in the next section. To assess the measure of association between student answers in different domains (as a possible indication of transfer of knowledge), the phi coefficients for different pairs of student answers to questions from the same set were calculated [30]. The phi coefficient is a special case of the Pearson product-moment correlation coefficient, which is most useful for determining the intercorrelation between the responses of subjects on two dichotomous test items
010106-3
LANA IVANJEK et al.
PHYS. REV. PHYS. EDUC. RES 12, 010106 (2016)
FIG. 1. An example of one set of parallel questions.
[30]. For this analysis, each student answer to a test question was assigned 1 if the answer was correct, and 0 if it was incorrect. The correctness of the answer was determined on the basis of both the given answer and the accompanying explanation or procedure. The phi coefficients were then calculated, and their significance was evaluated. Cohen [31,32] has proposed the following phi values as criteria for identifying the magnitude of an effect size: small effect size for 0.10 ≤ Φ < 0.30; medium effect size for 0.30 ≤ Φ < 0.50; large effect size for Φ ≥ 0.50. High phi values for two questions do not automatically indicate the use of same strategies, but low values probably suggest different strategies. In addition, the number of students who have used the same strategy in different domains was determined for each set of questions.
TABLE I.
Labels of questions in the test.
Mathematics Physics Other contexts
Slope questions
Area questions
MS1 to MS5 PS1 to PS5 CS1 to CS5
MA1 to MA3 PA1 to PA3 CA1 to CA3
IV. RESULTS AND DISCUSSION A. Student strategies and difficulties concerning graph slope Student strategies on slope questions are presented in Fig. 2 as well as in Table A in the Supplemental Material [33]. We will shortly describe each one of those strategies. 1. The use of formula (correct or incorrect) One of the most common strategies on slope problems was the use of formulas, which could have been either correct or incorrect. This strategy was most prominent, as expected, on the first set of questions (S1), where calculation of slope was required. The use of formulas dominated in all three domains (mathematics, physics, and other contexts) on that set of questions (Table A [33], Fig. 2), but the formulas that were used were different in each domain. On mathematics question MS1, students mostly used various mathematical formulas for a straight line to calculate slope. On parallel physics question PS1, 49% of students used incorrect or inappropriate formulas for acceleration. The leading incorrect formula in physics was a ¼ v=t, which was used by 41% of all students.
010106-4
STUDENT REASONING ABOUT GRAPHS IN …
FIG. 2.
PHYS. REV. PHYS. EDUC. RES 12, 010106 (2016)
Overview of different strategies on slope questions and their frequencies (the number of students who used them).
On parallel other context question CS1, students usually constructed a formula, either correctly (31%) or incorrectly (40%). Of the incorrectly constructed formulas, the most common ones (derived by 68% of students who constructed an incorrect formula or 27% of all students) were of the form k ¼ y=x. Set S1 was the only set in which formulas were necessary, but they were also used on sets S2 and S5, which asked for qualitative comparison of slopes of straight lines (S2), or comparison of the slope of a straight line and the slope of a curve at a point (S5). Even though no computation was required on set S2, some students decided to use formulas in their argumentation (21% in mathematics, 44% in physics, and 8% in other context). On physics question PS2, the dominant strategy was the use of formulas for acceleration, but half of the students who used that strategy, used an incorrect formula, mostly a ¼ v=t. The use of formula also appeared as one of the two main incorrect strategies on set S5, mostly pronounced on physics question PS5, where 18% of students calculated x=t at the point of intersection of the straight line and the curve to justify the equality of velocities at that point. 2. Reasoning on the basis of rise over run Qualitative reasoning on the basis of rise over run was present on questions S2–S4. On set S2 students mostly reasoned on the basis of rise over run on other context question CS2, when comparing the increase of the prices of the two stocks in the same interval of time. It was the most prominent correct strategy on set S3, where students concluded that the slope was negative when the ordinate
value y of the graph decreased with increase in the value of x. Similar reasoning was used by students on set S4 to explain the negativity of the line graph slope. 3. Relating or identifying slope with the angle between the straight line and one of the axes or steepness Many students made conclusions about slope on the basis of the size of the angle between the straight line and the horizontal coordinate axis, or referred to graph’s steepness in their explanations. Some students (7%) explicitly identified the slope with that angle on MS1, whereas for others who used angle-based reasoning, the same mistake remains a possibility which we can suspect, but cannot be sure of. The angle-based reasoning usually led students to the correct qualitative conclusions about slope. It was especially prominent on set S2, where comparison of the slopes of two straight lines was required. 4. Reasoning about slope on the basis of graph appearance On sets S3 and S4, the slope of the line graph, and especially its sign, was evaluated by many students through reasoning based on the graph’s appearance. Explanations for negativity of slope were characterized by unclear expressions, such as “the graph/straight line is going down/descending,” suggesting that the idea of negative slope may be vague for those students, and that they probably only memorized the rule that the slope is negative for descending straight lines. Regarding the aspect of constancy of slope on set S4, this strategy very likely
010106-5
LANA IVANJEK et al.
PHYS. REV. PHYS. EDUC. RES 12, 010106 (2016)
indicated the presence of slope-height confusion, although it was not explicitly expressed. 5. Applying factual knowledge that a straight line has constant slope
tangent line to the curved graph, and to compare its slope to the slope of the straight line (there were also a few attempts to use calculus). This strategy was specific only for set S5, which was the only set that involved a curved graph. B. Student strategies and difficulties concerning the area under a graph
The constancy of the graph’s slope was explained in many cases (30% on MS4, 18% on PS4, and 18% on CS4) only by stating that the slope of the straight line is constant, as an application of factual knowledge without further argumentation.
Student strategies concerning the area under a graph are presented in Fig. 3, as well as in Table B in the Supplemental Material [33].
6. Identifying slope with the height of the graph
1. Calculation of the area under a graph
Confusing the slope of the graph with its height is a wellknown student difficulty, which was found also in this study. The constant decreasing of the height of the graph was a very strong and easily recognizable visual cue on set S4, and it may have triggered slope-height confusion in some students. The main incorrect strategy, present in all three domains on set S4, consisted of identifying the decreasing graph height with the slope, and, consequently, interpreting the values of the slope of each straight line as also constantly decreasing (Fig. 2, Table A [33]). Typical explanations for this type of answer were like the following: “We see from the graph that velocity was decreasing over time, so it was the same with acceleration”. It is likely that many more students who did not provide explanations on set S4, but only chose the answer that slope was decreasing, had very likely made the same error (altogether 20% in mathematics, 29% in physics, and 26% in other context). On set S3, the main observed difficulty was that students sometimes identified the sign of the slope with the sign of the y coordinate (about 10% in physics and mathematics, but 22% in other context), which may also be regarded as a special case, or a consequence, of slope-height confusion. The following student’s explanation illustrates this difficulty:
Calculation of the area under a graph using formulas from geometry (Fig. 3, Table B [33]) was the most frequently used strategy on mathematics area questions, as expected, since it was explicitly invoked in the formulation of those questions. Calculation of the area under a graph was in itself not the main problem for students, as can be concluded from the low difficulties1 of problems MA1–MA3 [16] relative to difficulties of questions from the other two domains. It is still worth noting that a nonnegligible fraction of students had trouble identifying and/or calculating correctly the required areas on items MA1 (13%), MA2 (29%), and MA3 (41%), or that 8% of students on CA1, as well as 11% of students on MA3, read off the wrong number from the graph. On physics and other context problems, calculation of the area under a graph was used far less frequently, since solving those problems first required interpreting the area under a graph as the quantity of interest, which turned out to be the main source of difficulty in those problems. Typically 10%–25% of students calculated area on physics and other context questions, compared to 80%–90% on mathematics questions. The largest number of students who calculated the area under the graph on nonmathematics questions was found on question PA1, which asked for the determination of the covered distance on the basis of the v vs t graph. This might be explained by the fact that most students are explicitly taught in high school physics courses to find the covered distance by calculating the area under the v vs t graph, whereas the interpretation of area under a vs t graphs is usually not discussed.
“The growth rate of GDP is negative between 2006. and 2010, because GDP is negative in that period”. On set S5, 15% to 23% of students concluded that the slope of the straight line and the slope of the tangent line on a curve were equal at the point of intersection of the straight line and the curve. This may also suggest slope-height confusion, since students seemed to conclude that equal heights meant equal slopes, although it remains possible that some of those students chose the point of intersection only because it was the dominant visual cue in S5 problems.
2. The use of physics formulas The most frequently used strategy on physics questions was the use of physics formulas, but far more often incorrectly than correctly (Fig. 3, Table B [33]). It was 1
7. Identifying the slope of a curved graph at a point with the slope of the tangent line at that point Practically the only correct strategy, used on set S5 by 41%, 37%, and 34% of students on mathematics, physics, and other context questions, respectively, was to draw a
We can note that the questions in mathematics treated only the calculation of the (positive) area under the linear graph. Other aspects of the reversed problem of differentiation (slope), that is, the adequate understanding (applied to linear graphs) of the notion of indefinite integral and the fundamental theorem of calculus, including the aspect of accumulation, were not investigated through mathematics questions.
010106-6
STUDENT REASONING ABOUT GRAPHS IN …
FIG. 3.
PHYS. REV. PHYS. EDUC. RES 12, 010106 (2016)
Overview of student strategies on area questions and their frequencies (number of students who used them).
the leading strategy on PA1 (55%). Some of the kinematics formulas that students were frequently using produced the correct result on PA1, but not on PA2 and PA3. On sets A2 and A3, the leading strategy on physics questions was also the use of formulas (52% and 41%, respectively), whereas in other contexts it was the calculation of the area under a graph (16% and 25%) (Fig. 3, Table B [33]). On both sets A2 and A3, the other context question was solved correctly more often than the physics question, the main reason being that students often relied on incorrect formulas on physics questions. Incorrect and misapplied formulas were quite common. For example, on question PA2, 18% of students used the formula Δv ¼ ΔaΔt, 20% used Δv ¼ v2 − v1 ¼ a2 t2 − a1 t1 , and 6% of students used v ¼ at. These formulas reflect, among other things, students’ poor understanding of the symbol delta (Δ). Some students occasionally tried to construct their own formulas on other context questions and others sometimes tried to apply some physics formulas (correctly or incorrectly). The wording of the question may also have played a role in students’ choice of strategies. On question CA1 (Fig. 1) the Croatian word for rate was the same as the word for speed (brzina), which has triggered the use of physics kinematics formulas in some students to describe the rate of change of water level, and helped them to solve the problem correctly. 3. Reading off values from the graph Both physics and other context questions triggered the use of a variety of less frequent strategies which included reading off some values from the graph, mostly the y
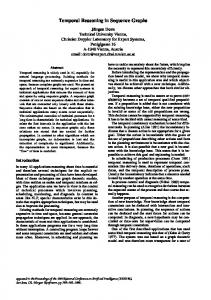
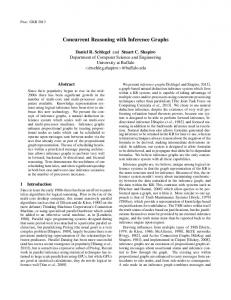
coordinate, with little or no further processing. On CA1 (which asked for the total change of the water level of a river), the leading strategy (used by 22% of students) was simply to read off the maximum value from the ordinate axis. Some students came to the idea of multiplication, usually through some kind of dimensional analysis (Fig. 4), and they multiplied the x and y values. The fact that some questions (CA1 and PA2) asked for the change of quantities has possibly increased the use of an incorrect strategy, which consisted in simply reading off the change in the y coordinate from the graph (Fig. 3, Table B [33]). 4. Fitting a new scale to the graph and some other less frequent strategies Since PA3 and CA3 included in their formulation an initial value of the unknown quantity (velocity or rental price), they have both triggered a similar incorrect strategy, used by about 10% of students in each domain. It consisted of fitting a new scale to the ordinate axis of the graph, by assigning, for example, the initial value of velocity to the value of acceleration at t ¼ 0 on the graph, and then reading off from the graph the rescaled value of velocity at the required instant (Fig. 5). It seems that students who used this strategy expected the graph to remain the same regardless of what quantities were on graph axes, and/or attempted again to misuse proportional reasoning. An example of student explanation on PA3 illustrates this difficulty:
010106-7
LANA IVANJEK et al.
PHYS. REV. PHYS. EDUC. RES 12, 010106 (2016)
FIG. 4. The response of one student to question CA1, indicating dimensional analysis which led student to the idea of multiplication. The variables on the axes of the graph are time and water level rate of change.
“Acceleration has decreased by half at 7 s, so the velocity did also, because these quantities are proportional.” On other context questions students had no ready-made formulas to use, so they seemed to think more creatively, generated more strategies, and therefore managed to solve problems more often than in physics (although not too often in general). Some students tried to construct their own formulas, correctly or incorrectly. Some used an intuitive idea of accumulation on area problems and approximated the area under a graph with a sum of areas of narrow rectangles (5% on CA3). Others (e.g., 4% on CA3) used the average value of the quantity presented in the graph (e.g., average bus rental price per km in CA3) to calculate the required quantity (e.g., total price of bus rental). C. Consistency of students’ strategies in different domains Two indicators were used to probe students’ consistency in the strategies and solutions to parallel problems in
different domains: phi coefficients, which indicate the association of students’ final answers to parallel questions, and the number of the same strategies used on different combinations of parallel questions. Both were typically rather low, as is suggested by Figs. 6 and 7, as well as Table C and Table D in the Supplemental Material [33]. The association of student answers on sets S1–S3 was low (Fig. 6, Table C [33]), and the use of the same strategies (Fig. 7, Table D [33]) was below 15%, except for physics and other contexts, where it ranged between 18% and 31% (when correct and incorrect strategies are added). This suggests that most students probably saw the parallel questions from sets S1–S3 as different, and approached them with different strategies. Set S4 is characterized by a medium association of student answers (Fig. 6, Table C [33]), suggesting the possibility that students were more likely to recognize similarities between the questions of set S4 than those of the sets S1–S3. On the whole, set S5, which was the second most difficult set of slope questions (after S1, the calculation of slope) [16], was also the set of questions with the most pronounced association between
FIG. 5. An example of student answer to question CA3, where student fitted a scale of velocities on the graph of acceleration vs time, and determined the velocity at t ¼ 7 s as 15 m=s from the initial velocity of 30 m=s.
010106-8
STUDENT REASONING ABOUT GRAPHS IN …
PHYS. REV. PHYS. EDUC. RES 12, 010106 (2016)
FIG. 6. Phi coefficients for each set of slope questions, indicating association of student answers to different combinations of questions (e.g., mathematics and physics, physics and other contexts, mathematics and other contexts).
student answers (Fig. 6, Table C [33]), with phi coefficients indicating strong effect size. The use of similar strategies in different domains was also more frequent on set S5 than on the other sets of slope questions (Fig. 7, Table D [33]), displayed by 31%–51% of students on different combinations of two domains. The reason for that could be that the curved graphs from set S5 stood out among line graphs and enabled students to recognize similarities of the questions more readily than in other sets of questions. For area questions, the association between student answers to mathematics questions and questions from any of the other two domains were quite low. The phi coefficients suggest small effect size [32]. On all three sets of area questions, the strongest association was found between student answers to physics and other context questions (Fig. 6, Table C [33]). The phi coefficients and the number of students who used the same strategies on different combinations of questions usually seem to tell the same story, except in a few cases.
FIG. 7.
Figure 7 indicates somewhat larger numbers of the same strategies on different domain area questions (typically between about 10% and 20%, with the exception of 27% on MA1 and PA1) than would be expected from phi coefficients alone. This might be due to a distinct asymmetry in student answers: mathematics questions were solved correctly by most students, and physics and other context questions were rarely solved correctly, so phi coefficients could not find a correlation between final answers in mathematics and the other two domains. On the other hand, the association of answers between physics and other context questions is more pronounced, because when students solved either physics or other context problems of a certain set correctly, they often solved the other one as well. D. Main findings Main findings 1–3 answer the first research question and main findings 4–6 the second research question.
Number of students on each set of questions who used same strategies in different combinations of domains.
010106-9
LANA IVANJEK et al.
PHYS. REV. PHYS. EDUC. RES 12, 010106 (2016)
1. Strategies used on parallel questions are often context dependent and domain specific Only a small fraction of students typically used the same strategy on all three questions of the same set of questions (Fig. 7, Table D [33]), although some have used the same strategy on two of the three questions. It seems that in many cases students perceived the questions from the same set as different and approached them in different ways. The strategy that was used usually depended on the domain and the context of the problem, with the exception of set S5, and to a lesser extent set S4. Students seem to apply similar strategies in different contexts more often on problems for which they do not have firmly established domain specific (mathematics or physics) procedures, and/or where visual cues more strongly suggest similarity. On set S5 students might have recognized the similarity between the three questions of the set more easily than on other questions, because the curved graphs stood out among other graphs which were all straight lines. Also, since their knowledge about curved graphs was probably quite limited, the students were more likely to transfer the little that they knew from one domain to another, or—if they had no knowledge about the slope of curved graphs at all—to use the same wrong strategy on at least two, or even all three questions (Fig. 7, Table D [33]). On area questions, the most important difference in strategies was found between physics and other context questions. In physics, students usually relied on physics formulas. On other context questions students did not have formulas to use, so they were forced to find other approaches. The choice of strategy depended in some cases also on the formulation or wording of a problem, as a part of the context of the problem. Formulation of problems is very important, since it can trigger the use of some new solving strategies, enhance or impede transfer of knowledge, and determine which cognitive resources will be activated and used. It seems that if students acquire domain specific procedures for solving a certain class of problems (such as determining the slope of the straight line in mathematics with the use of mathematical formulas or calculating acceleration in physics with the use of physics formulas), they will tend to stick to those procedures, and will generally not seem to recognize the mathematical similarity of the problems in different domains. This may be an indication of the absence of transfer of knowledge between the domains, but it could also be a consequence of students’ different learning experiences in different school subjects, where they had implicitly learned that each discipline has its own language and conventions, and that they have to answer questions in the way that the particular discipline requires. So, for example, if they had perceived a question as a mathematical one, they might have felt obliged to answer it in a “mathematical way.” This could have been an
indication of the problem of framing [24]. How students framed the problem may have determined their choice of strategy for its solving. 2. The preferred strategy on physics questions seems to be the use of formulas (often incorrect ones) Even though students demonstrated that they were capable of using different strategies for reasoning about graphs, the preferred strategy in physics domain tended to be the use of formulas (Figs. 2,3; Tables A, B [33]). On all area problems and some slope problems, students chose the use of formulas as the main strategy for solving physics problems. On sets A1–A3, the use of formulas was by far the most frequent strategy in physics. However, that strategy was not very productive, since the formulas that were used were most often incorrect or inappropriate, and produced wrong solutions. Students often applied incorrect formulas, such as a ¼ v=t, or started with the correct formula a ¼ Δv=Δt, but then continued to use it as a ¼ v=t. Some students tried to apply formulas that were inappropriate for accelerated motion problems, such as, for example, v ¼ s=t. The application of the incorrect or inappropriate formulas led students to many incorrect conclusions on physics questions, even on the questions where calculations were not necessary, e.g., slope question S2. At the same time, it was not uncommon for students to give correct answers to parallel questions in mathematics and other contexts domains, demonstrating that they were able to reason correctly about the same problem in a different context. Another problem that was striking is that students very often did not seem to understand either the meaning, or the area of applicability of formulas they were using in physics. The very extensive use of the formula a ¼ v=t on the test indicates that many students may not have understood the very meaning of the concept of acceleration (as the rate of change of velocity), and therefore cannot be expected to understand its representation as the slope of the v vs t graph. All these findings suggest that students mostly do not see formulas as mathematical models of physical situations and have many problems with their interpretation and understanding. Translating physics into mathematics is not an easy task for students, as some previous studies on modeling in physics and student understanding of physics equation have already shown (e.g., Refs. [34,35]). 3. Students use more creative strategies on other context problems than on physics problems Other context problems seemed to activate more of students’ cognitive resources, and students displayed a wider variety of strategies on those problems than on physics problems. About twice as many students came to the idea to calculate the area under a graph on questions CA2 and CA3 than on PA2 and PA3 (Fig. 6, Table B [33]). Some students came to that idea on other context questions
010106-10
STUDENT REASONING ABOUT GRAPHS IN …
PHYS. REV. PHYS. EDUC. RES 12, 010106 (2016)
by using some form of dimensional analysis, which led some only to the conclusion that multiplication is needed, and others to the idea of calculating the area. Dimensional analysis is an approach primarily developed in physics, but surprisingly students did not use the same approach on physics questions. A lot of students’ ideas in solving other context problems actually originated from what they had learned in physics, so they could be regarded as examples of transfer of knowledge in the sense of “preparation for future learning” [26]. There have been cases of negative transfer as well, such as the inappropriate use of the formula v ¼ s=t, or of misuse of proportional reasoning, which is not uncommon [36]. Many of the student approaches to other context problems could have helped them to solve physics problems as well, but the reliance on formulas as the primary strategy in physics prevented students from using other approaches of which they were capable. Some instances of transfer of knowledge in the sense of preparation for future learning were evidenced in students’ use of knowledge and techniques (e.g., dimensional analysis, modeling) acquired in one domain (usually physics) in some other domain (usually other context questions). Some students seemed to think more creatively and used more of the available resources on other context questions, than on the physics questions, where they seemed to be bound too much by how they perceived the conventions of the discipline. 4. Students show similar difficulties with graph interpretation in all domains Iconic confusion, slope-height confusion, and intervalpoint confusion can be considered a form of naïve reasoning in which students misapply certain elements of reasoning, or use simplified reasoning schemes [9]. In this study we have observed interval-point confusions and slope-height confusions, while iconic confusions were very rare. The same patterns of naïve reasoning were present in all three domains, but not equally often in each one of them. This is something that we had already noticed in a previous study on high school students’ understanding of line graph slope, for the domains of physics and mathematics [14]. Slope-height confusion was most clearly displayed on set S4. The visual cue in this set of questions (the decreasing height of the graphs) was very strong, and it seems that students primarily relied on it when concluding incorrectly that the slope, or some slope-related quantity, such as acceleration, was decreasing. The difference between physics and mathematics was present (29% in physics, and 20% in mathematics), although it was not as large as in high school students, where 68% of students displayed slope-height confusion in physics and 33% in mathematics [14].
On set S2 students most clearly exhibited interval-point confusion when reasoning about slope on the basis of the formula a ¼ v=t, which was in most cases the only explanation that was given. The use of this formula suggests that students do not distinguish point from interval, and do not know when to use one or the other. The same happened in mathematics and in other contexts, where they sometimes used y=x or price/time to determine slope. However, while 20% of students displayed this difficulty on question PS2, only 1% of students displayed it on MS2 and CS2 questions. This can be attributed partly to students’ reliance on formulas in physics, but partly also to their insufficient understanding of the rate concept, as well as of the symbol delta. 5. Slope is a vague concept for many students; calculating slope seems to be the most difficult aspect of the concept When students just use the word slope in an explanation, we cannot always be sure what they mean, and whether their meaning of slope is consistent with the concept definition. On all mathematical slope questions students quite often gave unclear or no explanations (Fig. 2, Table A), which indicated that they did not know how to explain the concept of slope. However, in physics and in other contexts they would sometimes refer to slope in their explanations. If students use the word slope, even in a seemingly correct way, instructors should not automatically assume that students therefore fully understand the meaning of the concept. Student explanations on mathematics slope items revealed that for many students slope may not be more than the vague notion of how steep a straight line is, sometimes identified with the angle that the straight line forms with one of the coordinate axis. In problems which demand only qualitative comparison of slopes, this may often be enough to give the correct answer. However, when it comes to calculating slope, this vague idea no longer helps. Slope calculation was required only in set S1. This was the most difficult slope item in physics and the other context domain, and the second most difficult slope item in mathematics [16]. Even though students did not do too well on determining slope in the mathematics domain, they did even worse in other domains. The percentage of students who know how to determine slope mathematically (54%) is roughly the same as was found in two other studies on firstyear university students [3,15]. An important aspect of the understanding of the concept of slope is the understanding of the meaning of negative slope. Negative slope is obviously more difficult to understand than positive slope. On sets S3 and S4 students displayed some of their difficulties. It seems that students who used vague explanations of negative slope on the basis of graph appearance (e.g., “straight line is going down”) do not fully understand the concept, but have some visual rule for recognizing it.
010106-11
LANA IVANJEK et al.
PHYS. REV. PHYS. EDUC. RES 12, 010106 (2016)
6. Interpretation of the meaning of the area under a graph is very difficult for students Most students know how to determine the area under a graph, but the interpretation of the meaning of that area seems to be a much bigger problem. This was already suggested by the very large difference in difficulty between mathematics area questions and area questions from the other two domains in the previous study [16], but also confirmed in this one by the explanations given to all area items. It was noticed that few students can interpret areas under graphs in situations other than those previously encountered. Unlike slope, whose meaning is more often discussed during teaching, and encountered in a greater variety of situations than the area under a graph, interpretation of area seems to be limited to a few isolated examples in physics (such as “covered distance is calculated as the area under the v vs t graph”), learned without sufficient understanding and without the necessary reasoning required to transfer that knowledge to other situations. It is interesting that students are more likely to come to the correct interpretation of area on other context questions than in physics, because in physics they often seem to be blocked in their thinking by their overreliance on formulas. V. CONCLUSIONS We have attempted to analyze and compare student reasoning (their strategies and difficulties) on mathematically similar problems, situated in different domains and contexts. The analysis of student explanations, which accompanied their answers to test questions, suggested that student reasoning about problems is often very much bound by the contexts and conventions of the disciplines in which their knowledge was acquired. The observed dependence of student strategies on the domain and context of the questions seems to support the knowledge-in-pieces framework, which explains this dependence through context-dependent activation of cognitive resources and the importance of framing. The study revealed some differences between student understanding of the concept of graph slope and the concept of area under a graph. Although we can say generally that the concept of graph slope seems to be better understood than the concept of area under a graph, we have still noticed that for many students the concept of slope may be quite vague and needs refinement and strengthening. The area under a graph seems to be very difficult for students to interpret in unfamiliar situations. An important implication for physics teaching is that we
should work more on building student reasoning, which leads towards the interpretation of area (which is essentially the idea of integral), and not only provide ready-made interpretation for specific cases in physics. That could also help later to strengthen student understanding of the concept of a definite and indefinite integral in mathematics. Students seemed to think more freely and creatively, and to transfer more of their knowledge, in problems which in their perception probably did not fall in the category of either physics or mathematics (other contexts problems). Other context problems may have a potential to expose and develop student reasoning more than the standard domain—specific mathematics and physics questions. They should be used more, in both mathematics and physics teaching. Both disciplines should work more on establishing links between common concepts and procedures in mathematics and physics and promote their integration in students’ minds to a much larger extent than is the case now. Students’ almost exclusive reliance on formulas in physics presents, in our opinion, an important obstacle for the development of students’ deeper reasoning in physics, and sometimes even an obstacle for the application of their already existing knowledge and reasoning developed in other domains. This study confirms once again that human knowledge is very complex and multifaceted. Whenever we are trying to probe or assess student knowledge we should be aware of that fact. The problem lies not only in the quantity and quality of knowledge, but also in its accessibility. It is possible to pose basically the same problem three times, as we have done in this study, and to get three very different answers from the same student. The context and formulation of the question, students’ framing of the question, the procedures and conventions of the domain in which a certain piece of knowledge was first acquired, the existing or missing links between the domains—all that and much more contributes to the form and content of the student answer. Using many contexts during teaching, and constantly building links between different domains, could be a good way to building stronger student knowledge. ACKNOWLEDGMENTS This research is funded by the Ministarstvo znanosti, obrazovanja i sporta Republike Hrvatske (Ministry of Science, Education and Sport of the Republic of Croatia), Project No. 119-0091361-1027, and Sveučilište u Zagrebu (University of Zagreb), Project No. 202667.
010106-12
STUDENT REASONING ABOUT GRAPHS IN …
PHYS. REV. PHYS. EDUC. RES 12, 010106 (2016)
[1] L. C. McDermott, M. L. Rosenquist, and E. H. van Zee, Student difficulties in connecting graphs and physics: Examples from kinematics, Am. J. Phys. 55, 503 (1987). [2] R. J. Beichner, The effect of simultaneous motion presentation and graph generation in a kinematics lab, J. Res. Sci. Teach. 27, 803 (1990). [3] R. J. Beichner, Testing student interpretation of kinematics graphs, Am. J. Phys. 62, 750 (1994). [4] P. A. Forster, Graphing in physics: Processes and sources of error in tertiary entrance examinations in Western Australia, Res. Sci. Educ. 34, 239 (2004). [5] I. S. Araujo, E. A. Veit, and M. A. Moreira, Physics students’ performance using computational modeling activities to improve kinematics graphs interpretation, Comput. Educ. 50, 1128 (2008). [6] D. H. Nguyen and N. S. Rebello, Students’ understanding and application of the area under the curve concept in physics problems, Phys. Rev. ST Phys. Educ. Res. 7, 010112 (2011). [7] W. M. Christensen and J. R. Thompson, Investigating graphical representations of slope and derivative without a physics context, Phys. Rev. ST Phys. Educ. Res. 8, 023101 (2012). [8] T. Dreyfus and T. Eisenberg, On difficulties with diagrams: theoretical issues, in Proceedings of the Fourteenth Annual Conference of the International Group for the Psychology of Mathematics Education, edited by G. Booker, P. Cobb, and T. N. De Mendicuti (PME, Oaxtepex, 1990) Vol. 1, pp. 27–36. [9] G. Leinhardt, O. Zaslavsky, and M. K. Stein, Functions, graphs, and graphing: Tasks, learning, and teaching, Rev. Educ. Res. 60, 1 (1990). [10] P. Swatton and R. M. Taylor, Pupil performance in graphical tasks and its relationship to the ability to handle variables, Br. Educ. Res. J. 20, 227 (1994). [11] T. Graham and J. Sharp, An investigation into able students’ understanding of motion graphs, Teach. Math. Appl. 18, 128 (1999). [12] D. Kerslake, Graphs, in Children’s Understanding of Mathematics: 11–16, edited by K. M. Hart (John Murray, London, 1981), pp. 120–136. [13] C. Hadjidemetriou and J. S. Williams, Children’s’ graphical conceptions, Res. Math. Educ. 4, 69 (2002). [14] M. Planinic, Z. Milin-Sipus, H. Katic, A. Susac, and L. Ivanjek, Comparison of student understanding of line graph slope in physics and mathematics, Int. J. Sci. Math. Educ. 10, 1393 (2012). [15] T. Wemyss and P. van Kampen, Categorization of first-year university students’ interpretations of numerical linear distance-time graphs, Phys. Rev. ST Phys. Educ. Res. 9, 010107 (2013). [16] M. Planinic, L. Ivanjek, A. Susac, and Z. Milin-Sipus, Comparison of university students’ understanding of graphs in different contexts, Phys. Rev. ST Phys. Educ. Res. 9, 020103 (2013). [17] M. Bassok and K. J. Holyoak, Interdomain transfer between isomorphic topics in algebra and physics, J. Exp. Psychol. Learn. Mem. Cogn. 15, 153 (1989).
[18] C. Michelsen, Expanding the domain—variables and functions in an interdisciplinary context between mathematics and physics, in Proceedings of the 1st International Symposium of Mathematics and its Connections to the Arts and Sciences, edited by A. Beckmann, C. Michelsen, and B. Sriraman (The University of Education, Schwäbisch Gmünd, Germany, 2005), pp. 201–214. [19] G. Özdemir and D. B. Clark, An overview of conceptual change theories, Eurasia J. Math. Sci. & Tech. Ed. 3, 351 (2007). [20] M. T. H. Chi, Commonsense conceptions of emergent processes: Why some misconceptions are robust, J. Learn. Sci. 14, 161 (2005). [21] S. Vosniadou, Capturing and modeling the process of conceptual change, Learning Instruc. 4, 45 (1994). [22] A. A. diSessa, Toward an epistemology of physics, Cognit. Instr. 10, 105 (1993). [23] M. C. Linn, B. Eylon, and E. A. Davis, The Knowledge Integration Perspective on Learning, in Internet Environments for Science Education, edited by M. C. Linn, E. A. Davis, and P. Bell (Lawrence Erlbaum Associates, Mahwah, NJ, 2004). [24] D. Hammer, A. Elby, R. E. Scherr, and E. F. Redish, Resources, framing, and transfer, in Transfer of Learning from a Modern Multidisciplinary Perspective, edited by J. Mestre (Information Age Publishing, Greenwich, CT, 2005), pp. 89–120. [25] J. D. Bransford, A. L. Brown, and R. R. Cocking, How People Learn: Brain, Mind, Experience, and School (National Academy Press, Washington, DC, 1999). [26] J. D. Bransford and D. L. Schwartz, Rethinking transfer: A simple proposal with multiple implications, Rev. Res. Educ. 24, 61 (1999). [27] L. Cui, Assessing college students’ retention and transfer from calculus to physics, Ph.D. thesis, Kansas State University, 2006. [28] http://journals.aps.org/prstper/supplemental/10.1103/ PhysRevSTPER.9.020103/Planinic_TEST_PRST_PER.pdf. [29] M. T. H. Chi, Quantifying qualitative analyses of verbal data: A practical guide, J. Learn. Sci. 6, 271 (1997). [30] D. J. Sheskin, Handbook of Parametric and Nonparametric Statistical Procedures (Chapman & Hall/CRC, London, 2000). [31] J. Cohen, Statistical Power Analysis for the Behavioral Sciences (Academic Press, New York, 1977). [32] J. Cohen, Statistical Power Analysis for the Behavioral Sciences, 2nd ed. (Lawrence Erlbaum Associates, Hillsdale, NY, 1988). [33] See Supplemental Material at http://link.aps.org/ supplemental/10.1103/PhysRevPhysEducRes.12.010106 for Tables A–D. [34] T. Erickson, Stealing from physics: Modeling with mathematical functions in data-rich contexts, Teach. Math. Appl. 25, 23 (2006). [35] B. L. Sherin, How students understand physics equations, Cognit. Instr. 19, 479 (2001). [36] D. De Bock, W. Van Doren, and L. Verschaffel, Students’ overuse of linearity: An exploration in physics, Res. Sci. Educ. 41, 389 (2011).
010106-13