International Journal of Information and Education Technology, Vol. 6, No. 1, January 2016
Students' Data-Driven Decision Making in HEI: The Explicit Knowledge Involved Semiu A. Akanmu and Zulikha Jamaludin
tools demand a specific InfoVis framework in the domain [8]. This must also be preceded by a study to identify the explicit knowledge expected to be utilized by its decision makers and administrators [5], [9]. This study is therefore aimed at identifying the explicit knowledge involved in HEIs students’ data-driven decision making processes. Section II and II of this paper discuss the motivation of this study and past related works on students’ data-centered knowledge discovery goals, respectively. Section IV discusses the methods used in discovering the explicit knowledge; Section V discusses the findings, while Section VI serves as the conclusion.
Abstract—Due to increase in the volume of students’ data and the limitations of the available data management tools, higher education institutions (HEIs) are experiencing information overload and constrained decision making process. To attend to this, Information Visualization (InfoVis) is suggested as a befitting tool. However, since InfoVis design must be premised on a pre-design stage that outlines the explicit knowledge to be discovered by the HEIs, so as to actualize a functional and befitting InfoVis framework, this study investigates the explicit knowledge through survey questionnaires administered to 32 HEI decision makers. The result shows that relationship between the students’ performance and their program of study is the most prioritized explicit knowledge, among others. Based on the findings, this study elicits a comprehensive data dimensions (attributes) expected of each data instance in the HEI students’ datasets to achieve an appropriate InfoVis framework that will support the discovery of the explicit knowledge. Our future work therefore include designing the appropriate visualization, interaction and visual data mining techniques that will support the explicit knowledge discovery and HEI students’ data-driven decision making types.
II. MOTIVATION OF THE STUDY Having understood the diverse applicability and indispensable usage of InfoVis, this study is motivated by the lingering problem of information overload [10] in the course of managing the data of higher education institutions (HEI). The HEI’s data is becoming increasingly difficult to analyze in view of getting previously unknown information that could assist policy and decision making in the education sectors due to its fast growing trend [11]–[14]. The currently used data management systems by the HEI are the traditional management information systems which are faced with problems of money and time wastage, loss of scientific and industrial opportunities, inability to explore heterogeneous data sources and subsequent exploit of its hidden information [15], [16]. Added to this is the usage of static statistical graphics like pie chart, bar chart and line chart. However, the multidimensionality of these datasets, its heterogeneous sources and superabundant volume has limited the success of these traditional data management systems and data representation using the statistical graphics only [17]. Other recorded cases are HEIs occasional deployment of popular statistical tools like SAS and software systems like Tableau for their operational data analysis [13]. But, the one-cut-fit-all model type of the software tools pose ineffectiveness in the decision support functionalities of the data management tools. This is because the software model is designed to fit all organizations irrespective of the difference in their intending explicit knowledge, and consequent data models. Table I shows the limitations of past works on the management of the HEI’s data. Sarker et al. [18] emphasized the role of institutional repositories in addressing the data management challenges of higher education. Their study identified that the inability to adopt new technologies, improve the quality of learning and
Index Terms—Explicit knowledge, HEI students’ data-driven decision making types, InfoVis, knowledge discovery.
I. INTRODUCTION The ever-growing nature of students’ data of HEIs has accounted for the experience of information overload, and subsequently its constraint in supporting decision making processes. This experience has restricted HEIs’ decision makers and administrators in their pursuit of making wealthy use of the students’ data. To attend to this, information visualization (InfoVis) is arguably the suitable tool that harnesses its strength in gaining insight from large multidimensional datasets and therefore aids decision making [1], [2]. Notably, InfoVis is a research domain on data analysis and knowledge discovery through visual exploration [3], [4] in view of supporting decision making. However, it is said that InfoVis cannot be functional without a pre-design stage that thoroughly investigates the explicit knowledge expected to be delivered [5], [6]. Identifying the explicit knowledge involved in the application areas of InfoVis will guide the transformation of the raw data (structured or unstructured) to meaningful information that will assist in decision making and creation of knowledge and wisdom [7]. Considering HEIs, the experience of information overload and the limitation in the currently used data management Manuscript received June 12, 2014; revised September 17, 2014. The authors are with School of Computing, Universiti Utara Malaysia, Sintok, Malaysia (e-mail:
[email protected],
[email protected]).
DOI: 10.7763/IJIET.2016.V6.661
71
International Journal of Information and Education Technology, Vol. 6, No. 1, January 2016
teaching, and design befitting curriculum can be solved by providing information repository. This repository is suggested to be shareable and accessible by all institutions and education stakeholders. In the same vein, Pocius and Reklaitis [19] asserted that information system is a strategic tool for information management and planning, and there is a cause for improving the academic studies of Lithuania’s higher institutions. Their study thus developed a university information system using web-based interfaces linked with databases. Also, Bresfelean et al. [20] suggested that with the trend of competition in the higher education environment, universities should further adopt information communication technologies (ICT). The data mining technologies which are the ICT suggested to tackle data management challenges are opined to be ineffective in managing educational capacity utilization [21]. Therefore, Bresfelean et al. [19] and Delavari et al. [9] suggested data mining tools for managerial decision making due to the enterprises’ reliance on data for strategic decision and prediction.
In essence, the fast growth of data, its heterogeneity and multidimensionality, and the consequent problem of information overload are also found in HEI. The institutional data management has been constrained by the limitations of the presently adopted information and communication technologies, and thus responsible for the unsatisfactory managerial decision and policy making process. This forms the need for further studies that will attend to data management issues of HEIs’ students’ data.
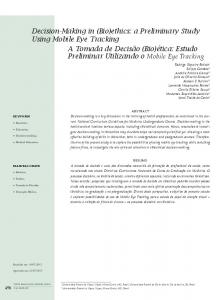
III. PAST RELATED STUDIES A content analysis of past related works on students’ data-centered knowledge discovery goals reveal the explicit knowledge expected to be delivered. Table II presents the summary. A summarized abstract model of the explicit knowledge expected to be discovered during the students’ data-centered exploratory process –as shown in the review presented in Table I above –can be infographically represented by Fig. 1 below. Students’ Performance (SP), Students’ Enrollment (SE), Students’ Majoring Courses (SM) and Students’ Health History (SH) are represented with different oval shapes, with sizes proportionally representing their priority rate.
TABLE I: LIMITATIONS OF THE PAST WORKS ON HEI’S DATA MANAGEMENT Source Nature of the Function of Limitation tool the tool Absence of For the Web-based Pocius & visualization and institutional interface for Reklaitis, exploratory data strategic data repository [18] analysis features. management and planning It does not focus on students’ data Absence of Bresfelan Data mining To proffer visualization and et al. [19] technology better interactive features curricula and syllabi design El-Fattah, [20]
Sarker et al. [21]
Delavari et al. [9]
Pinto et al. [22]
Visual Data model
Data warehousing
Data Mining technology
InfoVis
To be used in distributing teaching resources
To be used for sharing and accessing institutions’ data among the stakeholders. To give an analytical guide that will enhance decision making (a) U-map 2; (b) University Autonomy in Europe3 used for ranking financial, (c) U-Multirank4, a ranking tool (d) MAUNIMO5, it draws people’s attention to academic mobility
Fig. 1. Explicit knowledge priority rate.
IV. VALIDATING THE EXPLICIT KNOWLEDGE To validate the suggested explicit knowledge as deduced from literatures reviewed (as shown in Table II), this study designed a survey questionnaire of 29 items encapsulating the whole deduction. The instrument asks what are sought to be known by the institution’s decision makers and policy framers. These items range from the pattern of the students’ group, previous graduates, Alumni, and drop-out students, based on their races, religion, sex and nationalities, to the relationship between students’ performance and their gender, race and nationalities, and the pattern of the students’ economic status (self/family sponsored and scholarship) per enrolment. Other trends of relationship sought to know if HEIs decision makers wish to identify are the relationship between students’ mode of entry (foundation, matriculation, credit transfer), criteria set for admission, and their academic performance; relationship between the graduating students’ performance with their gender, race and nationalities; relationship between students’ course of study and their employability; relationship between students’ majoring courses and their employability; relationship between students’ performance and their lecture venue and time; relationship between students’ majoring courses and their performance; relationship between the students’ performance and their program of study (degree & graduate); relationship between the students’ performance and their mode of study (full time & part time); relationship between the majorly (or otherwise) enrolled course and the students’ performance in
Absence of exploratory data analysis and interactive features. It does not focus on students’ data. Absence of exploratory data analysis and interactive features. It does not focus on students’ data. Absence of visualization and interactive features. It does not focus on students’ data. None is focused on students’ data.
72
International Journal of Information and Education Technology, Vol. 6, No. 1, January 2016
status (self/family sponsored and scholarship) and health history.
the said course; relationship between the student performance and their English language proficiency and the relationship between drop-out students and their economic
TABLE II: THE EXPLICIT KNOWLEDGE Source
Explicit Knowledge
Delavari & Phon-Amnuaisuk, [9]
The pattern of various groups of students. The pattern of previous graduates contributions to the university. The historical relationship of the students’ score with their gender, race and attendance. Performance pattern of various students’ groups. Success history of the students. Relating their performance to their mode of entry. The success pattern of students that transferred course credits on admission. Classified pattern of previous students on the basis of their final grade. The pattern of the combination of the students’ majoring courses. Students’ performance relationship with Lectures venue and time. Students’ performance relationship with the Students’ level. Pattern of previous students with specificity to a particular program. Students’ classification based on courses offered. Using courses combination for students’ performance history. Association of Students’ health history with students’ performance pattern.
Microsoft Inc. [23]
Correlation between the students’ demographics (gender and race/ nationality) and the students’ performance. Descriptive information of the admitted students based on their racial background.
Lange, Range & Welsh [24]
Students’ learning achievement in relationship with Student learning data (norm-referenced tests, state assessments, grade distributions, Grade point averages and benchmark tests), Students’ demographic data (students’ ethnicity, socioeconomic status, language proficiency), and School demographic data (overall attendance rates, retention rates, student discipline infractions, drop-out rates, socioeconomic factors, and political factors).
Protheroe [25]
Students’ assessment data for instructional improvement, Students’ academic progress report.
Ewell [26]
Description and pattern of the Enrolments /degrees awarded graduation and retention rates, student-faculty ratios
El-Fattah [20]
Students enrollment rate, Students- Lecturer ratio, Institutions’ infrastructure info
Wagner & Ice [27]
Students’ performance pattern, Students’ achievement data and Students’ demographics data, Institutions ranking position and infrastructural index
Bresfelean, Ghisoiu, Lacaurezeanu & Sitar-Taut [19]
Students’ academic records, students’ learning data and skill acquisition history (certificate courses, workshop and symposia attended), students’ rating of the IT-supported courses, Student socioeconomic status, Courses enrollment rate, IT infrastructure utilization index.
Sarker, Davis & Tiropanis [21]
Students’ After Graduation waiting period, Alumni Feedback, Students’ academic records (potential and skill profile, academic attainment, pre-university academic records, GPA), Students retention, enrollment and employability rate
Mandinach, Gummer & Muller [28]
Courses enrollment rate, Students’ employability rate, Students’ academic profile (potential and skill profile, academic attainment), Program and course rating
Also, the trends of the students’ enrolment based on their mode of admission and gender; trend and pattern of the university’s graduating students based on gender, race and nationalities; and trend of the students’ performance in relationship with number of semester used, are parts of the explicit knowledge validated. This study also asks if the decision makers seek to know the performance of students with unfavourable health history; the courses that are majorly or otherwise enrolled by the students, if there is impact of soft skill acquisition on the students’ academic performance, and the significance of internship on the students’ employability. The items of the questionnaires are rated 1=No, 2 = I don’t
know, and 3 = Yes, and was distributed among thirty-two (32) HEI administrators and decision makers. Descriptive statistics using frequency rating was used to analyze the response in view of finding the frequency distribution of each of the item asked.
V. FINDINGS AND DISCUSSION Based on the findings of the study, items seeking to know the pattern (course of study, CGPA and nationalities) of the Alumni who are responsive to the university’s invitation; the performance of students with unfavourable health history; 73
International Journal of Information and Education Technology, Vol. 6, No. 1, January 2016
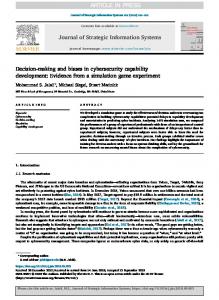
the relationship between students’ performance and their lecture venue and time; and the relationship between drop-out students and their economic status (self/family sponsored and scholarship) and health history are to be struck out of the explicit knowledge, necessarily to be covered by HEI InfoVis. Asides from the fact that our findings suggest weak importance of these items, it is also instructive to note that Alumni and health records are distinct units in HEIs and there could be understandable constraint in integrating their databases. Finally, this study found that relationship between the students’ performance and their program of study (degree & graduate) is the most prioritized explicit knowledge, followed by trend of the students enrolment based on their mode of admission, sex and gender, relationship between students’ majoring courses and their employability, the students’ performance in relationship with number of semester used and the relationship between students’ mode of entry (foundation, matriculation, credit transfer), criteria set for admission, and their academic performance. Other important explicit knowledge wished to be identified by the HEI decision makers, as shown by this study, are the pattern of various groups of students and previous graduates based on their race, religion, sex and nationalities; trend of the students; enrollment based nationalities and sex, and trend of the students enrolment based on their mode of admission and gender This shows that the findings of this study aligns with the abstracted model as earlier pointed to by the literature. Hence, for a functional and comprehensive InfoVis for HEIs, the dimensions (attributes) of each data instance of the datasets to be involved in the design framework are flanked around an avatar representing the student as shown in Fig. 2. Student ID Sex Nationality Race Religion Course of Study Majoring Field Year of Enrolment No of Semester Used Mode of Admission
on the explicit knowledge that characterizes the decision making types of the domain. Through a self-administered survey questionnaires distributed to HEIs decision makers, this study found the HEI students’ data-focused explicit knowledge and the data dimensions (attributes) that are to be included in the design of a befitting InfoVis framework. REFERENCES [1] [2] [3]
[4]
[5]
[6]
[7]
[8]
[9]
[10]
[11]
Deferment Record Current GPA Studentship status Soft Skill Record Internship Record Programme of study Mode of study Disability English Language Proficiency Mode of Sponsorship
[12]
[13]
Fig. 2. Elicited students’ data attributes.
[14]
The visualization types are to be designed based on the validated explicit knowledge and its corresponding data dimensions. Our future work is to justifiably suggest the visualization, interaction and visual data mining techniques that will appropriately attend to the elicited explicit knowledge in HEIs students’ data-driven decision making processes, and highlight the procedure of actualizing the said InfoVis.
[15]
[16]
[17]
VI. CONCLUSION
[18]
The ever-growing nature of institutional datasets, as also obtainable in HEIs and the limitation of data management tools are arguably responsible for the experience of information overload. This study has shown that InfoVis as a tool to attend to information overload must be designed based
[19]
74
C. Ware, Information Visualization: Perception for Design, United States of America: Morgan Kaufmann Publishers, 2000. R. Spence, Information Visualization: Design for Interaction, 2nd Edition, England: Pearson Education Limited, 2007. J.-D. Fekete and C. Plaisant, “Interactive information visualization of a million items,” presented at the IEEE Symposium on Information Visualization (InfoVis), 2002. B. Sheneiderman and C. Plaisant, Designing the User Interface: Strategies for Effective Human-Computer Interaction, 5th Edition, U.S.A.: Pearson Higher Education, 2010. H. Lam, E. Bertini, P. Isenberg, C. Plaisant, and S. Carpendale, “Empirical studies in information visualization: Seven scenario,” IEEE Transaction on Visualization and Computer Graphics, vol. 18, no. 9, pp. 1520-1536, 2012. L. C. Koh, A. Slingsby, J. Dykes, and T. S. Kam, “Developing and applying a user-centred model for the design and implementation of information visualization tools,” in Proc. 15th IEEE International Conference on Information Visualization, IEEE Computer Society, 2011. A. J. Stasko, “Visualization for information exploration and analysis,” presented at IEEE Symposium on Visual Languages and Human-Centric Computing, VL/HCC, 2008. A. Semiu and J. Zulikha, “Towards developing an instrument in measuring the need for InfoVis,” in Proc. Knowledge Management International Conference, Langkawi, Malaysia, pp. 247–252. Aug. 12-15, 2014. N. Delavari, S. Phon-Amnuaisuk, and M. R. Beikzadeh, “Data mining application in higher learning institutions,” Vilnus, Institute of Mathematics and Informatics, vol. 7, no. 1, pp. 31-54, 2008. D. Keim, J. Kohlhamer, G. Ellis, and F. Mansmann, Mastering the Information Age: Solving Problems with Visual Analytics, Germany, Eurographics Association, 2010. Oracle Data Sheet. (2011). Oracle Higher Education Constituent Hub (HECH). [Online]. Available: http://www.oracle.com/us/products/applications/master-data-manage ment/education-research-hech-ds-164687.pdf R. Yanosky. (2009). Institutional Data Management in Higher Education. A Report from EduCause Centre for Applied Research. [Online]. Available: http://net.educause.edu/ir/library/pdf/EKF/EKF0908.pdf C. Conrad, M. Gasman, T. Lundberg, T.-H. Nguyen, F. Commodore, and A. C. Samayoa, “Using educational data to increase learning, retention, and degree attainment at minority serving institutions (MSIs),” A Research Report of Penn Graduate School of Education, GSE, 2013. B. Gill, B. C. Borden, and K. Hallgren, “A conceptual framework for data-driven decision making,” Final Report of Research conducted by Mathematica Policy Research, Princeton, submitted to Bill & Melinda Gates Foundation, Seattle, WA, 2014. D. A. Keim, F. Mansmann, D. Oelke, and H. Ziegler, “Visual analytics: Combining automated discovery with interactive visualization,” in Proc. the 11th International Conference on Discovery Science (DS,2008), pp. 2-14 N. Williams and G. Amin, “Higher education in Sudan and knowledge management application,” Information and Communication Technologies, vol. 2, no. 1, pp. 60-65, 2006. K. Ehlers et al., “Decision support system for institutional research management in higher education: Data Mining to determine research focus, intensity and synergy,” presented at International Conference on Computational Science and Engineering, 2009. F. Sarker, H. Davis, and T. Tiropanis, “The role of institutional repositories in addressing higher education challenges,” The Second International Workshop on Semantic Web Application in Higher Education, University of Southampton, UK, 2010. K. Pocius and V. Reklaitis, “Web-based services for technology education management and planning,” in Proc. International Workshop on Advanced Learning Technologies, IWALT, 2000, pp. 284-285, 2000.
International Journal of Information and Education Technology, Vol. 6, No. 1, January 2016 [28] E. B. Mandinach. E. S. Gummer, and R. D. Muller, “The Complexities of integrating data-driven decision making into professional preparation in schools of education: It’s harder than you think,” A Report Summary, 2012.
[20] V. P. Bresfelean, N. Ghisoiu, R. Lacaurezeanu, and D. A. Sitar-Taut, “Towards the development of decision support in academic environments,” in Proc. International Conference on Information Technology Interfaces, ITI, 2009, pp. 343-348. [21] M. A. El-Fattah, “Visual model for managing educational capacity utilization in Egyptian universities,” in Proc. International Conference on Information Technology Based Higher Education and Training, pp. 1-4, 2012. [22] M. Pinto, R. Raposo, and F. Ramos, “Comparison of emerging information visualization tools for higher education,” in Proc. 16th International Conference on Information Visualization, 2012, pp. 100-105. [23] Microsoft Inc., “Data driven decision making in higher education. discover,” A White paper publication of Microsoft Incorporation, released in February, 2004. [24] C. Lange, B. Range, and K. Welsh. (2012). Conditions for Effective Data Use to Improve Schools: Recommendations for School Leaders. [Online]. Available: http://cnx.org/content/m45021/latest/ [25] N. Protheroe, “Improving teaching and learning with data-based decisions: Asking the right questions and acting on the answers,” Research Report, Education Research Centre, 2009. [26] P. T. Ewell. (2012). Using Information in Higher Education Decision-Making: Modes, Obstacles, and Remedies. [Online]. Available: www.spencer.org/resources/content/3/3/8/documents/Ewell-paper.pdf on 18/08/13. [27] E. Wagner and P. Ice, “Data changes everything: Delivering on the promise of learning analytics in higher education,” EduCause Review, pp. 33-42, 2012.
Semiu A. Akanmu had his bachelor of science (BSc) in computer science from Olabisi Onabanjo University, Ago-Iwoye, Ogun State, Nigeria, in 2008, master of science (MSc) in information technology (IT) from Universiti Utara Malaysia, Sintok, Malaysia, in 2013, and presently a doctor of philosophy (PhD) student in the same institution. Semiu’s PhD thesis centred on developing an information visualization conceptual design framework for HEIs, with research interest in visual analytics and users’ experience. He is also a member of Institute of Electrical and Electronics Engineers (IEEE). Zulikha Jamaludin had her BSc, MSc and PhD degrees in computer science from University of Lancaster, University of Exeter, United Kingdom (UK) and Universiti Sains Malaysia, Malaysia, respectively. She is presently a full professor at School of Computing, Universiti Utara Malaysia. Her research areas of interest are in human computer interaction, users’ interface design and interaction design. She has supervised many postgraduate researches and chaired numerous viva sessions. She is a member of Association of Computing Machineries (ACM), and a member of Emerald Literati.
75