Chapter 11. 232. Example 11.1. Data from population-based cancer registries
located throughout the world were used to examine international variations in
can-.
Chapter 11
Studies based on routine data Routine-data-based studies are characterized by the fact that data on both the exposure(s) and the outcome(s) of interest are obtained from routine data-collection systems (e.g., cancer registries, hospital registries, death notification, etc.). Thus, studies of this type can be carried out relatively quickly and cheaply, without the need to contact the study subjects. Their main limitation, however, is that the number of variables available from routine surveillance systems is generally limited. Studies based on routine data can be carried out at an individual or at an aggregated level.
11.1 Individual level Most routine data-collection systems collect data on personal attributes such as age, sex, place of birth, place of residence, occupation, etc. Cancer occurrence can then be examined in relation to these variables, either to search for patterns that may suggest etiological hypotheses or to confirm a specific hypothesis.
11.1.1 Place of residence Routine-data-based studies of the variability in cancer incidence across the world have given an indication of the extent to which environmental factors are implicated in the causation of each cancer type (Example 11.1). Examination of geographical variations in cancer incidence may provide important etiological clues and stimulate further investigations. Cancer of the oesophagus is one of the cancer sites with the most striking patterns of geographical variation. Its incidence varies sharply from one area to another, with foci of very high risk completely surrounded by areas of very low risk. The remarkable geographical variation in the risk of this cancer in central Asia (Example 11.2) stimulated the conduct of a series of cross-sectional and case–control studies in northern Iran with the specific aim of investigating possible risk factors. These studies were interrupted in 1978 by the civil unrest in the area but initial results suggested a strong association with a diet poor in vegetables and with the use of opium (Joint Iran–International Agency for Research on Cancer Study Group, 1977). Part of the international differences in cancer risks may be genetic rather than environmental. But for many cancer sites, there are still marked variations in incidence within countries, even when their populations are genetically fairly homogeneous. The distribution shown in Example 11.3 was initially assumed to be due 231
Chapter 11
Example 11.1. Data from population-based cancer registries located throughout the world were used to examine international variations in cancer incidence. For most cancer sites, there was a more than ten-fold variation between the highest and the lowest recorded incidence rates (Table 11.1). Table 11.1. International variations in recorded incidence for selected cancer sites: the highest and lowest rate among all the population-based cancer registries included in Cancer Incidence in Five Continents, Vol. V. Rates per 100 000 pyrs, age-standardized to the world standard population.a
Cancer site (ICD 9 code) Lip (140) Tongue (141)
Males Highest Lowest rate (H) rate (L)b
H:L ratio
Highest rate (H)
Females Lowest rate (L)b
H:L ratio
15.1
0.1
151
1.6
0.1
16
9.4
0.4
24
3.4
0.2
17
Mouth (143–145)
13.5
0.5
27
15.7
0.2
79
Nasopharynx (147)
30.0
0.3
100
12.9
0.1
129
Pharynx (146, 148–149)
31.3
0.4
78
4.3
0.2
22
Oesophagus (150)
29.2
1.2
24
12.4
0.3
41
Stomach (151)
82.0
3.7
22
36.1
3.0
12
Colon (153)
34.1
1.8
19
29.0
1.8
16
Rectum (154)
21.5
3.0
7
13.4
1.3
10
Liver (155)
34.4
0.7
49
11.6
0.4
29 14
Larynx (161) Lung (162) Melanoma of skin (172) Breast (174/175)
17.8
2.2
8
2.7
0.2
110.0
5.8
19
68.1
1.2
57
30.9
0.2
155
28.5
0.2
143
3.4
0.2
17
93.9
14.0
7
Cervix uteri (180)
–
–
–
83.2
3.0
28
Ovary (182)
–
–
–
25.8
3.3
8
Prostate (185) Testis (186) Bladder (188)
91.2
1.3
70
–
–
–
8.3
0.6
14
–
–
–
27.8
1.7
16
8.5
0.8
11
Nervous system (191–192) 9.7
1.1
9
10.0
0.8
13
Non-Hodgkin lymphoma
11.4
1.5
8
8.7
0.9
10
4.8
0.5
10
3.9
0.3
13
(200, 202) Hodgkin’s disease (201) a
Data from Whelan et al. (1990).
b
Rates based on less than 10 cases were excluded.
to consumption of home-produced apple cider. Normandy and Brittany are the only French provinces where apple cider is produced in considerable quantities and this beverage is largely consumed in the provinces themselves (Tuyns et al., 1983). Further research has shown that all types of alcoholic beverage appear to increase the risk of oesophageal cancer.
11.1.2 Place of birth and ethnicity People who migrate from one country to another have lifestyle characteristics that are a combination of those prevailing in the host country and those from their homeland. Thus, evidence of a gradient of increasing, or decreasing, risks between population of origin, migrants and the 232
Studies based on routine data
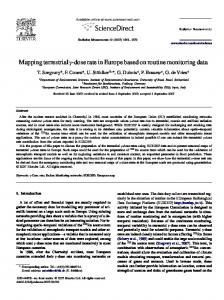
Example 11.2. Data from local cancer registries were used to examine the geographical distribution of oesophageal cancer in central Asia (Muñoz & Day, 1996). The results from this analysis showed that the incidence of this cancer was extremely high in an area encompassing Kazakhstan, Uzbekistan and Turkmenistan, the north-east of Iran and northern Afghanistan (Figure 11.1). Incidence per 100 000 pyrs. < 10 10 – 29 30 – 79 Tatarskaya
> 80
Chelyabinsk
Suspected high incidence
Kuybychev
Pavlodar
Kustanay
Orenburg
Saratov
USSR Kokchetav
Bashkirskaya
Tselinograd
Aktuybinsk
USSR
Semipalatinsk
Uralsk
Volvograd
K A Z A K H S T A N
Black Sea
Karaganda
Astrakhan Kalmytskaya
Europe
Taldy-kurgan
Kzyl orda
Guryev Azerbaidjan
Karakalpak
Dzambul
Alma ata
Chimkent Kirgizistan
Georgia
Uzbekistan
Bukhara Samarkand
Turkmenistan
Turkey
Tashkent
Tadjikistan
Namangan Andizhan Fergama
China
Armenia Ardebil Gilan
Gonbad Gorgan Mazandaran
Syria Afghanistan Iraq
India
Iran Pakistan
Mediterranean Sea
Caspian Sea
host population can suggest or confirm the importance of environmental factors over genetic factors in the etiology of a particular cancer. This approach can be refined by adding a time component to it. The degree of cultural integration into the host country can be measured indirectly by information on age at migration and/or time since migration. In Example 11.4, European immigrants were at lower risk of dying from melanoma than the Australian-born, particularly southern Europeans. This finding may reflect the protective effect of darker complexions. The data also suggested that migration in childhood was associated with a higher risk than migration later in life, but it is difficult to separate this effect from that of duration of stay (i.e., migration at an early age was inevitably associated with a longer stay than migration at an older age).
Figure 11.1. Oesophageal cancer among men in central Asia. Incidence rates age-standardized to the world standard population (reproduced, by permission of Oxford University Press, from Muñoz & Day, 1996).
233
Chapter 11
Example 11.3. Routinely collected mortality data were used to examine the geographical distribution of oesophageal cancer in Brittany and the Normandy departments of Calvados and Orne (Figure 11.2). Although rates in most cantons were similar to the average rate in France, in some cantons in eastern Brittany and north-western Orne, mortality was five to ten times higher (Tuyns & Vernhes, 1981). Figure 11.2. Age-standardized mortality rates for cancer of the oesophagus among males, by canton in (a) the Normandy departments of Calvados and Orne (reproduced with permission from Tuyns & Vernhes, 1981 © Masson Editeur, 1981), and (b) Brittany, 1958–66 (modified from Tuyns & Massé, 1973).
(a)
Mortality per 100 000 pyrs. 0 – 19.9 20 – 29.9 Bayeux
30 – 39.9 Caen
40 – 49.9 Lisieux
≥50
Vire Argentan
Alencon
(b)
Mortality per 100 000 pyrs. 0 – 9.9 10 – 29.9 30 – 49.9 ≥50
If information on both place of birth and ethnicity is available, it is possible to distinguish first-generation immigrants (born in the country of origin) from their children, often born in the host country, who are considered as second-generation immigrants. This distinction provides another useful indicator of the likely degree of assimilation by the immigrants of the lifestyle characteristics of the host country, which tends to be more marked in the second than in the first generation. 234
Studies based on routine data
Example 11.4. Data on deaths registered in Australia during the period 1964–85 were obtained from the Australian Bureau of Statistics to examine mortality from malignant melanoma of the skin in immigrants compared with Australian-born individuals, and to investigate changes in risk with age at arrival and duration of stay. Each death record contained information on the following items: sex, country of birth, duration of stay in Australia, year of death, age at death, and cause of death (Khlat et al., 1992). Some of the results from this study are shown in Figure 11.3. 1 England Ireland, Scotland and Wales Central Europe
0.8
Eastern Europe
Relative risk
Southern Europe
Figure 11.3. Relative risks (RRs) of mortality from melanoma in male European immigrants to Australia, by region of birth and age at arrival compared to Australian-born (taken as the baseline group: RR=1); Australia, 1964–85 (reproduced with permission from Khlat et al., 1992).
0.6
0.4
0.2
0
�15
15-24
25�
Age at arrival (years)
In Example 11.5, there was a consistent pattern: the risk for all four cancer sites converged towards the risk in the host country. For stomach and liver cancer, both of which were more common in Japan than among whites in the United States, men who were born in Japan but migrated to California had considerably lower risks of death than men of the same age in Japan. But risks in the second generation were still lower. In contrast, the risk of colon and prostatic cancers, which were common in California but rare in Japan, rose to approach that of white men in California with migration. These findings clearly show the importance of environmental factors over genetic factors linked to ethnicity. There was still a residual difference between rates in second-generation immigrants and rates in California. These residual differences might reflect differences in genetic susceptibility to these malignancies or, alternatively, they might indicate that second-generation immigrants maintained some of the ‘traditional’ Japanese lifestyle. 235
Chapter 11
Example 11.5. In a study of Japanese migrants living in California, the mortality from common forms of cancer in first- and second-generation migrants was compared with the corresponding rates for California and Japan (Buell & Dunn, 1965). Figure 11.4 shows results for four of these common cancer sites: stomach, liver, colon and prostate. Figure 11.4. Age-adjusted mortality rate ratios (RRs) for cancer of the stomach, liver, colon and prostate among Japanese men in Japan, and first- and secondgeneration Japanese immigrants to California, compared with white men in California (taken as the baseline group: RR=1); Japan, 1958–59 and California, 1956–62 (data from Buell & Dunn, 1965).
STOMACH: California. White 2nd generation 1st generation Japan LIVER: California. White 2nd generation 1st generation Japan COLON: California. White 2nd generation 1st generation Japan PROSTATE: California. White 2nd generation 1st generation Japan 0
1
2
3
4
5
6
7
Rate ratio
Any differences in cancer risk between migrants and those who remained in their country of origin must be interpreted cautiously, however, since migrants are usually a self-selected group not representative of the population of their country of origin. Migrants are also likely to differ from the host population in a number of demographic and socioeconomic characteristics that should be taken into account when comparing risks. In Example 11.6, most of the migrants originated from the southern part of Italy, which had lower mortality from pancreatic cancer than the country as a whole. In routine-data-based studies, migrants are identified on the basis of place or country of birth and ethnicity and, when information on these two variables is not available, on the basis of name analysis. More rarely, information on language and religion has also been used. It should, however, be kept in mind that these approaches do not yield similar results. For instance, some of the people born in the Indian subcontinent who migrated to England and Wales are, in fact, of Caucasian ethnicity. Thus, analyses exclusively based on country of birth will include first-generation migrants regardless of their ethnicity. By contrast, analyses exclusively based on ethnicity will include migrants of a particular ethnic group regardless of whether they are of first or of subsequent generations. 236
Studies based on routine data
Example 11.6. Mortality from cancer of the pancreas in Italian migrant men was compared with mortality in their country of birth (Italy) and with mortality in eight host countries. Most of the Italian migrants originated from southern Italy. In order to attempt to allow for selection bias, relative risks (RR) were examined for both southern Italy and the whole country. Figure 11.5 shows that, for instance, mortality from pancreatic cancer was much lower in southern Italy (RR = 0.38) and in the whole of Italy (RR = 0.65) than in Canada (taken as the baseline: RR = 1). However, the mortality in Italian migrants to Canada was close to that of the host population (RR = 0.93) (Balzi et al., 1993). Relative risk (logarithmic scale) 0.1
1
10
CANADA S. Italy
0.38 0.65
All Italy
0.93
Migrants UK, England & Wales
S. Italy
0.42 0.69
All Italy
0.94
Migrants AUSTRALIA
S. Italy
0.45 0.76
All Italy Migrants UK, Scotland
S. Italy
1.03 0.49
All Italy
0.79
Migrants
0.75
URUGUAY
S. Italy
0.50
All Italy
0.83
Migrants ARGENTINA
S. Italy
0.80
0.54
All Italy Migrants FRANCE
S. Italy All Italy
Figure 11.5. Relative risk (RR) of mortality from pancreatic cancer in Italy (South, all Italy), and in eight male Italian immigrant populations compared with the host country populations (each taken as the baseline group: RR=1) (reproduced with permission from Balzi et al., 1993).
0.88 0.85 0.56 0.91
Migrants
1.10
BRAZIL, São Paulo S. Italy All Italy Migrants
0.88 1.42 1.15
237
Chapter 11
Example 11.7. Death records from residents in São Paulo County (Brazil) during 1978–82 were examined to investigate socioeconomic differentials in cancer mortality. The death certificates contained information on sex, age, place of birth and residence, cause of death, marital status, education and last occupation of the deceased. Information on education was provided by the family of the deceased, as years of schooling, recorded in five categories: less than 1, 1 to 8, 9 to 11, 12 or more, unknown (Bouchardy et al., 1993). Table 11.2 shows educational differentials in mortality in females from cancer at selected sites. Table 11.2. Mortality from selected cancer sites by years of schooling, for females aged 35–64 years in São Paulo (Brazil), 1978–82.a
Cancer site (ICD-9 code)
No. of Educational Odds ratio by years deaths level unknown of educationb d (%) 11
χ2 test for trend c
Stomach (151)
691
6.2
1.0
0.7
0.3
0.3
43.5; P