2 Director and Professor, Georgia Tech Savannah, Savannah, GA. 3 Department of Civil and Environmental Engineering, Georgia Institute of Technology, ...
North American Society for Trenchless Technology (NASTT) NO-DIG 2006 Nashville, TN March 26-28, 2006
STUDIES OF INTERFACE FRICTION BETWEEN JACKING PIPE MATERIALS AND FRICTIONAL SOILS AND THE IMPACT ON JACKING FORCES Kimberlie Staheli1, David Frost2, and Mehmet Iscimen3 1 2 3
Bennett/Staheli Engineers, Seattle, WA Director and Professor, Georgia Tech Savannah, Savannah, GA Department of Civil and Environmental Engineering, Georgia Institute of Technology, Atlanta, GA
ABSTRACT: A series of studies have been conducted at Georgia Institute of Technology to study the interface frictional behavior between a variety of jacking pipe materials and frictional soils. The pipe materials which included Polycrete, Hobas, Vitrified Clay, Permalok, and Concrete (both dry-packerhead and wet cast) were characterized to define the surface roughness. Each pipe material was then sheared against a variety of granular soils to determine the mechanism of shearing at the interface. The results of the laboratory analysis are currently being compared to the field performance of these pipe materials under similar soil conditions and the magnitude of the jacking forces in the field.
1.0
BACKGROUND
1.1
Motivation for the Studies
A number of Engineers and Scientists have analyzed jacking forces on microtunneling and pipe jacking projects in order to lend to the understanding of the mechanisms that control these forces and to establish a means of predicting jacking forces. These studies have been based on ground behavior and empirical data and have taken place in Germany, Japan, the UK, and the US. Stein presented an approach in 1989 (Stein et al, 1989) based on ground behavior and empirical data summarized by Salomo (1979), Scherle (1977), Weber (1981), and Herzog (1985). Milligan and Norris (1993) performed pipe jacking tests in the UK and developed guidance for the prediction of jacking forces based on these tests. The International Society for Trenchless Technology-- International Working Group No. 3 (ISTT-IWG No. 3 draft) reviewed a tremendous amount of jacking force data, attempting to develop an empirical approach for predicting jacking forces. Bennett (1998) built test beds with a variety of soil types through which he performed microtunneling tests and analyzed the jacking force data, comparing the data on the tests to field data and developed a model for predicting jacking forces.
Paper D-2-04 - 1
All of the work that has been completed to date has advanced the state of the industry and led toward a better understanding of jacking force behavior. However, the results of the previous studies gave highly mixed results and did not provide for accurate jacking force predictions on projects with different parameters, such as alternate pipe materials, soil conditions, installation depths, etc. This led to the need for a better understanding of the shearing mechanism and the frictional behavior at the interface between the pipe material and the soil during jacking. It was hoped that with a better understanding of the mechanism of shearing at the interface, the development of the jacking forces could be better understood, controlled and predicted. 2.0
CHARACTERIZATION OF PIPE MATERIALS
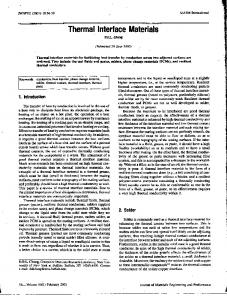
In order to examine the interface behavior of the jacking pipe and soil, each pipe material had to be characterized. Characterization of the pipe involved determining the surface roughness of each pipe material on a micro level. The surface roughness of each pipe material was characterized by use of an automated profiling device. A Taylor Hobson Form Talysurf Series 2 stylus profilometer was used to characterize the surface roughness of six pipe materials. The device pulls a stylus across the measurement surface at a constant rate. A 2µm diameter sapphire ball was used at the tip of the stylus. During each test, the profilometer traversed 50 mm of the pipe surface, creating a representative surface profile. The vertical position of the stylus was recorded at specified length increments. During the test, a two-dimensional profile of the surface was created. The profile obtained by the stylus profilometer does not provide the exact surface characteristics of the material as it is influenced by a variety of factors including the size of the stylus tip, the load on the stylus, and any perpendicular movement of the stylus. Profiles were measured at six locations for each pipe material. Five surface profiles were completed at each of the six locations for each pipe material. In addition, one surface profile at each of the six locations was repeated five times. This was completed to determine the repeatability of the measurement and to ensure that the trace of the profilometer was not altering the surface of the pipe. A total of 54 surface profiles were generated for each pipe material. Figure 1 shows a diagram with the typical arrangement for the profilometer tests and photographs of the testing program. From the stylus profilometer profile, the average roughness, Ra, was determined. The repeatability was analyzed by evaluation of the average roughness parameter. The average Ra was determined for each set of repeatability tests. The standard deviation was then calculated and then compared to the value of the average Ra.
Locations A-F 1 (repeated 5 times) 2 3 4 5
Figure 1. Typical Arrangement for Pipe Surface Profile Testing 2.1
Pipe Materials Included in the Study
The pipes materials that were included in the study were those commonly used on microtunneling and pipe jacking projects. These included centrifugally cast glass fiber reinforced polymer mortar (Hobas), polymer concrete pipe (Polycrete), Vitrified Clay pipe (VCP), Steel with the standard Permalok joint and
Paper D-2-04 - 2
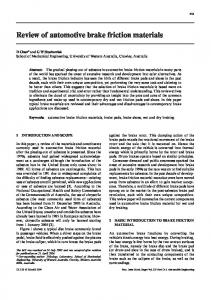
coating (Permalok), and two types of concrete: wet cast and dry cast concrete. Figure 2 shows some of the pipe materials during the laboratory testing phase of the surface roughness characterization.
Wet Cast Concrete
Vitrified Clay
Polycrete
Hobas (CCRFPM)
Figure 2. Pipe Materials During Surface Characterization In addition to the pipe materials tested, two artificially rough surfaces were created by gluing No.60 and No.36 sandpaper to the Hobas pipe sample. The surface roughness of these artificially “rougher” pipes were measured to obtain a wider range of surface roughness magnitudes. 2.2
Roughness Parameters
The pipe surface was characterized by quantifying the average roughness Ra. Once the average roughness of each pipe material was determined, the shear behavior of the soil-pipe interface could then be further investigated to determine the effect on jacking forces. The average roughness Ra is a universally recognized parameter and is defined as:
⎛L ⎞ ⎜ ∫ | z ( x) | (dx) ⎟ ⎜ ⎟ 0 ⎝ ⎠ Ra = L
(1)
The average roughness parameter, Ra, was then used to relate the surface roughness of the pipe with the interface shear strength between the different pipe materials and frictional soils later in the study.
Paper D-2-04 - 3
2.3
Results of Pipe Characterization
The results of all the surface roughness measurements are summarized in Table 1. Some of the pipes, such as the wet cast concrete and the polymer concrete, had a high variation in the average surface roughness value, whereas other pipes, such as the Hobas pipe, had a rather small variation over the surface area of the pipe. Figure 3 shows the results of all of the surface roughness measurements, showing average roughness with corresponding error bars. Hobas had the lowest average roughness with the smallest variability and vitrified clay pipe had the highest average roughness value. Wet cast concrete had the highest coefficient of variation of 78.5%. Table 1 Results of Surface Roughness Characterization Parameter
Average Ra STDEV % Stdev /Aver Repeatability
Hobas CCRFP
Polycrete
Permalok
Wet Cast Concrete
Dry Cast Concrete
Vitrified Clay Pipe
6.5 1.2 18.3% 2.7%
16.9 9.4 55.3% 1.5%
18.7 8.8 47.2% 4.4%
24.8 19.5 78.5% 3.7%
55.1 10.6 19.2% 2.5%
93.8 12.2 13.0% 1.9%
No. 60 Sandpaper 60.8 4.1 6.7% 5.7%
No. 36 Sandpaper 143.2 15.7 11.0% 1.3%
WCC: Wet Cast Concrete DCC: Dry Cast Concrete SP: Sand Paper
DCC
Figure 3 Average Surface Roughness (Ra) of various pipe materials
3.0
INTERFACE SHEAR TESTING
Once the pipe surfaces were characterized, a series of interface shear tests were performed with frictional soils to determine the effect of the surface roughness on the interface shear strength. In addition to surface roughness, particle angularity, relative density, and normal stress were also examined to determine their impact on the interface shear behavior. Paper D-2-04 - 4
3.1
Details of the Shear Testing Program
The experimental testing program was conducted with two different types of sand, Ottawa 20/30 sand with a peak and residual friction angle of 38.9 and 27.9 degrees respectively, and Atlanta blasting sand with a peak and residual friction angle of 43.1 and 34.6 degrees respectively. During the tests, the shear rate was constant and equal to 0.04 inches/min (1 mm/min) and the horizontal displacement range was approximately 2.3 inches. Measurements were recorded every two seconds with approximately 1,800 readings per tests. Tests with the Ottawa 20/30 sands were performed at normal stresses of 40, 80, and 120 kPa. Tests with the Atlanta blasting sand were performed at 80 kPa. Once the testing program began, it was decided to add two additional testing stress levels of 160 and 200 kPa to evaluate the effect of normal stress on the interface shear behavior. Specific details on the testing apparatus used for the shear tests can be found in Iscimen (2004). 3.2
Effects of Surface Roughness
The interface frictional behavior was different for each pipe material tested. The tests showed that as the average surface roughness increased, the coefficient of friction increased. The peak friction coefficient was 0.5 for the smoothest pipe, Hobas, whereas the peak friction value for wet cast concrete was 0.73 under the same conditions. Results of some of the interface shear tests are shown in Table 2. For comprehensive results, the reader is referred to Iscimen (2004). Table 2 Coefficient of Friction of Various Pipe Material Interfaces with Ottawa 20/30 Sand (after Iscimen (2004)) Pipe Material N = 40 kPa Peak Residual 0.51 0.43 0.50 0.42 0.68 0.49 0.68 0.49 0.71 0.50 0.81 0.54 0.80 0.60 0.82 0.61
Hobas CCRFP Polycrete Permalok Wet Cast Concrete Vitrified Clay Packerhead Concrete Sandpaper No. 60 Sandpaper No.36
Coefficient of Friction N = 80 kPa Peak Residual 0.50 0.44 0.49 0.43 0.62 0.44 0.65 0.48 0.63 0.48 0.73 0.53 0.77 0.55 0.76 0.56
N = 120 kPa Peak Residual 0.48 0.42 0.47 0.43 0.62 0.47 0.63 0.45 0.65 0.49 0.73 0.52 0.75 0.55 0.74 0.54
Similar tests were conducted with the Atlanta blasting sand that had a higher friction angle than the Ottawa 20/30 sand and similar results were found: as the pipe surface roughness increased, the coefficient of friction increased for a given normal stress. Table 3 shows the coefficient of friction for the various types of pipe when the shear tests were conducted at a normal stress of 80kPa with the Atlanta blasting sand. Table 3 Coefficient of Friction for Various Pipe Material Interfaces with Atlanta Blasting Sand at 80kPa Normal Stress (after Iscimen (2004)). Coefficient of Friction Peak Residual
Hobas CCRFP
Polycrete
Permalok
Wet Cast Concrete
0.58 0.56
0.53 0.49
0.73 0.58
0.76 0.59
Paper D-2-04 - 5
Vitrified Clay Pipe 0.77 0.61
Packerhead Concrete 0.86 0.62
Sand Paper No. 60 0.87 0.66
Sand Paper No. 36 0.89 0.67
3.3
Effects of Relative Density
To determine the effects of relative density on the interface shearing characteristics, a series of tests was performed on Hobas, wet cast concrete and vitrified clay pipe. Shear tests with Ottawa 20/30 sand were performed at four different relative densities, keeping the normal stress constant at 80kPa. It was found that the peak friction angle increased linearly with the increase in relative density. However, the residual friction angle remained constant. This is attributed to higher interlocking of particles at the interface at higher relative densities, which causes a higher peak friction angle; however, after a certain shear displacement all particle rearrangement is complete and the soil reaches a stable residual condition at which a stable residual friction angle is reached. 3.4
Effects of Normal Stress
The effects of normal stress were evaluated by performing additional shear tests at two additional normal stress levels of 160 and 200 kPa on Hobas, Dry Cast Concrete, and VCP. These tests were performed with Ottawa 20/30 sand at an average relative density of 80%. The results of these tests are presented in Table 4 below. Table 4 Peak and Residual Coeffecients of Friction at varied Normal Stress Levels Normal Stress [kPa] 40 80 120 160 200
Hobas (CCRFP) Relative Peak Residual Density[%] tanδp tanδr 81 0.51 0.43 79 0.50 0.44 78 0.48 0.42 83.9 0.49 0.44 80.3 0.49 0.43
Packerhead Concrete Relative Peak Residual Density[%] tanδp tanδr 83 0.81 0.54 80 0.73 0.53 82 0.73 0.52 80.8 0.70 0.51 84.2 0.69 0.50
Vitrified Clay Pipe Relative Peak Residual Density tanδp tanδr 79 0.71 0.50 66 0.63 0.48 77 0.65 0.49 79.2 0.65 0.48 76.4 0.65 0.49
These tests revealed that the peak interface friction factor tended to decrease with increasing normal stress. However, the residual interface friction factor was essentially constant. These findings were consistent with those found by Archard (1957) and Dove and Frost (1999) that showed that as the normal load is increased, there is a non-linear increase of surface area contact between the soil and material at the interface. This phenomenon was more pronounced in the packerhead concrete which had a higher value of average roughness than in the Hobas pipe that had a lower value of average surface roughness. 3.5
Surface Roughness and Interface Strength
For all of the pipe materials tested, it was found that the interface friction factor increases with the average surface roughness of the pipe material and that the interface friction factor reaches a maximum at a critical roughness value at which the interface friction factor remains constant. The maximum value of the interface friction factor approximates the internal friction factor of the soil that is sheared against the pipe. At the value of the critical roughness, shearing no longer takes place at the interface but moves into the soil mass. This is consistent with the findings of Uesugi and Kishida (1986) who studied planar steelsand interface friction behavior. Figure 4 shows the change in residual coefficient with average roughness for all pipe materials tested for Atlanta blasting sand tested at 80kPa showing the bi-linear relationship.
Paper D-2-04 - 6
Figure 4. Change of Residual coefficient of friction with average pipe surface roughness for Atlanta Blasting Sand at 80 kPa Normal Stress (after Iscimen 2004). 4.0
CASE HISTORY EVALUATIONS
To evaluate the validity of applying the results of the laboratory investigations on the impact of pipe surface roughness and the interface friction factor, an extensive case history evaluation is currently under investigation. The results could be useful in the prediction and control of jacking forces on microtunneling and pipe jacking projects. To date, 13 tunnel drives have been examined in detail. All of the case histories examined were projects on which the authors participated in the construction management of the microtunneling or pipe jacking operations. Detailed records were maintained that were very useful in deciphering information contained on the jacking force records. 4.1
Information Common to all Case Histories
All of the case histories were public projects designed by the pipeline Owner or Design Consultant and tendered for public bid. In all cases, a geotechnical report was prepared prior to the bid. The extent and quality of information contained in the geotechnical report varied widely from project to project. However, during the construction of the projects, soils that were actually encountered during tunneling were closely monitored and soil samples were collected at intervals of 20 feet or less. Therefore, the evaluation of the soil-pipe interface can be based on a post-construction “20/20 hindsight” view of the actual soils encountered during the tunneling rather than on an approximation of the soils based on widely-spaced borings. However, the soils as viewed during tunneling are highly disturbed. Therefore, the information from the boring logs and other soil investigations is tremendously useful in the analysis to approximate the in-situ soil density as well as an estimated friction angle of the soil.
Paper D-2-04 - 7
4.2
Case Histories Included in the Study
Table 5 summarizes 11 of the case histories that are included in the ongoing study. Table 5 Case Histories included in the Evaluation Project Name and Tunnel
Pipe Diameter
Pipe Material
Drive Length [feet]
Geotechnical Conditions
Ground Water Above Invert [ft]
Eastside Interceptor – Morris Avenue
87-5-inch OD RCP constructed with an 88-inch MT machine with an 89- inch overcut 87-5-inch OD RCP constructed with an 88-inch MT machine with an 89 inch overcut 60-inch OD Casing constructed with a 63-inch OD MT machine
Packerhead Concrete
1,100
25
Packerhead Concrete
680
Permalok Steel
211
Loose liquefiable sands below the water table Loose liquefiable sands below the water table Silt with sand and silty sand
Eastside Interceptor – Houser Way
Clearview Railroad Crossing
25
8
Clearview River Crossing 2001
60 inch OD Casing constructed with a 63-inch OD MT machine
Permalok Steel
580
Sand, Gravel and Cobbles
63
Clearview River Crossing 2002
60-inch OD Casing constructed with a 63 inch OD MT machine 48-inch ID by 59.5-inch OD Class 5 RCP constructed with Open shield Pipe jacking 72-inch OD Casing Pipe installed with 75.5 inch OD MT 72-inch OD Casing Pipe installed with 75.5 inch OD MT 39.4” Carrier Pipe installed w/ Akkerman MT 39.4” Carrier Pipe installed w/ Akkerman MT 18” Carrier installed with Akkerman MT machine
Permalok Steel
1,119
Sand, Gravel and Cobbles
83
Wet Cast Concrete
257
Dense Sand with trace silt
None
Permalok Steel
350
Sand and silty sand
None
Permalok Steel
350
Sand and silty sand
None
Polycrete
727
Sand and Silty Sand
Near Surface-19
Polycrete
793
Sand and Silty Sand
19
Polycrete
400
Silty Sand
2
South .Lake Tahoe Rocky Point HWY 50 Crossing
Sacramento Intake North Tunnel Beneath I-5 Sacramento Intake South Tunnel Beneath I-5 Alvarado Blvd Trunk Sewer 34+48 to 41+65 Alvarado Blvd Trunk Sewer 49+58 to 41+65 Alvarado Blvd Trunk Sewer 75+50 to 79+50
Paper D-2-04 - 8
4.3
Evaluation of Tunneling Data
The tunnel machine parameters were evaluated in great detail for each of the tunnel drives examined. These parameters included jacking force, steering jack pressure and force, tunnel machine torque, slurry pressures and flow rates, tunneling advance rates, lubrication practices, steering and deviations, and any significant down-time events. In addition, all operator logs were examined to note any significant operational factors such as the machine stalling, problems with the control systems, or any malfunctions. 4.4
Face Pressure Force versus Frictional Loading on the Pipeline
It is commonly accepted that the overall jacking force is made up of two components, the face pressure force and the frictional loading along the pipeline as follows:
JFTotal = F face + F friction
(2)
It has further been accepted that the face pressure force acts upon the area of the microtunneling machine face and lie within a wide range between the active and passive earth pressures at the depth of the tunnel. However, field observations show that actual face pressures are highly dependent on operational practices and can vary markedly between operators depending on operational style (i.e. and aggressive versus a conservative operator). To remove this operational variation from the data, the frictional component of the jacking force was isolated by subtracting the face pressure loading from the total jacking load measured at the main jacks. Measurements of face pressure loads were taken at the main steering jacks located in the head of the microtunneling machine in most cases. These pressures were converted to a force based on information provided by the machine manufacturer and ratings on the steering cylinders. In other cases, total steering pressures were recorded at the main bearing of the machine located in the head. Again, like the steering jacks, these pressures were converted to forces based on information provided by machine manufactures. By subtracting these forces measured directly behind the microtunneling head and subtracting them from the total jacking load, the interface shear characteristics along the pipeline during jacking operations could be isolated and evaluated. 4.5
Jacking Force Plots
For each tunnel drive, the frictional component of the jacking force was plotted as a function of tunnel drive length. Figure 5 shows the frictional component of the jacking forces for the Snohomish River Crossing, noting significant soil changes.
Paper D-2-04 - 9
Clearview Snohomish River Crossing 2002 Frictional Component of Jacking Force Entire Drive 600
Jacking Force (tons)
500 400 300 200 100 Older Alluvium
Transition Beds
0 0
100
200
300
400
500
600
700
800
900
1000
1100
Distance (feet)
Figure 5 Frictional Component of the Jacking Forces for the Snohomish River Crossing with 60-inch Permalok Pipe. The jacking force plots were then broken down further into sections for detailed analysis. These subsections of the jacking force plot were chosen for further analysis based on specific analysis of the drive record, knowledge of the construction, changes in depth of cover, changes in the soil encountered during tunneling, and other notable features, allowing isolation of tunneled length over which the interface friction could be studied with other variables relatively constant. For example, if the depth of cover, soil type, and lubrication practices were all changing throughout a particular region, it would not be possible to isolate which factor was affecting the interface shear behavior. Therefore, this analysis was isolated to sections where parameters such as depth of cover, soil type, or lubrication practices remained relatively constant. Results of the case history analysis will be completed in mid-2006. With the completion of the results, conclusions regarding pipe surface roughness and the impact on jacking forces in pipe jacking operations will be provided. 5.0
CONCLUSIONS
Laboratory testing has conclusively shown that the surface roughness of various pipe materials has an impact on the friction factor at the pipe-soil interface. Understanding the mechanism of shearing at the interface between jacking pipes and a variety of frictional soils will lead to a better approach for the prediction of jacking forces. A number of case histories are currently under investigation and have revealed that the pipe surface characteristics have an impact on jacking forces on microtunneling and pipe jacking projects. By using pipes with low average surface roughness characteristics, jacking forces may be decreased and have an impact on the pipe jacking process. Modifications to pipes with high average surface roughness characteristics, to lower the surface roughness characteristics, could have a impact on jacking forces in the field resulting in benefits to pipe jacking projects. 6.0
REFERENCES
Archard, J.F. (1957). Elastic Deformation and the Laws of Friction. Proceedings of The Royal Society of London, Series A, Mathematical and Physical Sciences, Vol.243, Issue 1233, pp. 190-205.
Paper D-2-04 - 10
Bennett, R. D. (1998). Jacking Forces and Ground Deformations Associated with Microtunneling. Dissertation in Partial Fulfillment of the Requirements for the Degree of Doctor of Philosophy in Civil Engineering. University of Illinois at Urbana-Champaign, 1998. Dove, J.E. and Frost, J.D. (1999). Peak Friction Behavior of Smooth Geomembrane-Particle Interfaces. Journal of Geotechnical and Geoenvironmental Engineering. ASCE. Vol. 125, No.7, pp.544-555. Herzog, M. (1985). Die Pressenkräfte bei Schildvortrieb und Rohrvorpressung im Lokkergenstein. BMT, Issue 6, pp. 236-238. (As summarized in Stein et.al. 1989). Iscimen, M. (2004). Shearing Behavior of Curved Interfaces. Thesis presented in partial fulfillment of the Requirements for the Degree of Masters of Science in Civil and Environmental Engineering, Georgia Institute of Technology. July, 2004. Milligan, G.W. and Norris, P. (1993). Pipejacking Research Results and Recommendations. UK Pipejacking Association. London. Salomo, K.P. (1979). Experimentelle und theoretische Bestimmung der Pressenkräfte und der Bodenverformung beim Vortrieb eines Vorpreβrohres in rolligen Böden. Dissertation. Technische Universität Berlin. (As summarized in Stein et al, 1989). Scherle, M. (1977). Rohrvortrieb Part 2. Vauverlag, Wiesbaden/-Berlin. (As summarized in Stein et al. 1989), Stein, D., Möllers, K. and Bielecki, R. (1989). Microtunneling: Installation and Renewal of Non-Man Size Supply and Sewage Lines by the Trenchless Construction Methods. Ernst and Sohn, Berlin, Germany. Weber, W. (1981). Experimentelle Untersuchungen in rolligen Böden zur Dimensionierung von Preβbohranlagen. Dissertaion. Wissenschaftlicher Bericht aus der Arbeit des Institutes für Baumaschinen und Baubetrieb der Rheinisch-Westfälisch Technischen Hochschule Aashen, RWTH Aaschen. (As summarized in Stein et al. 1989). Uesugi M. and Kishida, H. (1986). Frictional Resistance at Yield between Dry Sand and Mild Steel. Soils and Foundations. Vol.26, No. 4, pp. 139-149.
Paper D-2-04 - 11